Assessment of the Dielectric Type Test Currently Applied on Mass-Impregnated Non-Draining HVDC Cables
Authors
M. RUNDE, Ø. HESTAD, N. MAGNUSSON, H. ENOKSEN
SINTEF Energy Research, Norway

Summary
The technology and the operational patterns of HVDC links are changing, and therefore, the type test requirements for mass-impregnated non-draining HVDC cables are currently being reconsidered. A CIGRÉ working group is preparing a revised type test recommendation. Measurements and numerical modelling (without any connection to the CIGRÉ effort) of the of internal pressure, temperature and electric field distributions in mass-impregnated non-draining cables subjected to different environmental and loading conditions have recently been carried out. With basis in this work, it is discussed and assessed how well the loading cycle and polarity reversal test duties applied in the existing type test reflect the stresses such cables may experience in service. In particular, the potential risk associated with formation of shrinkage cavities after load reduction is considered. Most of the provisions in the existing type test are found to be appropriate and reasonable, but a few possible improvements are proposed. Including a preconditioning procedure prior to the load cycling duties could make the type test more realistic as it would also include the contributions to the internal pressure from slow deformations of the lead and polyethylene sheaths. Moreover, introducing load cycling duties with currents beyond the rated load current and with shorter loading times (e.g., 0.5, 1 or 2 h) and at an intermediate ambient temperature (e.g., 20–30 °C) as a part of the dielectric tests could qualify a mass-impregnated non-draining cable for temporary overloading.
Keywords
HVDC cables – Mass-impregnated non-draining cables – Type test – Cable insulation1. Introduction
The procedures and requirements currently applied for dielectric type testing of mass-impregnated non-draining (MIND) HVDC power transmission cables are given in CIGRÉ's Electra no. 189 issued in 2000 [1], and in an addendum in Electra no. 218 from 2005 [2]. Whether this type test still is appropriate and relevant is a matter of discussion, mainly because: i) the technologies of HVDC links (both cables and converter stations) are changing, ii) the operation patterns have become more challenging with rapid and large load changes, and iii) the behaviour of the insulation system of MIND cables is not yet fully understood. Against this background, CIGRÉ established in 2018 Working Group B1.66 tasked with reviewing these testing recommendations.
The insulation system of MIND cables is associated with certain peculiarities [3]. It consists of two components—paper and high viscosity oil (often referred to as "mass")—with very different thermal expansion and contraction. After large and rapid load reductions and accompanying temperature drops in the cable, the mass contracts far more than the paper, and if the pressure becomes sufficiently low, shrinkage cavities or voids may form in the insulation. Such cavities are weak points, as they are prone to partial discharging. The understanding of these phenomena is limited, but the general perception is that under certain conditions the cavities may become so large that the partial discharges are so powerful that they cause carbonization. This process leads to permanent damages that gradually degrades the insulation. Consequently, to verify that a MIND cable can handle rapid cool-downs the dielectric type test includes extensive load cycling duties.
Obviously, the risk of having harmful shrinkage cavities is related to the internal pressure in the insulation; more precisely when ambient and operating conditions cause the pressure to stay at a very low level (close to vacuum) for an extended time. The pressure levels and distribution throughout the insulation are in turn determined by a multitude of cable design, operational and environmental factors. To increase the knowledge and identify the critical parameters, extensive experimental work on 4–5 m long samples of full-scale MIND cables has been carried out recently [4–6]. Internal pressure and pressure dynamics in the insulation under different ambient and loading conditions received much attention. Furthermore, as a compliment to the measurements, a numerical model that reproduces the pressure readings quite well has been developed [7]. The model also determines temperature and electrical field distributions in the insulation under dynamic conditions, which is a far simpler task.
In the present work this numerical model is applied for the dielectric test duties of the current type test that include load cycling. The quantitative information coming out of such simulations provides new and additional perspectives concerning the suitability of the type test. Temperature, electric field, and internal pressure at the innermost and outermost layers of the insulation during the two test duties that involve load cycling will be presented. On this basis it is discussed and assessed how well these parts of the type test reflects the stresses MIND HVDC cables may experience in service. It is considered especially important to identify whether changing operational conditions such as fast load up- and down-ramping, short-term overloading, and rapid polarity reversal, are properly covered.
This work has been carried out without interaction with, or knowledge of the work within the above mentioned WG B1.66.
Initially, a brief overview of the three dielectric test duties is given, including calculating and comparing the maximum electric fields generated during type testing of a typical state-of-the-art MIND cable.
2. The Dielectric Test Duties of the "Electra no. 189" Type Test – An Overview
Before delving into the details of stresses and testing requirements, it is important to recognize MIND HVDC subsea cables' excellent track record. Most failures in service have been caused by external mechanical factors such as anchors and trawl doors.
This experience may — in our view — provide support for contradicting viewpoints about the suitability of the current type test. On one hand, it can be maintained that this demonstrates that the existing type test has served its purpose in an excellent way and, therefore, should not be relaxed or changed. On the other hand, based on the rarity of dielectric breakdowns seen in failure statistics, it could be claimed that the type test probably is too severe and has caused excessive safety margins to be built in, thereby not fully exploiting the power transmission capability of MIND cables.
The dielectric part of the type test succeeds the mechanical test and consists of three test duties: i) a loading cycle test, ii) a polarity reversal test, and iii) lightning impulse / voltage surge tests. Some of the test conditions and requirements are explicitly listed in the Electra no.189, whereas other are deduced from cable ratings / characteristics / properties agreed upon between the cable manufacturer and the client. To be able to specify the parts of the dielectric type test considered here, the following parameters must be declared:
- Rated voltage U0
- Rated current I0
- Lightning impulse withstand voltage UP1
- Switching surge withstand voltage UP2
- Maximum rated operation temperature of the conductor
- Minimum and maximum ambient temperature in the installation
- Maximum temperature drops across the insulation and between the conductor and ambient
Usually, the type test program is carried out for both the highest and lowest ambient temperatures in the installation using two test objects (except for the lightning impulse / voltage surge tests which are only done at the highest temperature of the installation).
Under the loading cycle test and the polarity reversal test, Electra no. 189 explicitly states that the test voltages should be 1.8U0 and 1.4U0, respectively. For the impulse tests, in contrast, no specific voltage levels are prescribed, and this must be agreed upon between vendor and client. Typical values have been in the range 1.8–2.8U0, with the higher values in older projects.
The maximum electric field the insulation experiences during these tests does not depend solely on the test voltage but is also a function of conductor temperature and temperature gradients in the insulation. Moreover, an uneven space charge distribution also contributes to the field. Changing the load or the polarity causes the space charges in the insulation to start moving, but this movement is slow, particularly at low temperatures. It takes a considerable time (several hours and even days) before a space charge redistribution is completed. Some of the type test duties include load and polarity changes that take place before the space charge distribution has settled. Consequently, when determining the electric field in the insulation during a type test, the "dynamics" of the space charges also need to be considered. In practice, numerical modelling must be applied.
Some ideas about the magnitude of the electric field during type testing can, however, be obtained by taking the simpler approach by assuming that stationary conditions — both with regard to temperature and space charge distributions — have been reached at each polarity or load change. By using this simplified method and applying the dimensions and ratings for a typical modern 700 MW cable as an example, the maximum field is calculated for each of the three duties. Table I lists the results. Einner and Eouter refer to the field at the innermost and outermost part of the 20 mm thick insulation layer, respectively. Egeo denotes the geometrical or Laplacian field, whereas Estat denotes the field when stationary conditions have been reached, i.e., after the space charge distribution has settled. Estat is calculated by an iterative algorithm that accounts for the space charge distribution under the actual temperature profile in the insulation [8]. The conductor temperature is in the calculations set to 20 and 55°C which corresponds to ambient temperatures of approximately 5 and 40°C. An impulse test voltage of 2.2U0 and standard values for the resistivity of the copper conductor and for the electrical conductivity of mass-impregnated paper are used [3].
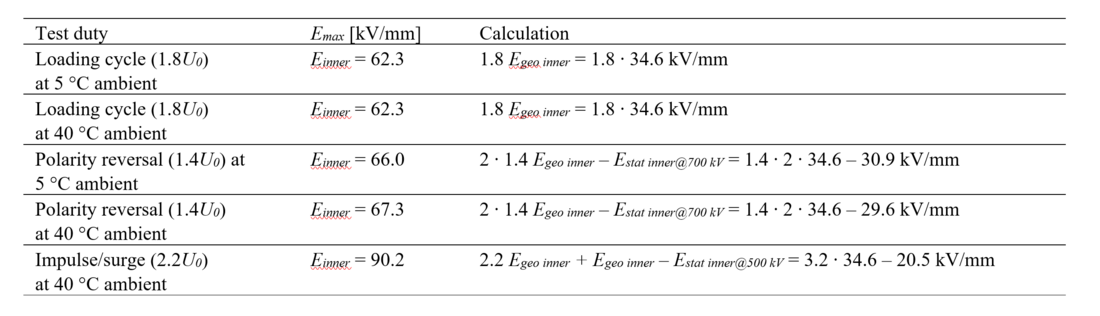
Table 1 - Maximum electric field during the different test duties of the dielectric type test calculated for a typical 1600 mm2 / 500 kV / 1400 A cable. A simplified model was used, assuming that stationary conditions have been reached before load and polarity are changed.
In all duties of the dielectric type test, the maximum field occurs in the innermost part of the insulation.
The intrinsic dielectric strength of mass-impregnated paper insulation is typically in the range 115–125 kV/mm [9]. With the simplified approach and the values used in the calculations, the maximum electric fields of the three test duties become for this cable approximately 50%, 55% and 75% of the intrinsic strength, with the impulse testing creating by far the highest field. The impulse/surge test voltage must be lowered to around 1.6U0 for the maximum field to become comparable with that of the polarity reversal test.
For the sake of comparison: Immediately after energising a cable (that has not carried current for a while) with rated voltage and rated current, the highest field is near the conductor and is for this cable design 34.6 kV/mm for all temperatures. When stationary conditions eventually are reached, the highest field which is in the outermost layers of the insulation becomes 28.6 kV/mm when the ambient temperature is 40°C. In the innermost part, space charges have now reduced the field to 20.5 kV/mm. Hence, in "normal" service (i.e., without impulse/surge overvoltages and without polarity reversals) this MIND cable will experience an electric field that is approximately 25% of the intrinsic dielectric strength of the insulation. Immediately after polarity reversals the field may reach 48.7 kV/mm or 40% of the intrinsic strength.
3. The Loading Cycle Test
3.1. Existing Test Duty
Fig. 1 illustrates the current and voltage applied during the loading cycle test.
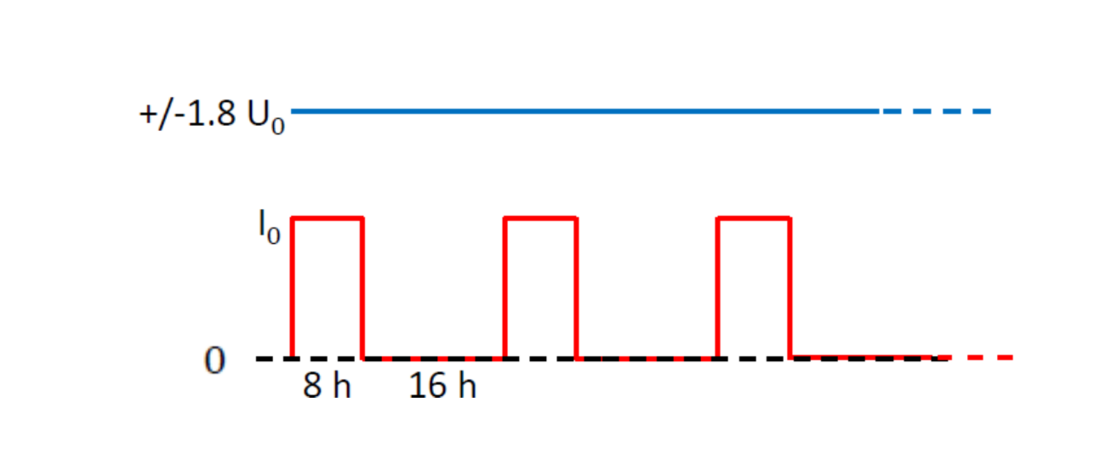
Figure 1 - The loading cycle test (schematically)
The test consists of 10 load cycles (8 h at rated load + 16 h without load) at +1.8U0 and 10 cycles at -1.8U0. It is common to do this test at both the minimum and maximum ambient temperatures for cable systems installed in areas with large seasonal variations, typically at 5 °C and 35–40 °C, respectively.
After finishing the first 10 load cycles and before starting the load cycles with the opposite polarity, there should be a resting time of at least 8 h duration with no current and voltage applied and with the conductor connected to the sheath.
3.2. Modelled Temperatures, Internal Pressures and Electric Fields
The initial conditions used in the modelling assume that the cable has been stored at 22 °C before being placed in the ambient temperature prescribed by the type test, here set to 5 and 40 °C, respectively. The cable is then kept (unloaded and unenergized) at these temperature for 24 h before voltage is applied and the 1400-A load cycling initiates.
The temperatures in the innermost and outmost layers of the insulation are shown in Fig. 2 for the two cases.
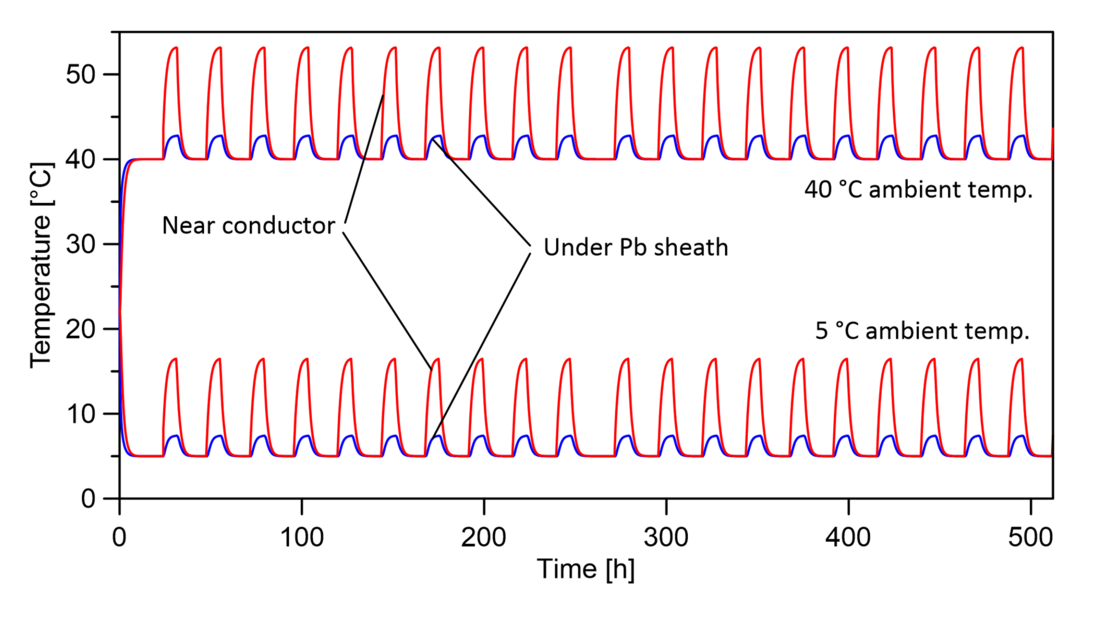
Figure 2 - Temperature near the conductor / in the innermost layers of the insulation (red) and under the lead sheath / in the outermost layers of the insulation (blue) during load cycling at ambient temperatures of 5°C and 40°C.
The modelling shows that the cable's thermal time constant is such that stationary temperature conditions are reached during the 16-h load turn-off period, but not during the 8-h loading part. Hence, the temperature profiles of all load cycles are virtually identical. The temperature drop across the insulation (i.e., the difference between the blue and red lines) becomes approximately 1.5 °C higher at 40 °C ambient than at 5 °C. This is due to the somewhat higher conductor losses at the higher temperature.
Figs. 3 and 4 show the amplitude (i.e., the absolute value) of the electric field and internal pressure in the innermost and outermost parts of the insulation for the two ambient temperatures. Note that the scaling of the pressure axes differs greatly.
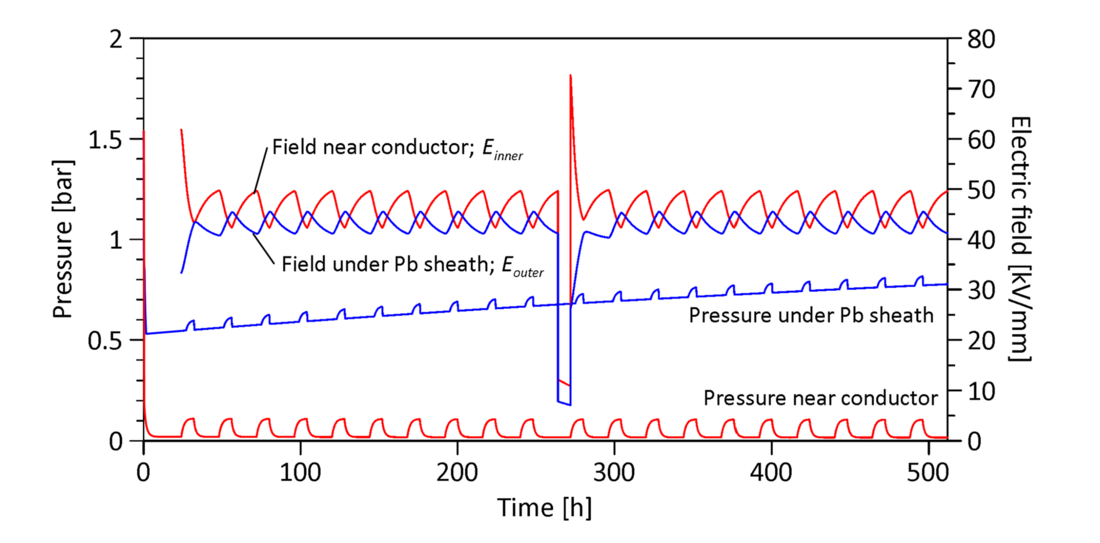
Figure 3 - Pressure and electric field (absolute value) in the insulation near the conductor (red) and under the lead sheath (blue) during load cycling at an ambient temperature of 5°C.
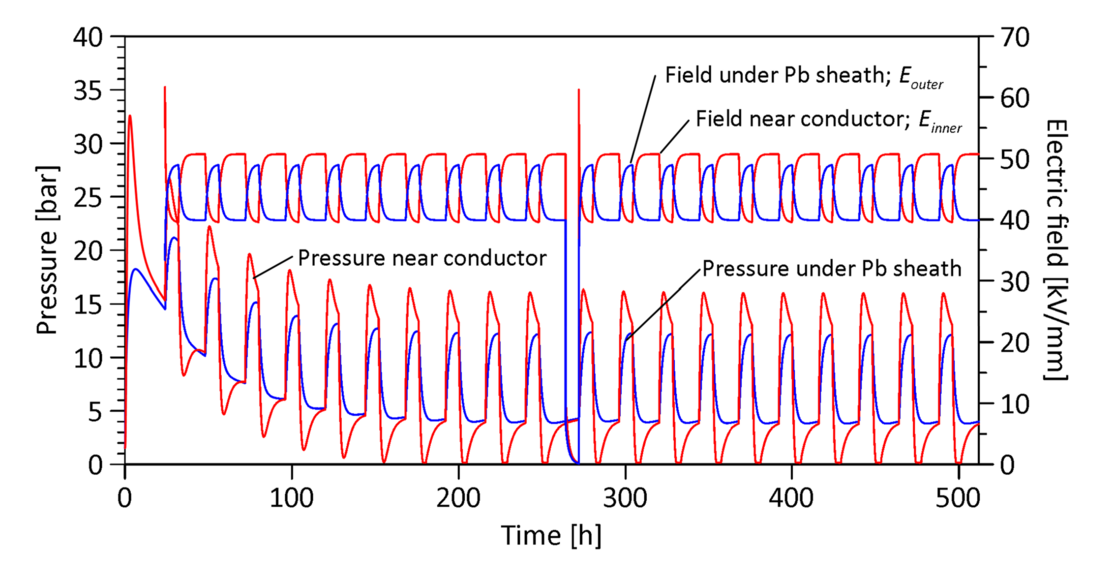
Figure 4 - Pressure and electric field (absolute value) in the insulation near the conductor (red) and under the lead sheath (blue) during load cycling at an ambient temperature of 40°C.
The by far highest dielectric stresses in this duty occur immediately after energising the cable in the first and 11th cycles. In the 5°C case a considerable amount of space charges is still present after the 8-h rest period after the 10th cycle, generating an electric field of around 11 and 7 kV/mm at innermost and outermost layers of the insulation, respectively. When energizing with the opposite polarity at the start of the 11th cycle, this space charge field adds to the field generated by the applied voltage, resulting in Einner peaking at more than 72 kV/mm. However, extending the rest period between the 10th and 11th cycle — which the CIGRE type test permits — makes it possible to avoid this additional contribution to the field also for the cold ambient duty.
For the remaining part, the absolute value of the field remains approximately between 40 and 50 kV/mm in both cold and warm ambient, but the location of the highest stressed area alters, sometimes being the innermost and other times the outermost insulation layers.
The difference in thermal expansion between mass and paper causes the internal pressure in a MIND cable to vary greatly with temperature. At high temperatures the mass expands and increases the pressure, at low temperature it contracts, and the pressure drops. Both the mass and the paper have been carefully degassed during the cable manufacturing so the gas pressure inside shrinkage cavities and in the surrounding mass-impregnated paper may come down to very low levels. At a certain intermediate temperature, here referred to as the "full-impregnation temperature", the volume of the mass is exactly sufficient to impregnate the paper. Then no cavities exist, and the internal pressure in the cable equals the ambient atmospheric pressure. The full-impregnation temperature is mainly determined by the manufacturing process but may not be precisely known. Moreover, the viscoelastic behaviour of the outer sheaths (see Section 5.4) complicates matters further, causing the full-impregnation temperature to change somewhat, depending on the loading and ambient conditions the cable has been exposed to earlier.
When modelling internal pressures, the full-impregnation temperature is a parameter that must be set as an initial condition. It turns out — as expected — that if the average temperature in the insulation is near the full-impregnation temperature, the calculated pressures are very sensitive to the value selected for this parameter. For the current modelling work, the full-impregnation temperature is — somewhat subjectively and based on experience from extensive laboratory measurements of the internal pressure dynamics in MIND cables [4–6] — set to 10°C. This implies that pressure calculations for the loading part of the cycles in a 5°C ambient (where the average temperature in the insulation reaches around 12°C) are less trustworthy than after load turn-offs and during of the load cycling at 40°C.
Changing the ambient temperature from its initial value of 22°C to 5°C or to 40°C, leads to large changes in the internal pressure even before the current cycling starts, see Figs. 3 and 4. In the cold ambient case the internal pressure drops to well below atmospheric and remains so throughout the loading cycle test duty. The low valued found in the innermost part of the insulation suggests that cavities may form here in the cooling part of every cycle. Under the lead sheath the pressure is a little higher, but the small pressure difference across the insulation combined with the high viscosity of the mass at such low temperatures virtually prevent radial mass flow.
This contributes to that the pressure under the lead sheath remains higher than in the conductor also during the loading part of the cycles, even though the temperature near the conductor becomes up to around 10°C higher. A second contributing factor is that the external 1 bar atmospheric pressure, which throughout the load cycles at 5°C is higher than the internal pressure in the cable insulation, exerts a compressive force on the cable and apparently influences (i.e., slightly increases) the pressure immediately under the lead sheath but not as far in as the conductor. Measurements of pressures at both sides of the insulation during load cycling at low temperature have demonstrated that the pressure can be lower near the warm conductor than in the colder parts under the lead sheath [6].
Initially rising the ambient temperature to 40°C increases the internal pressure to more than 32 bar near the conductor and to around 18 bar under the lead sheath, see Fig. 4. The considerable pressure gradient causes a radial mass flow, and after 24 h when the load cycling starts, the gradient has disappeared. Applying load—and thereby generating heat in the conductor and a temperature gradient in the insulation—again brings the pressure up. In the subsequent load cycles the amplitudes of the pressure fluctuations remain large and considerably greater near the conductor than under the lead sheath. After 6–7 load cycles or 150 h the pressure in the innermost part of the insulation drops to virtually zero just after load turn-offs, suggesting that cavities may form. However, compared to the 5°C case, the pressure stays at such a level for a much shorter time. This is consistent with the general experience that cavity-induced breakdowns are more common during the loading cycle test at low temperatures than at high.
4. The polarity Reversal Test
4.1. Existing Test Duty
The current and voltage applied during the polarity reversal test are shown in Fig. 5.
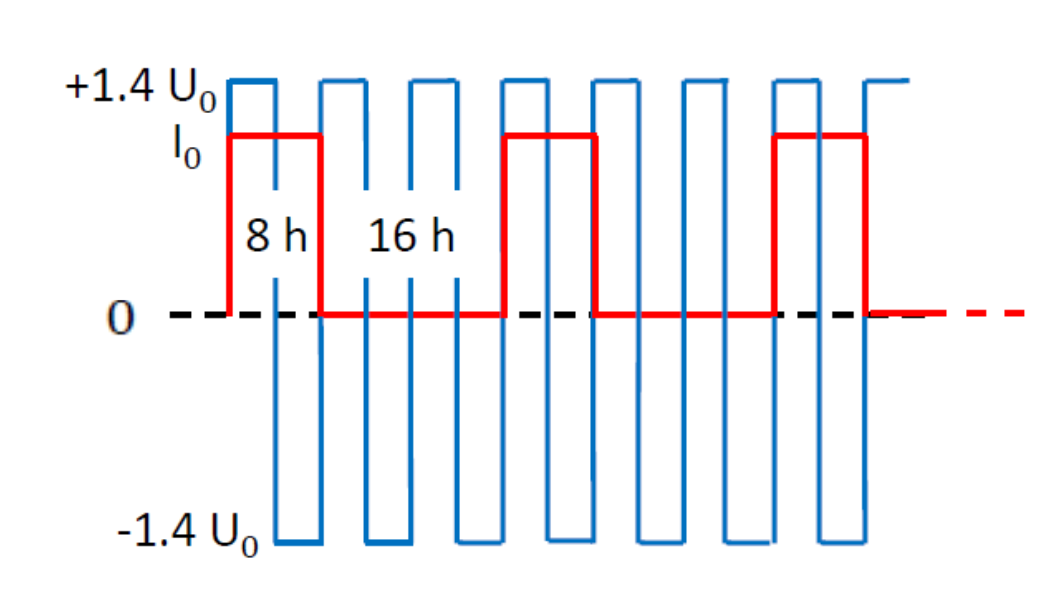
Figure 5 - The polarity reversal test (schematically)
Also in this case 8 h on / 16 h off load cycles are employed, both in warm and cold ambient (typically 5°C and 35–40°C). At each ambient temperature 10 load cycles are carried out. The applied voltage is ±1.4U0, and the polarity is reversed every 4 h, synchronized with the load cycles as shown in the Fig. 5. The recommended duration for the polarity reversal is 2 min.
4.2. Modelled Temperatures, Internal Pressures and Electric Fields
The electric field and pressure close to the conductor and under the lead sheath for ambient temperatures of 5°C and 40°C are shown in Figs. 6 and 7. The electric field distribution is essentially the same in all ten load cycles, so only two cycles are included in each figure. (Obviously, the temperature and the pressure profiles become the same as in the loading cycle test duty presented earlier, see Figs. 2–4.)
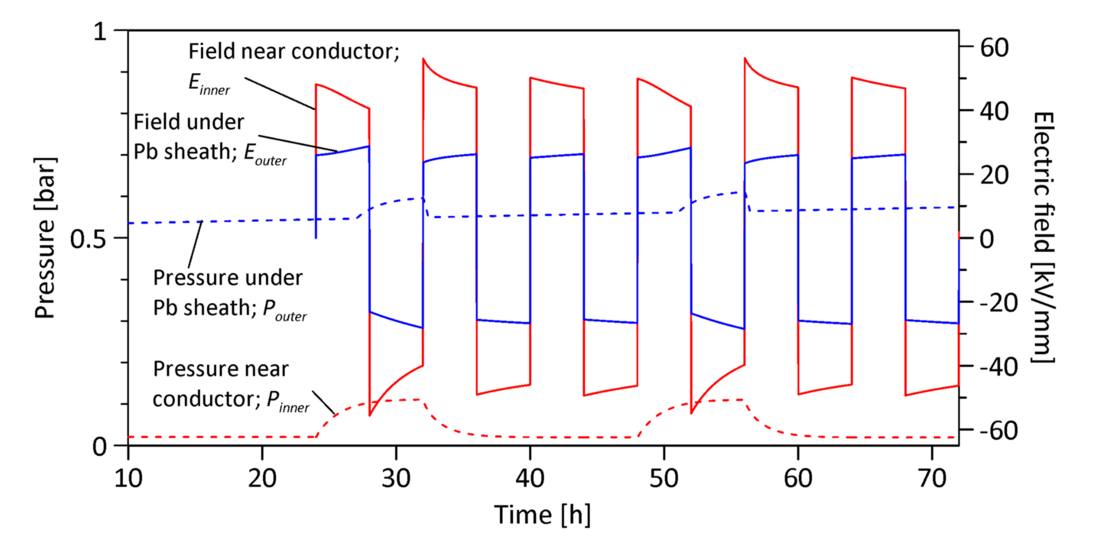
Figure 6 - Pressure and electric field in the insulation near the conductor (red) and under the lead sheath (blue) during the first two load cycles of the polarity reversal test at 5°C ambient
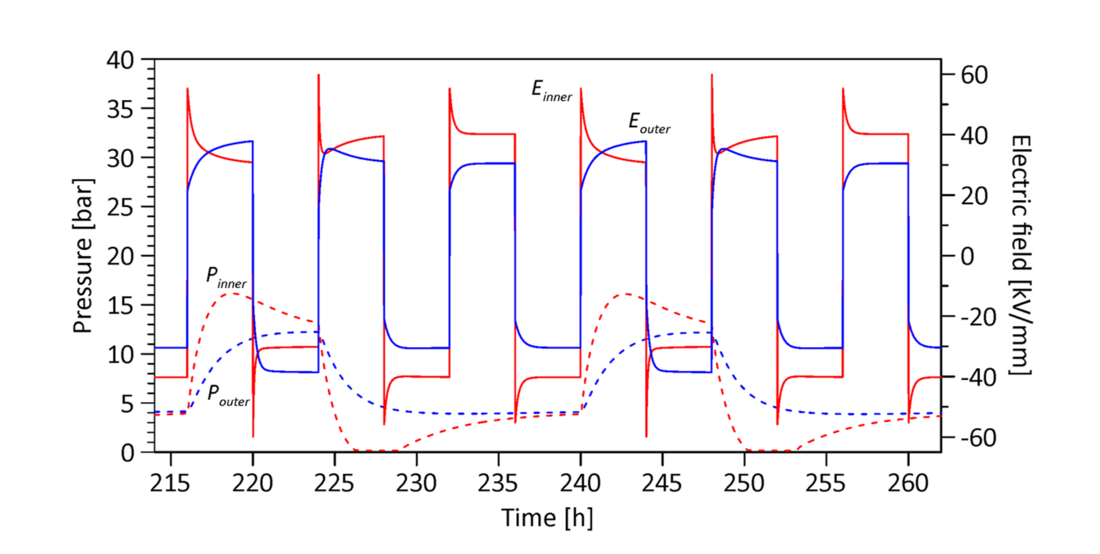
Figure 7 - Pressure and electric field in the insulation near the conductor (red) and under the lead sheath (blue) during the last two load cycles of the polarity reversal test at 40°C ambient
The starts and stops of the current loading parts of the cycles are easily visible as pressure rises and drops near the conductor (broken red line) whereas changing polarity appear as instantaneous changes in the electric field (solid lines).
The highest fields occur immediately after the polarity reversals, with maximum values of approximately 60 and 56 kV/mm in 5°C and 40°C ambient, respectively. For most of the time during this test duty the maximum field is much lower than this, in the range 40-50 kV/mm in cold ambient and 35-40 kV/mm in the warm ambient.
The temperature dependency of the space charge redistribution is evident when comparing how fast the fields change in Fig. 6 and Fig. 7. The field returns much faster towards its steady-state field when the polarity reversal is done on a cable that has been loaded for four hours in a 40°C ambient than after having been unloaded for 12 h at 5°C. This difference is especially visible for the field near the conductor where the temperatures change the most. Within some 20 min after a polarity reversal in the loaded / 40°C case, the space charges have moved to such an extent that the field in the innermost layers of the insulation is reduced by approximately 50%, (see, for example, after 244 h in Fig. 7). In the four hours after a polarity reversal during the unloaded / 5°C case, the electric field at the innermost layers of the insulation is, in contrast, reduced by a mere 6% (see, for example, after 44 h in Fig. 6).
5. Stresses in Service vs. Type Test Requirements
Various aspects of MIND cable operation and ambient conditions that are assumed to be potentially harmful to the integrity of the insulation system will now be reviewed. With basis in the general service experience as well as results from the recent experimental and modelling work, it will be assessed how well the type test reflects the stresses MIND cable may experience in normal service. One phenomenon / property / stress type is considered at a time. Concluding comments and recommendations are given in italic, usually at the end of each section.
5.1. Thermal and Electrical Aging of the Insulation
Material aging caused by thermal and electrical stress is typically simulated by applying a test voltage that is higher than the service voltage for a short time, . The factor K is deduced from so-called V-t characteristics for the considered material under the assumption that the lifetime t at a voltage V follows the inverse power law:
(1)
The inverse power law gives a relationship between test voltage and test duration, and rated voltage and lifetime (both U and V here denote voltage):
(2)
This approach requires knowledge of the exponent n, which needs to be determined empirically from endurance tests. Reliable information about n for mass-impregnated paper subjected to DC stress is, however, not available. It should also be emphasized that applying the inverse power law for modelling of DC-aging of mass-impregnated paper is weakly founded, not based on solid experimental evidence.
Still, Jeroense has used this approach and has by considering dielectric test levels and results from a dissection of a MIND HVDC subsea cable after 30 years of service suggested that n is at least 9.5 [10].
Using n = 9.5, setting the design life to 50 years, the duration of the loading cycle and polarity reversal tests to 500 h and 100 h, respectively (considering that in the polarity reversal test, the highest stress only occurs in a part of the testing time), give Kload cycl = 1.9 and Kpol rev = 2.25. It is here assumed that each test duty "consumes" 25 years, i.e., half of the lifetime. (It is a requirement of Electra no. 189 that the two tests should be carried out sequentially on the same object.)
The numerical modelling shows the maximum field during the loading cycle test of the MIND cable considered stays at around 50 kV/mm, and for the polarity reversal test is around 60 kV/mm. As pointed out earlier, the highest field under stationary conditions at rated current and voltage is 29 kV/mm. This implies that during these test duties the fields are 1.7 and 2.1 times higher, and thus below the levels of 1.9 and 2.25 that are estimated to simulate a full lifetime. In other words, the voltage and the duration of these type test duties are below what the inverse power law approach and n = 9.5 specify for simulating 50 years of material aging at rated voltage. Results from cable dissections following a successful type test support this assertion. Typically, no severe carbonization or other traces of material degradation are found.
On the other hand, to our knowledge no firm and credible observations of material aging and/or increased failure rates have been made on MIND cables, even after several decades of service. Accelerated aging tests of paper grades used in MIND cables show that virtually no thermal aging occurs below 70°C [11]. This indicates that thermal and electrical aging of the insulation material is not a major concern.
Consequently, from a material aging perspective there is no motivation for proposing changes in the voltage or duration applied in the loading cycle and polarity reversal type test duties.
5.2. Formation of Hazardous Cavities After Load Reductions
The load cycling has—at least traditionally—been considered to introduce the most demanding stress of the type tests. As described earlier, thermal contraction of the mass after a load turn-off creates shrinkage cavities, and the resulting partial discharge activity may gradually impair the insulation. Breakdowns typically occur a few hours after a load turn-off, and post-mortem dissections reveal a 1–2 m long, very characteristic carbonized channel in the insulation that appears to have developed over some time [9, 12].
Experience has shown that load cycling in a cold ambient is more demanding than in a warm ambient. This is attributed to a much lower internal pressure in the insulation and thus a greater risk of forming cavities. However, not all shrinkage cavities are harmful. Partial discharges occurring in small voids in the mass-filled butt gaps of the insulation may have so low energies that they do not cause harm, whereas much larger cavities extending between layers, "delaminating" the paper insulation result in powerful partial discharges permanently damaging the insulation. A proper design and manufacturing of the cable's insulation system (with regard to paper lapping tension, impregnation procedures, lead sheath extrusion process, steel band tension etc.) have been found to greatly reduce the risk of having large and harmful cavities [9, 13].
The purpose of the loading cycle test is essentially to verify that the cable design is sound and can handle these "mechanical" and "hydraulic" phenomena taking place in the insulation during load cycling without compromising the dielectric strength. Because the stresses depend greatly on the loading pattern and the ambient conditions the cable is exposed to, these parameters must be carefully defined in the test procedures.
In our previously reported experimental investigations [4, 6] the load was turned off instantaneously; from rated load current to zero. This led to rapid and large drops in the internal pressure. The type test also specifies instantaneous load turn-offs, and the modelling shows that the internal pressure drops to very low levels during load cycling both at 5°C and 40°C ambient. Moreover, the pressure difference across the insulation disappears in both the 16-h and 8-h parts of the load cycle at 40°C ambient. (At 5°C, almost no radial mass flow occurs.) Most importantly, at both ambient temperatures the pressure in the innermost part of the insulation comes down to levels where cavities may form and stays at this level for an extended time (hours) while a high dielectric stress is maintained.
Concerning cavity formation, an instantaneous load turn-off is obviously the most severe case conceivable. MIND cables in service will hardly ever experience an immediate reduction from full load to zero with the rated voltage maintained also afterwards. (System requirements typically specify a maximum power ramping rate, e.g., 30 MW/min, and during faults the voltage is also turned off immediately.)
Applying 24-h cycles has major practical advantages when doing laboratory testing and is a convenient and natural choice.
In conclusion, for testing MIND cables' ability to deal with rapid reductions of the internal pressure and the accompanying cavity formation, a complete and instantaneous load turn-off is a demanding but also appropriate procedure. Using 8-h on / 16‑h off cycles is a good solution.
5.3. Ambient Temperature
The numerical simulations indicate that the internal pressure dynamics, and thereby also the risk of forming dangerous cavities, appear to be very different at 5°C and 40°C ambient temperatures. Cavities do not form unless the pressure in the insulation is well below atmospheric; measurements have suggested a few hundred millibar or less [4–6]. In a 5°C ambient, measurements, modelling and not least type testing experience indicate that such conditions exist and can be challenging.
Hence, specifying load cycling tests at the lowest ambient temperature in the installation appears appropriate.
At 40°C ambient temperature the internal pressure dynamics become different than at 5°C in important ways. The modelling shows much higher pressures, up to more than 25 bar, and larger fluctuations during the load cycles. At such high internal pressures, the steel bands play a crucial role in providing elastic compressive forces that prevent the lead and polyethylene (PE) sheaths, and the insulation to become permanently deformed and damaged. Thus, to ensure that these parts of the cable are properly designed testing at the highest ambient temperatures is necessary.
The electrical conductivity of mass-impregnated paper increases with increasing temperature [2], and at some temperature a MIND cable insulation system will experience a thermal run-away and fail. Testing the cable at rated current and with 1.8U0 in cycles lasting for 8 h at the declared maximum ambient temperature provides reassurance that thermal run-away will not occur in service.
Including load cycling tests at the highest ambient temperature of the installation makes sense as it verifies important capabilities of the cable design and of the properties of the materials involved.
It is reasonable to assume that during load cycling at 5°C ambient cavities exist in the insulation most of the time, whereas at 40°C ambient, there will at most be a few immediately after the load turn-offs (unless the cable has been stored or operated at a high temperature for a long time, see the discussion in Section 5.4). At a certain ambient temperature range somewhere between these extremes, the situation may be quite different. During loading, the warmer parts near the conductor may have a high pressure and no cavities, while the outer, colder parts have plenty of cavities and thus a pressure well below atmospheric. Hence, a large radial pressure gradient now exists in the insulation, forcing mass to flow outwards. Measurements on a MIND cable in room temperature revealed such a situation [3]. When applying rated load current to this cable the pressure difference across the insulation raised from zero to more than 30 bars before slowly levelling off. This is a considerably larger pressure difference than the maximum of some 5 and 0.5 bar expected at 40 and 5°C ambient temperature, respectively, see Figs. 4 and 5.
The outward mass flow may in such a case become substantially larger than under the 5 and 40°C ambient conditions of the current type test, simply because the driving force (the pressure gradient) is larger. More importantly, when turning off the load after the radial pressure gradient has disappeared, the mass will to a far lesser extent migrate back, because the pressure gradient now is lower. Thus, a permanent redistribution of the mass has occurred, leaving the inner and most dielectrically stressed paper layers with a poorer impregnation. Although this description may be simplified as other mechanisms may influence the internal pressure development, for example slow mechanical deformations of the lead and PE sheaths (see Section 5.4), it points at some potentially important aspects of the internal pressure dynamics.
Consequently, load cycling at intermediate temperatures during service may be associated with certain potentially harmful processes not experienced during loading cycle tests at the lowest and highest ambient temperatures.
5.4. Slow Sheath Deformations
Laboratory measurements have shown that if a MIND cable is kept at constant ambient and loading conditions for a long time (several weeks or months) the internal pressure gradually approaches the external pressure [6]. This occurs irrespective of whether the ambient temperature is high or low, whether the cable is loaded or unloaded, and both at atmospheric and elevated ambient pressures. The essential prerequisite is that the conditions remain unchanged. The underlying mechanism is viscoelasticity in the lead and PE sheaths that leads to small and slow mechanical deformations that change the volume enclosing the insulation and thereby also the internal pressure [5].
Hence, the internal pressure — and thus also the tendency for cavities to form after a load reduction — is determined not only by the immediate thermal contraction, but also by the loading and ambient conditions in the previous weeks and even months. However, and this is possibly of considerable importance, the type test will not cover this latter aspect. For example, a cable that has been stored in a warm ambient in the weeks prior to the loading cycle test will have more cavities created after load turn-offs than a cable that has been kept cold before the testing. The reason is that the PE and lead sheaths of the cable that has been kept warm over time have been slightly and slowly plastically deformed, resulting in a somewhat increased volume available for the insulation (accompanied by a corresponding gradual reduction of the internal pressure). The internal pressure in the cable that prior to the testing has been kept cold, in contrast, remains low, and the PE and lead sheaths do not deform, and the volume available for the insulation has not expanded. In other words, the current type test does not properly account for the effects caused by such sheath deformations.
After a load turn-off in a type test, the mass thermally contracts by a similar amount in both cases (assuming the mass is incompressible). However, the "mass deficit" after the turn-off becomes greater in the first case since the volume inside the lead sheath here is a little larger. Presumably, the combined volume of the shrinkage cavities also becomes larger, resulting in a higher risk of cavity-induced problems. Consequently, the combined volume of cavities generated after load turn-offs can — if the current understanding is correct — to some extent be "manipulated" by storing the type test object at a low temperature in the weeks prior to the testing.
Avoiding effects caused by different ambient conditions prior to the testing would require a preconditioning procedure to be included in the test program. However, an appropriate procedure would probably have to last for at least several weeks. This would add considerable time, cost, and complexity to an already very expensive and time-consuming type test program, and thus requires careful considerations and cost/benefit trade-offs.
But again, it is sensible to take into consideration that experimental work has shown quantitatively that the "history" in terms of current loading and ambient temperature of a MIND cable greatly influences the internal pressure. For example, the internal pressure in the same unloaded cable at an ambient temperature of 40°C has been shown to be as different as around 15 bar [5] and around 1 bar [4], depending on what the cable has been subjected to in the previous weeks and months. The tendency to form shrinkage cavities during a load cycling test duty will be very different in these two cases, and this may affect the outcome of a type test.
Hence, including a preconditioning procedure prior to the load cycling duties could make the type test more realistic as it would also include the contributions to the internal pressure from slow deformations of the lead and PE sheaths.
5.5. External Hydrostatic Pressure
The hydrostatic pressure exerted on subsea MIND cables by the surrounding water is believed to be beneficial since it can suppress cavity formation. Laboratory measurements on a cable installed in a pressure vessel confirm this assumption, but only in part [6]. If the ambient temperature is low—which is typically the situation for a cable directly exposed to seawater at large depths—a load turn-off still makes the internal pressure plunge to levels where voids may form. Moreover, in the innermost parts of the insulation it may remain low for several days.
The MIND cable of any HVDC link is also subjected to atmospheric pressures, at least for some parts of the route. Concerning the risk of creating harmful cavities, this is less favourable, and if the cable has not been loaded for a while, the ambient temperature may be as low as when surrounded by cold water at large depths.
Hence, the type test should — as it currently is — be carried out in an atmospheric ambient as this is the most demanding case when considering the effects of the external pressure.
5.6. Short-term Overloading
Short-term or temporary overloading of a MIND cable in practice means increasing the current beyond its rated (and type-tested) value, while keeping the voltage at rated value. Obviously, this needs to be tackled also by the converters. From an operational (and financial) perspective, allowing for short-term overloading is highly desirable. However, the associated risks are difficult to assess, and the type test has no specific provisions that concern overloading.
The resistive losses in the conductor are proportional to the current squared. For example, a 20% overloading increases the losses in the conductor by 44%. (In fact, a little more because the resistivity in the conductor becomes somewhat higher as the temperature increases.) Obviously, temporary current overloading will increase the temperature in the cable and the temperature difference between the innermost and outermost layers. Detailed modelling is required to determine how much and how fast, but short-term overloading clearly comes with some identifiable risk factors:
First, the conductor temperature may exceed its declared maximum value. Typically, this will occur at a few locations along the cable route where the thermal conditions of the ambient are unfavourable (thermal bottlenecks). The risks are the same as discussed for load cycling in a warm ambient in Section 5.3, i.e., thermal run-away and excessive internal pressures.
Second, the higher temperature drop across the insulation creates a greater difference in thermal expansion/contraction between the innermost and outermost layers of the insulation. This may under certain circumstances lead to a greater pressure gradient and possibly a larger outward flow of mass, resulting in an even poorer impregnation of the innermost layers afterwards than after turning off a rated load current.
Third, because the electric conductivity is temperature dependent, a larger temperature drop across the insulation causes a greater space charge movement and thus a higher maximum field both during loading and immediately after a polarity reversal.
Considering the large interest for allowing short-time overloading, the current type test is clearly deficient. One option could be to include shorter cycling duties (e.g., 0.5, 1 or 2 h) at overload conditions at an intermediate ambient temperature (e.g., 20–30°C) as the pressure gradient and the radial mass redistribution then presumably become highest.
5.7. Resting Time During Polarity Reversals
For the polarity reversals in the type test, it is recommended to apply a 2-min "resting time" after turning off voltage and before applying voltage of the opposite polarity. The background for this "pause" is technical constraints with the voltage sources being used in the test laboratories.
It has been speculated — with basis in some experimental observations on flat samples consisting of just a few layers of mass-impregnated paper — that certain charge injection and local space charge accumulation phenomena may cause instantaneous polarity reversals to result in excessive electrical stresses [10]. With a 2-min resting time, it is hypothesised that the local stresses become lower. However, no evidence or experimental verification proving this assertion correct and of significance for complete MIND cables have been reported.
It can be argued that since the polarity reversal type test duty uses a 2-min resting time rather than applying an instantaneous reversal, the same should be applied in service. (A cable should not be exposed to something it has not been tested for.) Consequently, as a precautionary measure the control systems of most LCC-based HVDC links involving MIND cables are configured to apply a 2-min resting time during polarity reversals, but others do not. But again, whether the dielectric stress in the two cases differs significantly, remains unconfirmed.
Some MIND cables are in service exposed to instantaneous polarity reversals. It is not certain that the stresses these cables experience are reflected in the type test procedures.
6. Conclusions
The procedures and requirements for dielectric type testing of MIND HVDC power cables given in CIGRÉ's Electra no. 189 have been considered with basis in recent measurements and modelling of internal pressure, temperature and electric field distributions in cables subjected to different environmental and loading conditions. Most of the provisions are found to be appropriate and reasonable, but a few possible improvements are proposed:
- Including a preconditioning procedure prior to the load cycling duties could make the type test more realistic as it would also include the contributions to the internal pressure from slow deformations of the lead and PE sheaths.
- Introducing load cycling duties with currents beyond I0 and with shorter loading times (e.g., 0.5, 1 or 2 h) and at an intermediate ambient temperature (e.g., 20–30°C) as a part of the dielectric tests could qualify a MIND cable for temporary overloading.
Acknowledgements
The authors thank J. Rantanen for fruitful comments.
This work was supported in part by the Norwegian Research Council, Nexans Norway, Fingrid, Statnett, and Svenska Kraftnät under contract no. 256405/E20.
References
- CIGRE Working Group 21-02, “Recommendations for tests of power transmission DC cables for a rated voltage up to 800 kV,” Electra, no. 189, pp. 39–55, 2000.
- CIGRE Task Force B1.16, “Addendum to "Recommendations for tests of power transmission DC cables for a rated voltage up to 800 kV,"” Electra, no. 218, pp. 39–45, 2005.
- M. Runde, R. Hegerberg, N. Magnusson, E. Ildstad, and T. Ytrehus, "Cavity formation in mass-impregnated HVDC subsea cables—Mechanisms and critical parameters," IEEE Electr. Insul. Mag., vol. 30, pp. 22–33, 2014.
- M. Runde, E. Jonsson, N. Magnusson, and K.T. Solheim, "Internal pressures and pressure gradients in mass-impregnated HVDC cables during current cycling," IEEE Trans. Dielectr. Electr. Insul., vol. 27, pp. 915-923, 2020.
- M. Runde, S.M. Hellesø, E. Jonsson, and N. Magnusson, "Plastic deformations of the sheaths of mass-impregnated HVDC cables and their effect on the internal pressure," CIGRE Sc. and Eng., vol. 21, pp. 14–21, 2021., 2021.
- M. Runde, E. Bjerrehorn, E. Jonsson, and N. Magnusson, "Internal Pressure Dynamics of Mass-Impregnated HVDC Subsea Cables at Different Sea Depths", CIGRE Sc. and Eng., vol. 23, 2022.
- Ø. Hestad, H. Enoksen, M. Runde, and N. Magnusson, "Modelling of internal pressure dynamics in mass-impregnated HVDC subsea cables," (submitted manuscript).
- E. Occhini and G. Maschio, "Electrical characteristic of oil-impregnated paper as insulation for HVDC cables", IEEE Trans. Power App. Syst., vol. 83, pp. 312–325, 1967.
- P. Gazzana Priaroggia, P. Metra, and G. Miramonti, "Research on the breakdown under type test of non-pressurized paper-insulated HVDC cables," European Trans. Electric Power, vol. 3, no. 5, pp. 321–330, 1993.
- M. Jeroense, Charges and Discharges in HVDC Cables, doctoral thesis, Delft: Delft University Press, 1997.
- C. Lesaint, K.B. Liland, Ø. Hestad, "Chemical ageing of subsea mass impregnated insulation cable paper", Proc. JICABLE'19 – 10th Int. Conf. Power Insulated Cables, 2019.
- G. Evenset, J. Sletbak, and O. Lillevik, “Cavity formation in mass-impregnated high voltage direct current cable insulation,” in Proc. IEEE Conf. on Electrical Insul. and Diel. Phen. (CEIDP), Atlanta, Georgia, 1998, pp. 554–559.
- G. Evenset and G. Balog, “The breakdown mechanism of HVDC mass impregnated cables,”, CIGRÉ, Paris, France, 2000, Paper no. 21-303.