Critical Review on Biological Growth on Composite Insulators in Northern and Central European Environments: Evaluation of Risk for Pollution Flashover and Ageing
Authors
I. GUTMAN, A. DERNFALK - Independent Insulation Group (I2G), Storgatan 5, 77130 Ludvika, Sweden
V. MALINEN - Fingrid, Box 530, 00101, Helsinki, Finland
M. RADOSAVLJEVIC - Svenska kraftnät, Box 1200, 17224, Sundbyberg, Sweden
K. VARLI - Amprion, Robert-Schuman Str. 7, 44263, Dortmund, Germany

Summary
Biological growth has been observed on both line and substation composite insulators all around the world with several observations made quite recently in Northern and Central Europe. The accumulated knowledge on biological growth on composite insulators is still rather limited. This paper summarizes the results of critical literature review, inspections in the field in three countries and innovative testing of insulators with artificially cultivated biological growth. It is concluded that the risk for reduction of pollution flashover performance due to biological growth in light to medium polluted European environments is negligible (reduction of flashover voltage is less than 10%) if standard creepage, as per standard pollution requirement according to IEC 60815, is chosen for composite insulators. Practically recommended cleaning procedure is manual (hand) cleaning using mild detergent and water. Special lint-free cloth is also recommended. Cleaning is not an urgent procedure and can be performed during the planned outage.
Keywords
composite insulator – biological growth – pollution performance – pollution test – ageing – cleaning procedures1. Introduction and goals
Biological growth has been observed on composite insulators during inspections worldwide with several observations made quite recently in Northern and Central Europe. It seems that there is an increase in frequency of the observations of biological growth, which is probably because more and more composite insulators are being installed in clean areas (as opposed to the historical main application, i.e., polluted areas). The accumulated knowledge on the influence of biological growth on composite insulators is still rather limited.
This paper is intended to summarize very recent experience and assess the influence of growth on risk of pollution flashover and to determine whether cleaning or any other countermeasures are needed. Thus, the main goals of the paper were:
- Provide state-of-the-art practices and practical recommendations on how to treat the issue of biological growth on composite insulators from risk of flashover and ageing point of view
- Determine if periodical cleaning is necessary and, if so, suggest a practical method and give recommendations on when to clean.
2. Critical literature review
2.1. Observations in service
The observations of biological growth in service were made over a period of more than 30 years, i.e., soon after the first composite insulators were installed in service, an example is the PhD thesis of Andreas Dernfalk which was published 15 years ago containing many references dating from the beginning of the 1990s, thus 30 years earlier [1]. To assess more recent observations in service a special questionnaire was developed by the authors and distributed among utilities, manufacturers, and consultants. The main question was: “Have you observed biological growth in service?”. About 20 responses from many different countries and companies were obtained. Countries that responded are marked in BLUE on the map shown in Figure 1. The utilities seem to be better informed on what is going on in service and thus have seen biological growth more often than manufacturers or consultants. The responses YES/NO were distributed as follows:
- Utilities: 7/2 (80%)
- Manufacturers: 3/3 (50%)
- Consultants: 2/2 (50%)
It is important to stress that there was NO documented experience from the questionnaire that any of the insulators in the world flashed over in service due to the presence of biological growth.
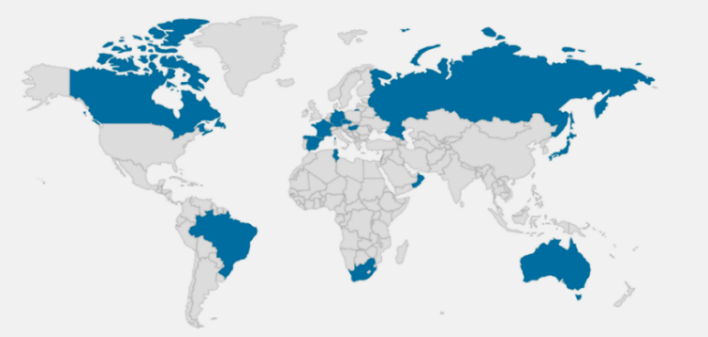
Figure 1 - Map of countries (marked by BLUE) that responded to the questionnaire
Many observations of insulators in service were already presented in [2] and are illustrated in Fig. 2. As it is seen, the biological growth can appear on composite, RTV-coated, glass and porcelain insulators. This is supported by the latest received experience from Brazil [3] shown in Fig. 3. It is considered that the surfaces of composite insulators could be stickier than those of glass or porcelain, and thus beneficial for the development of biological growth. This might also be the reason why biological growth is seen more often on composite than on ceramic insulators.
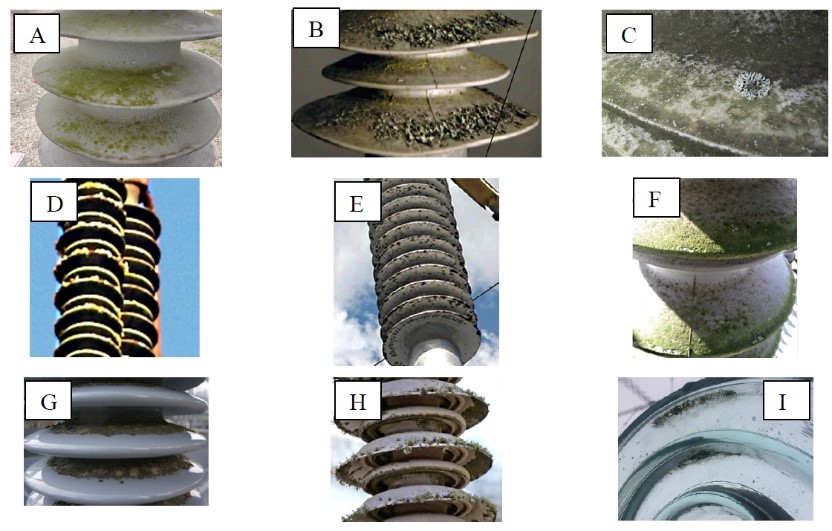
Figure 2 - Examples of biological growths observed recently in different countries and on different insulators: A – Composite (Japan); B - Composite (Norway); C - Composite (Sweden); D - Composite (Ireland); E - Composite (Russia); F - Composite (Sweden); G – Porcelain (Sweden); H - RTV-coated (South Africa); I – Glass (South Africa), all adopted from [2]
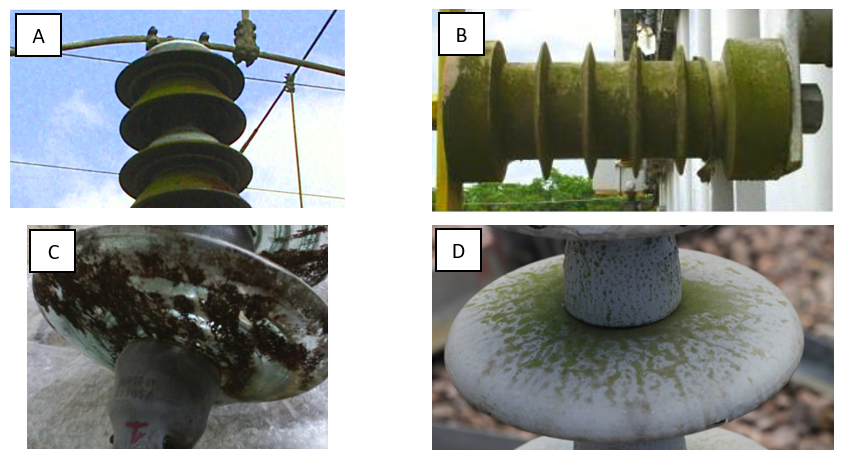
Figure 3 - Brazilian experience with biological growth on porcelain (A), epoxy (B), glass (C) and RTV-coated (D) insulators
It is interesting to point out some specific literature-based cases relating to the important and at present actively discussed issue, i.e. potential ability for biological growth to penetrate the bulk of composite material. One piece of information was received from the Czech TSO CEPS [4]. After 15 years in service some biological growth was observed on silicone rubber insulators, but all investigations showed that this was just a surface phenomenon, see Fig. 4.
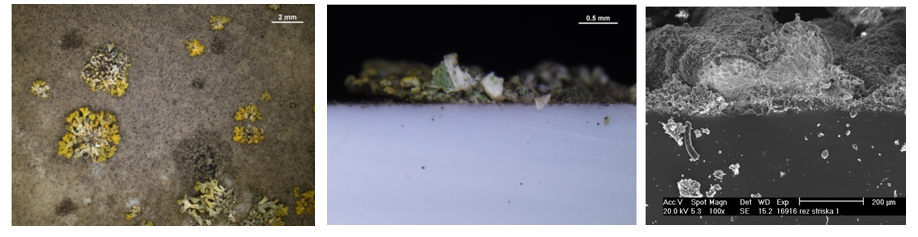
Figure 4 - Left: biological growth found in service; middle/right: crosscut of housing with biological growth with different magnification [4]
Another specific case reported concerned the relatively long-term storage of composite insulators in wooden crates, which were exposed to rain and hot summer temperatures [5]. Different types of fungus colonisation were revealed; however, the growth could be easily removed. In one case, a combined colonisation was found, characterized by the mould species Chaetomium and Cladosporium, which were somehow in symbiotic interaction with Methylobacteria. The latter created pink appearance of the colonies on the insulator surface. This pink colour migrated (diffused) into the silicone rubber and remained in the bulk. The surface areas with the pink discoloration, however, were hydrophobic, thus no functional problems were addressed [5].
A short summary of service observations based on recent literature investigations are as follows:
- No documented flashovers in service attributed to the biological growth were reported.
- The biological growth appears at different types of insulators (composite, epoxy, RTV-coated, porcelain and glass) in relatively clean areas with relatively high humidity. It can be assumed that due to stickier surface than for ceramic insulators, composite insulators might be more susceptible for biological growth than ceramic insulators.
- Based on the present knowledge from service, biological growth is a surface phenomenon, which locally reduces the hydrophobicity but does not penetrate the material of housing.
2.2. Risk evaluation of possible pollution flashover or ageing issues
Several, but not too many, laboratory investigations of insulators with biological growth removed from service or artificially grown were performed world-wide [2], [4], [6]-[12] and these are summarized and analyzed below. Different types of pollution tests included mostly variants of clean fog test (when the insulator polluted by biological growth is subjected to artificial wetting and voltage). The results showed that in the worst case (when insulators are contaminated both by “normal” contamination and biological contamination to a rather high level) the flashover voltage can be reduced up to 40% in comparison to new clean insulators, see examples in Fig. 5 [8] and Fig. 6 [9].
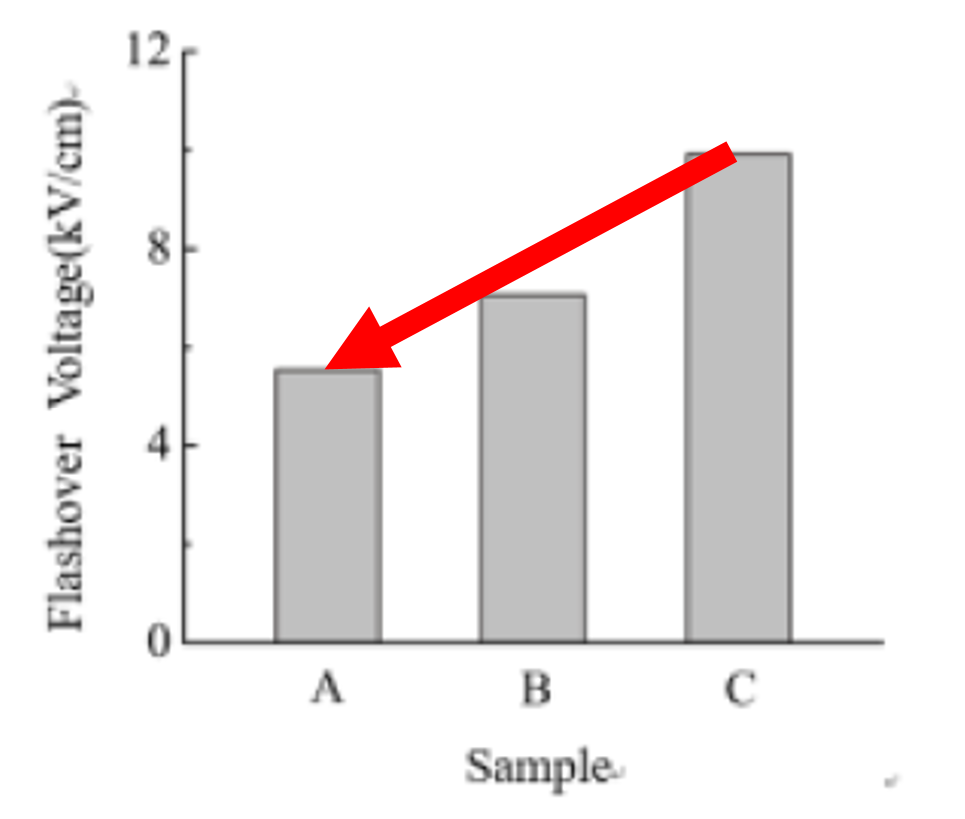
Figure 5 - Comparative flashover test results on the samples of RTV-coatings (plates) contaminated by artificially cultivated algae suspension: A = algae covered plate (Hydrophobicity Class, HC 7); B = algae covered plate after removal of algae (HC 5); C = new reference plate (HC 1) [8]
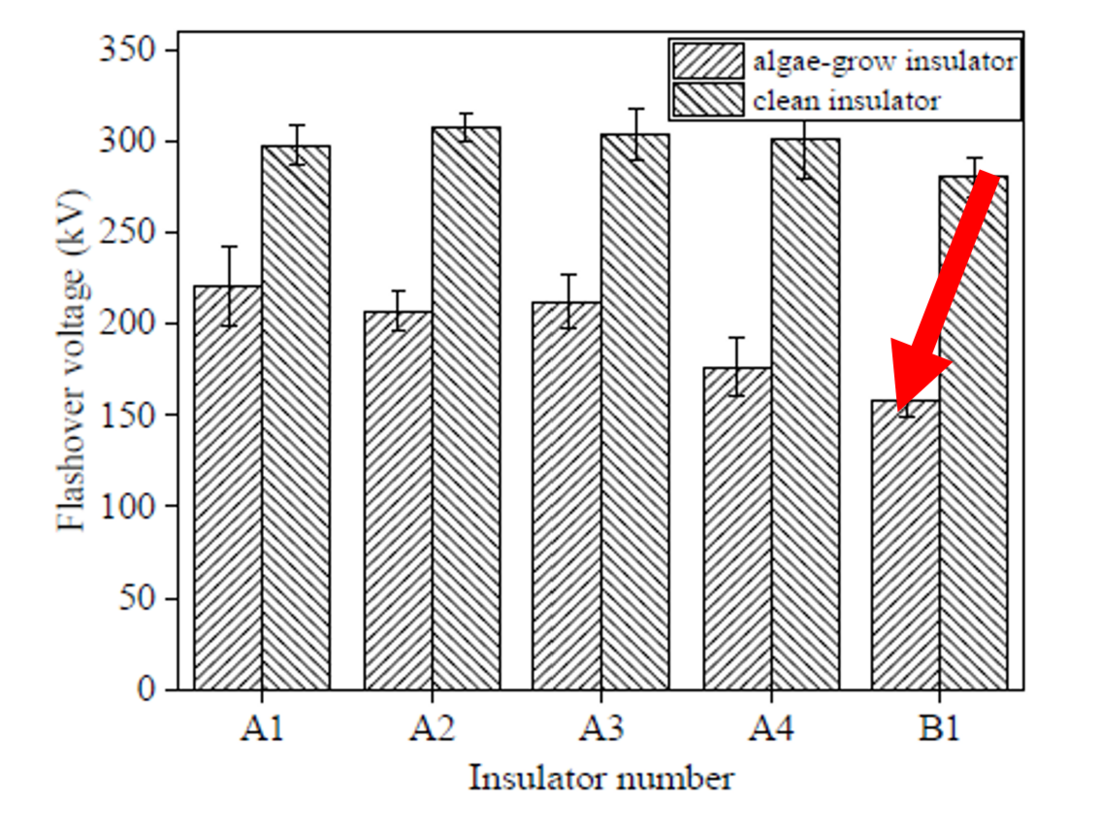
Figure 6 - Comparative flashover test results of five different (A1÷A4 and B1) naturally polluted (“normal” pollution plus biological growth) RTV-coated porcelain station post insulators. The coverage rate of algae was estimated as 30-40% on average, while on the top surface it was higher, i.e. up to 80% [9]
There are very limited data regarding artificial ageing tests on biologically contaminated insulators mostly relating to salt fog tests [6], [11]. A possible explanation is that there are no indications from service that the biological growth destroys the material itself by ageing and thus the researchers do not need to use sophisticated long-term ageing tests to investigate this issue.
Risk for pollution flashover based on literature investigation can be summarized as follows. Let us assume that in the worst case the biological growth completely covers the surface of an insulator. This means that the hydrophobicity will be reduced to the hydrophilic state, characterized by Hydrophobicity Class 7 (according to IEC standard 62073). However, even in this case, the flashover performance of line composite insulators will be higher than for cap and pin insulators, due to superior profile of composite insulators having a small average diameter, see illustration made in Fig. 7. The comparison is made using Insulation Selection Tool program and generic (literature based) curves for pollution performance of different insulator types [13]. Composite station post and apparatus insulators are closer in diameter to porcelain insulators and the effect of profile will be less pronounced for them. However, the assumption that the hydrophobicity will be reduced to the level of ceramic insulators is extremely conservative. In fact, the reduction of hydrophobicity of apparatus insulators due to standard contamination is normally not to the hydrophilic level of HC 7. The results of hydrophobicity measurements on composite apparatus insulators in service at substations located in medium to heavy polluted environments showed that maximum HC is only 4 (intermediate), see Fig. 8 adopted from [14]. The measurements were performed only hours after the de-energization of substations; thus, the hydrophobicity estimation is “as in service” not affected by recovery of hydrophobicity. Numerous observations of composite insulators with biological growths in the field and in the laboratory confirm that the biological growths can reduce the hydrophobicity of the surface, but this does normally not cover the complete insulators. This is because zones more shaded from sunlight (more humid) are preferable for the growth. It is preliminarily concluded that the risk for reduction of pollution performance in light to medium polluted European environments is negligible if standard creepage (as per standard pollution requirement according to IEC 60815) is chosen for composite insulators.
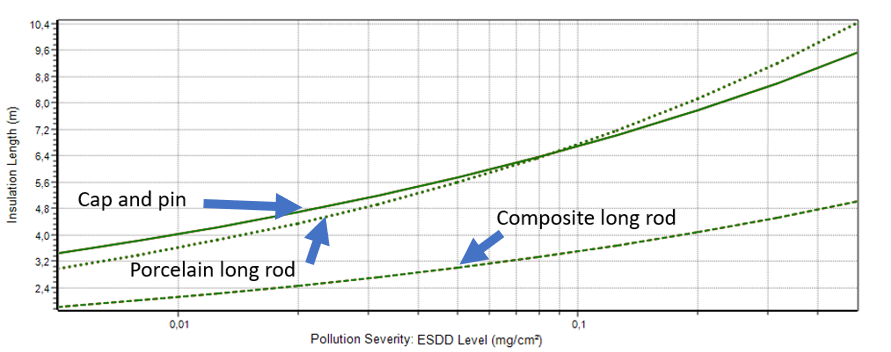
Figure 7 - Comparative flashover test performance in terms of required insulator length of line composite insulator, porcelain longrod insulators and cap and pin insulator string. An insulator with higher pollution performance will have shorter insulation length, i.e., the lowest curve represents the best performance
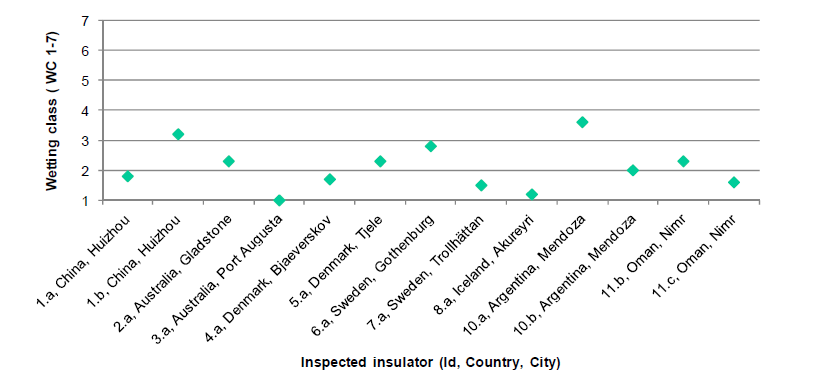
Figure 8 - Results of hydrophobicity measurements on composite apparatus insulators in service at substations located in medium to heavy polluted environments: maximum HC is 4 (intermediate). Figure adopted from [14] (at that time IEC standard 62073 used Wetting Class instead of the present version of the standard, where the same parameter is called Hydrophobicity Class).
Risk for acceleration of ageing processes based on literature investigation can be summarized as follows. So far, the penetration of the biological growth into the material has not been documented in open sources. The present level of deterioration due to biological growth can be characterized as “Change in surface properties”, which is illustrated in Fig. 9 adopted from [15]. Thus, there is no need for quick removal of the biological growth from the insulators in service. Note that the process described by “Colour” in the final stage of degradation penetrating the material (Fig. 9) can be misleading, because it has nothing to do with the discoloration observed in service (Chapter 3). In service, in the worst case, we observed diffusion in the very top surface of the composite material, exactly as can be observed with normal pollution.
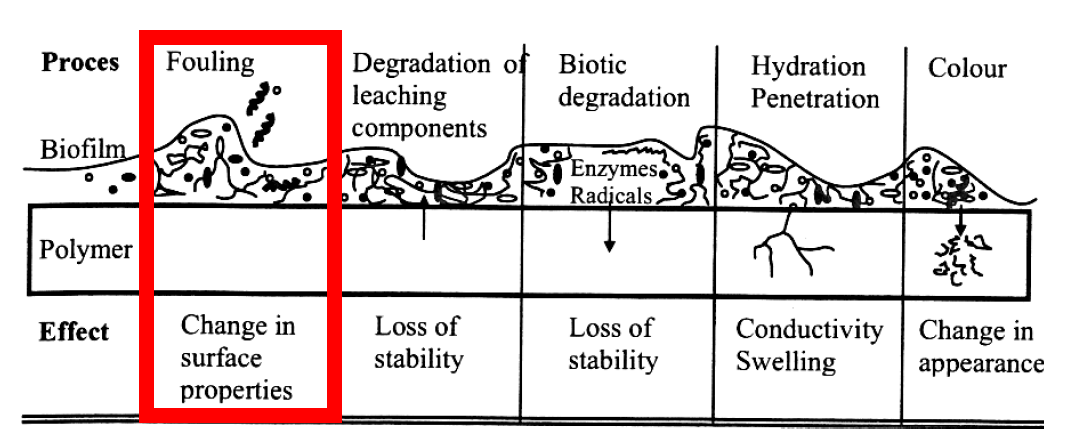
Figure 9 - Different stages of undesired effects caused by a biological growth [15]
2.3. Maintenance philosophies and procedures
Literature data on the maintenance philosophies and procedures is extremely limited.
One example is from German research [5]. Laboratory investigations confirmed that the biological growth is in general a superficial surface phenomenon. It is stated in [5] that based on laboratory investigations only white rot fungus Phanerochaete chrysosporium could sustain degrade PDMS (main component of silicone rubber). The outdoor experience revealed only a few cases when the biological growth was developed to an extent that the composite insulator had to be cleaned. The decision to clean the insulator was mostly taken as preventive measure after an intensive colonization was visually identified and, thus, was aesthetic driven.
Another example is from Japan. The representative from power utility mentioned that even though the part of insulator with biological growth has lower hydrophobicity, the insulator keeps high electrical strength, which means that nothing is required as the countermeasure. They even believe that countermeasures such as cleaning and washing may have a disadvantage, because the composite insulator needs some time, e.g., possibly a couple of days, to recover its hydrophobicity after the cleaning or washing. Insulators may have lower electrical strength during this time [16]. The effect of temporarily reduction of hydrophobicity after washing was confirmed by our own service observations.
Another specific example is from China [17]. In the south of China, lichen and biological growth were found on both line and station insulators (in this case at DC). Resistance of the insulators with biological growth was evaluated and it was considered risky for some composite insulators with high level mold growth to operate further under rainy or misty conditions. The cleaning was recommended, however, the authors themselves made a comment that there were no analysis of the actual pollution performance and the decision to clean was basically subjective [17].
Based on information collected via literature investigation and interviews with utilities and manufacturers it seems that the most applicable procedure to remove the biological growth is still manual cleaning (wiping). However, while cleaning it is theoretically possible to remove some of the low molecular weight silicones located on the surface and temporarily reduce the hydrophobicity (which would eventually recover in a few days). Thus, the question on how to clean the insulators with biological growth in the most effective way is still open and needs further investigation. In general, it can be done in two ways:
1. Live-line or off-line washing with high-pressure. Washing of energized insulators shall be done with remote techniques maintaining a minimum safety distance depending on the voltage level and the type of cleaning method used, i.e., the same requirements as for standard live line washing procedure. This procedure is normally not recommended by the manufacturers and should always be discussed with them in advance. The pressure shall be limited to avoid damage, see example of damage after the high-pressure washing in Fig. 10. In a recently published IEEE Guide for RTV-coated insulators [18], it is stated: “Maintenance cleaning using high-pressure water to remove the adhered contaminant can remove both the contaminant and the coating. Normally, proper adhesion of coating to insulators will allow for water washing at full pressure of 6.90 MPa but it is recommended to consult with the manufacturer of the coating for proper guidance”. Thus, this is an open question, which needs further investigation and standardization.
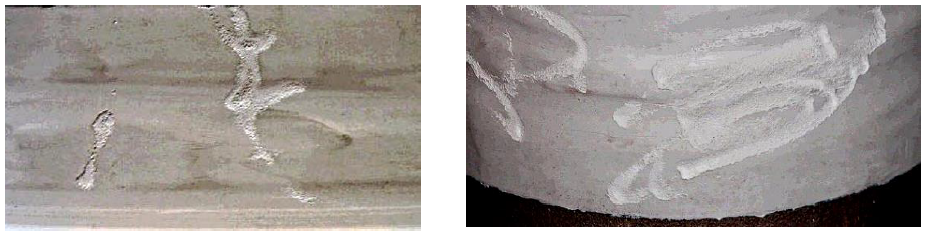
Figure 10 - Example of damages on composite insulators after high-pressure washing in laboratory conditions. Left – accidentally inflicted; right – intentionally inflicted to simulate the actual case
2. Manual cleaning. Cleaning (washing or wiping) can also be performed manually, requiring that the insulator is de-energized. Typical cleaning procedure may include two steps, one where the physical stability of the biofilm is first weakened and then is removed from the surface in a subsequent step [1]. Detergents are useful in the first step while flushing, brushing or similar methods are useful for the second step. The choice of optimal detergent requires further investigation and standardization. A “typical” manufacturer recommendation found on the internet is as follows [19]: “Cleaning is a very seldom procedure, applicable only for some cases of special pollution, which might require the housing to be cleaned. Such reported cases are extreme axial pollution by large birds or mould growth. Mould growth is often attributed to inappropriate storage in a non-ventilated atmosphere leading to condensation on the housing. Acetone, Toluol, Trichlorethylene or Isopropanol are typical solvents for cleaning. The cleaning agent should be applied to a lint-free cloth with which the surface of the insulator should be wiped”. Theoretically, it is also possible to wipe the growth by dry cloth, however, this method would be less effective than using wet cloth or mild detergent.
In general terms, off-line manual cleaning using some mild detergent will be a more safe and accurate procedure than high-pressure washing with non-defined pressure and can be recommended for the time being. Our own practical experience during pollution testing (Chapter 4) showed that some smaller parts of biological growth were complicated to remove. The surface was rubbed with water and a sponge for about 0,5 h for each insulator, and there were still small traces of the growth on the surface. However, small local patterns most probably diffused in the top of the surface, and these should not influence the performance.
2.4. Research related to special additives to materials, which might be used to avoid the biological growth
To assess the most recent update of this specific type of research, a special questionnaire was developed and distributed only among manufacturers of composite insulators. The questions were as follows:
- Do you have any documented evidence about flashover of composite insulators in service due to biological growth?
- Are you doing any research on special material additives to prevent biological growth on composite materials?
Answers were obtained from 13 manufacturers from Canada, China, France, Germany, Hungary, Russia, Spain, Switzerland and the USA. None of them possess documented evidence from service that insulators covered by biological growth flashed over because of this phenomenon. Only 2 of 13 manufacturers are conducting internal research for special materials on limited scale, because the feedback they received from customers from service cannot be treated as requiring actions. Nothing from this research is published in any open domain so far.
Very few literature sources are available for the special additives called biocides. These are intended to eliminate microorganisms (preferably) or inhibit their reproduction. The main goal is to prevent biological growth to develop from the beginning of the installation; killing the microorganisms after colonization and leaving them as dead material on the surface is not preferable. The formulas are commercial secrets. The first group of sources originated from Russia and were summarized in [2]. Recent contact with this research group revealed that they have not produced any fresh data. Their findings in short are as follows. Four samples of different silicone rubbers were placed in Petri cups filled by Czapek broth contaminated by spores of Penicillium cyclopium or Ulocladium. The samples of silicone rubber with 0,5-5% of the special biocides in mass were placed on top of the Czapek broth. Before the start of the test all samples were heated to 160°C for 15 min., which simulated the vulcanization process. This was done to ensure that the biocides would not disappear from the material after the vulcanization. The development of fungi took more than 7 weeks and after this period the peripheral part of the Petri cups was covered by complete layer of fungi, however the samples and the space around them were completely free of fungi, see Fig. 11.
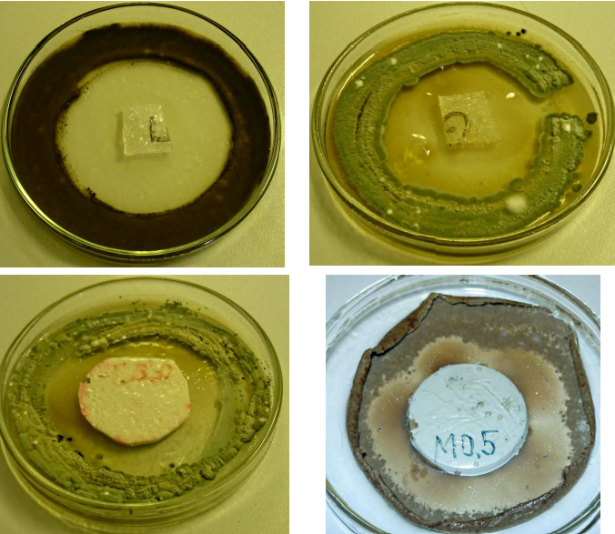
Fig. 11 Samples of silicone rubber with anti-fungi biocides after 7 weeks of testing on the surfaces of Czapek broth contaminated by spores of Penicillium cyclopium or Ulocladium: top-left – without filler (5% of biocide); top-right - without filler (0.5% of biocide); bottom-left – 20% of filler (0.5% of biocide); bottom-right - 60% of filler (0.5% of biocide)
The latest summary on these issues was published in 2017 [20]. It was stated that the research activities intended to develop biocides to prevent the biological growth and have continued without any practical (commercial) result yet. The variety of such biocides is huge. The following additives tested are mentioned in [20]:
- Flame retarding zinc borate
- Sodium benzoate NaB
- Intercide DCOIT
- Benzoic acid
- Eugenol
- Chitosan
- Thymol (example of application of Thymol on biological growth is demonstrated in Fig. 12).
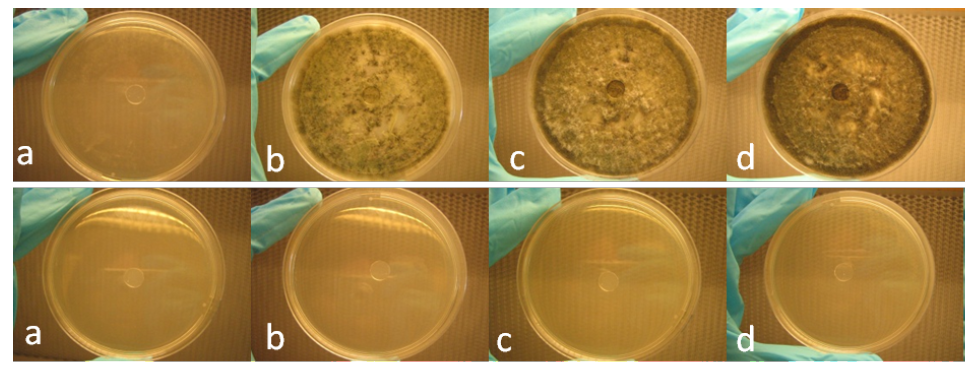
Figure 12 - Results of the disc diffusion test of fungi from Tanzania. Upper row: standard material; bottom row: material with added Thymol. (a) = 1 day of incubation; (b) = 2 days of incubation; (c) = 3 days of incubation; (d) = 7 days of incubation
The development of biocides is a complicated procedure. Their effectiveness should be first verified by simple tests presented, as an example, in Fig. 11 and Fig. 12. However, they should also provide long service life (insulators should ideally work without maintenance for 30-50 years) and unchanged basic material properties. At the same time additives shall comply with environmental restrictions.
3. Inspections in service
The observations from service from three sites (substations) in Finland, Germany, and Sweden (see locations in Fig. 13) are quite in line with the summary obtained from world-wide literature investigations. These observations also show significant similarities for three sites, located in similar inland European environments:
- Finland: inland agricultural area surrounded by forests (inspected insulators included surge arresters, guy insulators, optical links)
- Germany: agricultural and recreational areas with fields, and some small forests in the Northern region of the country (inspected insulators included instrument transformers)
- Sweden: inland agricultural areas (inspected insulators included surge arresters and voltage dividers)
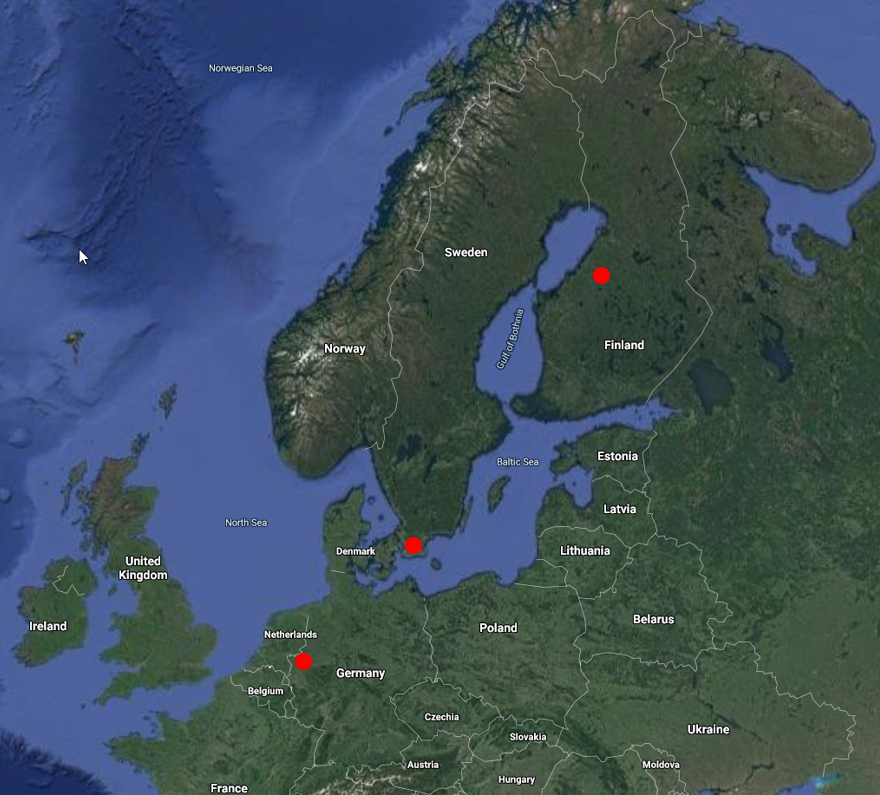
Figure 13 - Locations of inspected substations
The distributions of growth on the inspected insulators were in all cases non-uniform, typically with more growth in shaded areas (see examples in Fig. 14). Surfaces covered by dense growth were also completely hydrophilic in all cases (see examples in Fig. 15). Furthermore, on all but one of the studied insulators, growth could be easily removed by wiping with a wet sponge, indicating that colonization by growth basically is a surface phenomenon (see examples in Fig. 16). The exception was one of the insulators in Germany where local colonies of lichen were found difficult to remove. We believe that in this case some form of coloured substance, originated from the growth diffused in the top surface of the material exactly as is sometimes observed with pollution. Measurements on site showed that the presence of growth may completely mask hydrophobicity in colonized areas. However, since growth was only found to cover a part of the insulator surface, the effect on pollution flashover performance is not critical to get a flashover. This is confirmed by positive service experience of the inspected insulators. Hydrophobicity of the insulator surface is primarily dependent on the material, but also on type and amount of pollution, local temperature, shading, cleaning, etc. This is most probably the reason why even in regions without growth varying wet condition properties were observed.
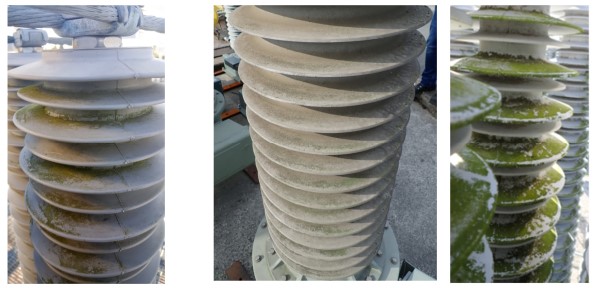
Figure 14 - Visual appearance of the worst part of insulators. From left to right: Finland, Germany, and Sweden
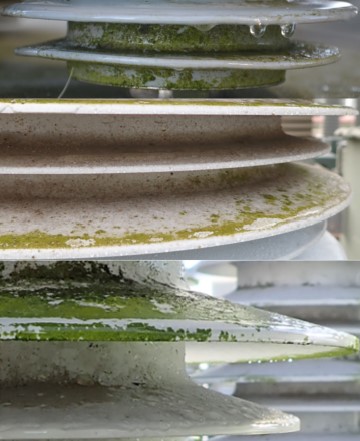
Figure 15 - Hydrophobicity (complete hydrophilic state) of parts of insulators covered by biological growth. From top to bottom: Finland, Germany, and Sweden
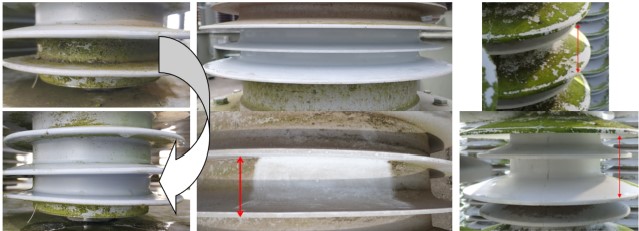
Figure 16 - Example of relatively easy wiping of the biological growth. Left = in Finland (upper: before wiping; bottom: after wiping); middle = in Germany (upper: object 1 after wiping; bottom: object 2 after wiping); right = in Sweden (upper: before wiping; bottom: after wiping)
The results of measurements of maximum pollution are also very similar for all three sites, see Table 1 (these are standard pollution parameters, Non-soluble Deposit Density NSDD and Equivalent Salt Deposit Density ESDD). The maximum means that samples were taken at the places with the visually highest level of biological growth and they are not averaged along and/or around the insulator (thus, they are conservative). The presence of biological growth may result in rather high NSDD-levels despite the clean environments at sites of installation. Areas covered by dense growth also showed higher than expected ESDD-levels, again considering the clean environment (see Fig. 17). This data (or similar data collected by other researchers) may be misleading because the influence of biological growth on pollution flashover performance is limited since only parts of the insulators are affected. More details are presented in Chapter 4.

Table 1 - Maximum pollution levels measured at different sites
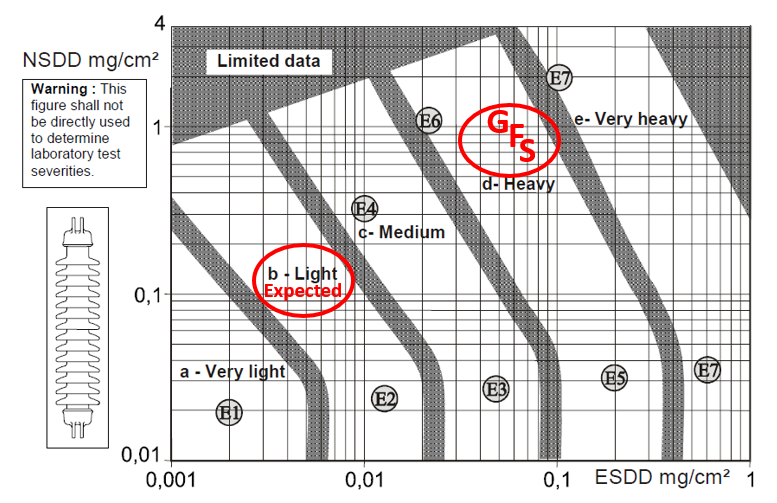
Figure 17 - Pollution Severity Class (from Very light to Very heavy) according to IEC 60815-1 expected at sites of interest and based on field ESDD/NSDD measurements (F = Finland; S = Sweden; G = Germany).
The biological samples brought from Germany were investigated by a biological expert. Only so-called crustose lichens (which are firmly attached to the surface) were detected and they belong to three families:
- Caliciales (genera: Amadinea)
- Candelariaceae (genera: Candelariella)
- Lecanoraceae (genera: Lecanora)
All species mentioned above were fertile with developed fruit bodies. These species are well-known common European lichen. The lichen found is a mini ecosystem, consisting of two main organisms, a fungus, and a photosynthetic partner. The latter can be either a green algae (as for all types of lichen in our case) or a cyanobacterium. Algae is a simple species, producing its own food from carbon dioxide and water by utilizing sunlight, i.e. photosynthesis. They also need some mineral nutrients which are taken from the environment. They can be found almost everywhere: in sea and fresh water, on rocks, in soil, etc. They are spread by wind, water, and animal migration and multiply under certain climatic conditions, i.e. under favorable temperature, humidity, and sun radiation. The lichen algae are formed on the insulators first. Later the spores of lichen arrive, and algae became a photosynthetic partner of lichen, containing chlorophyll. Lichen is also found almost everywhere, and it is the symbiosis that makes the lichen one of the most powerful and successful developments in biology. Morphology, physiology, and biochemistry of lichen are very different from the isolated fungi and algae during classical laboratory cultivation. In general, lichen is useful as bio indicator on e.g., air quality and will not develop in heavy, especially industrial, polluted environments (lichen becomes sterile in such conditions). Most of lichen is spread through fertile fruit bodies containing spores and they are defined as lichen fungus. Many of them are perennial (all seasonal) and can live for many decades. With the help of spores, lichen can be spread over longer distances. Many lichens absorb water from the air, e.g., from fog and drizzle. In the dry state, the lichen contains 15-30% water and is metabolically inactive. The photobiont in the lichen produces carbohydrates through photosynthesis and the fungus converts and absorbs it in the form of sugar alcohol, in case of lichens with green algae. The number of lichen species on earth is estimated to be between 13500 to 30000. Completely dominant are the crustaceans, which usually grow firmly pressed against the substrate (firmly attached to the surface of e.g., insulators). Many lichens are strongly bound to a specific habitat, while others can establish at any substrate. It is possible to reveal the exact type of biological growth primarily using appearance and microscopic investigation. Such investigation can be complemented by Thin-layer Chromatography (TLC) and molecular studies. The references are available through the international biological databases.
Lichen plays an important role in the weathering process of minerals in rock. This is something to investigate for composite insulators in the future. They may produce simple organic acids, such as oxalic acid secreted by lichen fungi, and acids may react with silicone rubber, however at present such cases are not known. Such an effect will be different from the well-known acid rains or acids produced by electrical discharges in humid air.
4. Laboratory test of biologically contaminated insulators
4.1. Preparation of samples
In this project biological growth was artificially cultivated on several line composite insulators in humid laboratory conditions with the purpose to evaluate the impact of growth on pollution flashover voltage. The intention was to create insulators representing a “worst case scenario”, i.e., insulators where the growth would cover the major part of the insulator. A non-standard procedure for cultivation was developed and practically applied. In September 2018, the insulators were first put on the ground in the forest for two weeks to collect spores and other biological material in a natural condition. Then they were put in a chamber with high humidity and were regularly sprayed with specially developed “nutrition slurry” (based on sugar) to feed the growth during a period of 12 months. Insulators under natural pre-contamination process in the forest and in the chamber are shown in Fig. 18. After 12 months the surface of insulators covered by biological growth was investigated. Hydrophobicity class, HC, was evaluated according to IEC TS 62073, Method C. The hydrophobicity of insulators with laboratory cultivated growth was HC 7 at the top and bottom of the sheds (hydrophilic state), and HC 5-6 on the trunk, see examples in Fig. 19.
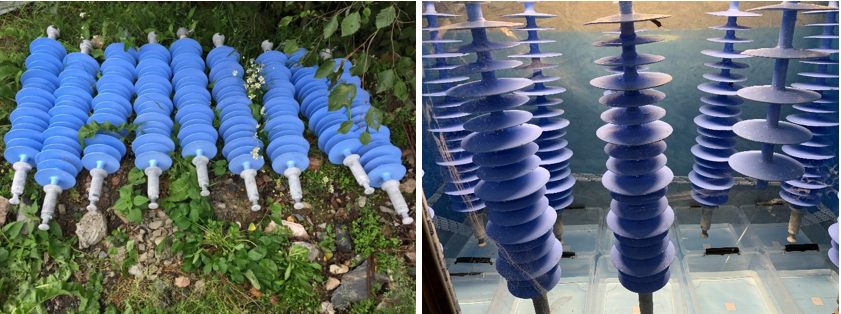
Figure 18 - Left: insulators on the ground in the forest under natural biological contamination; right: view of the chamber with high humidity for further development of biological growth
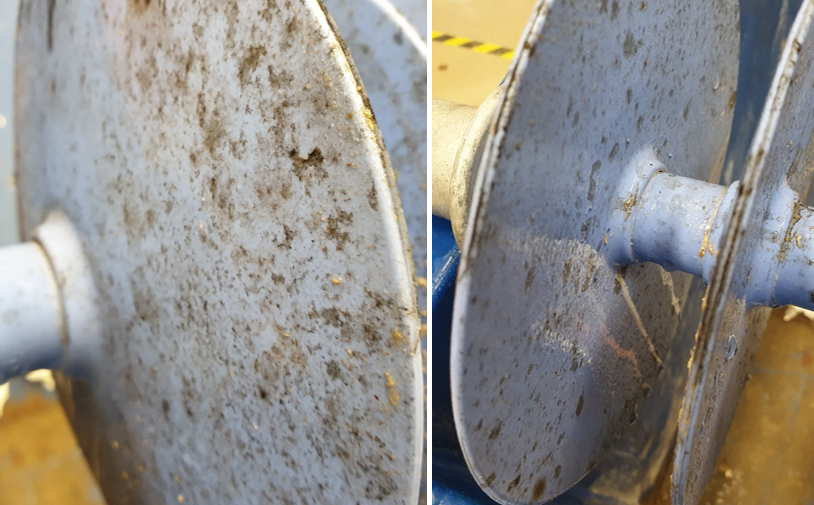
Figure 19 - Example of HC measurements after water was sprayed onto the insulator. Left: top side of the shed; right: bottom side of the shed. These parts with biological growth are completely hydrophilic
4.2. Test procedure
The test procedure was based on the solid layer test procedure described in the IEC 60507. However, this standard covers only glass and ceramic insulators. Testing of composite insulators requires special pre-conditioning as described in CIGRE Technical Brochure (TB) 555 [21]. In order to reduce the number of tests for evaluation of flashover performance the Rapid Flashover test procedure (RFO) according to CIGRE TB 691 [22] was applied. Identical types of insulators were tested with three different surface conditions as follows:
A. Artificially cultivated biological growth (no standard kaolin-based pollution)
B. Standard kaolin-based pollution (no artificially cultivated biological growth)
C. Artificially cultivated biological growth and standard kaolin-based pollution together
The insulators A) with artificially cultivated biological growth were taken from the high humidity chamber, then the surface conditions were evaluated, and the flashover test was performed, everything done during the same day. The insulators B) with kaolin-based pollution were treated as described further below. The insulators C) with artificially cultivated biological growth were taken from the high humidity chamber and then, without washing and pre-conditioning, prepared in the same way as insulators B), i.e. sprayed by the same kaolin-based suspension.
The pollution was carried out using the CIGRE-recommended procedure described in CIGRE TB 555 [21], which comprises the following steps (illustrated in Fig. 20):
- Gentle cleaning of the insulators if no biological growth
- Pre-conditioning of the surface by dry kaolin powder and removal of excessive kaolin by blowing
- Application of the pollution layer in a standard way (e.g., by spraying as in our case).
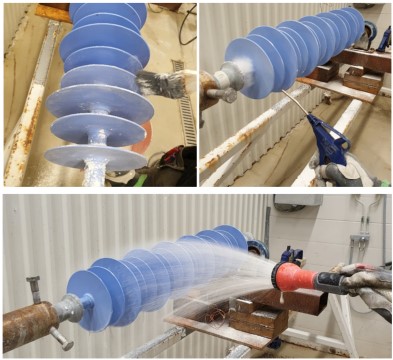
Figure 20 - Top-left: pre-conditioning by brushing using dry kaolin powder; top-right: removal of excessive kaolin powder by blowing; bottom: application of pollution by spraying
Voltage tests were performed by rapid procedure (RFO) in accordance with CIGRE TB 691 [22]. The polluted and dried insulators were energized 15 minutes after starting to wet the insulator, by releasing steam of standard intensity (as per IEC 60507) into the test hall. The test voltage was ramped, at a speed of about 6 kV/s, up to flashover. Then the voltage was re-applied at 95% of the flashover voltage. This 5% voltage step defined the voltage step DU in kV used during the rest of the specific test. After 5 minutes of withstand at a specific level of voltage, the test voltage was increased by DU and after flashover the test voltage was re-applied as soon as possible at a level decreased by DU. The test duration was maximum 100 minutes from the start of the steam fog. The test set-up is shown in Fig. 21. During the tests, the insulators were hung vertically and energized at the bottom fitting of the insulator, similar as in service. The test voltage was supplied from a 250-kV test transformer located in the test hall. To limit the required test voltage only a part of the insulators was tested (axial length 0.62 m).
Three RFO tests per insulator were made for each of the three different surface conditions. Example of results are provided in Fig. 22. Flashover voltage UFO, normally designated as Umin, defined for each RFO test was calculated as the average between the lowest withstand level (contains only withstand events) and the lowest flashover level (may contain both flashover and withstand events). For example, this Umin will be (184+194)/2=189 kV for the results presented in Fig. 22 (top). The following designations are used in Fig. 22: x=Flashover, 0=Withstood voltage level for 5 minutes.
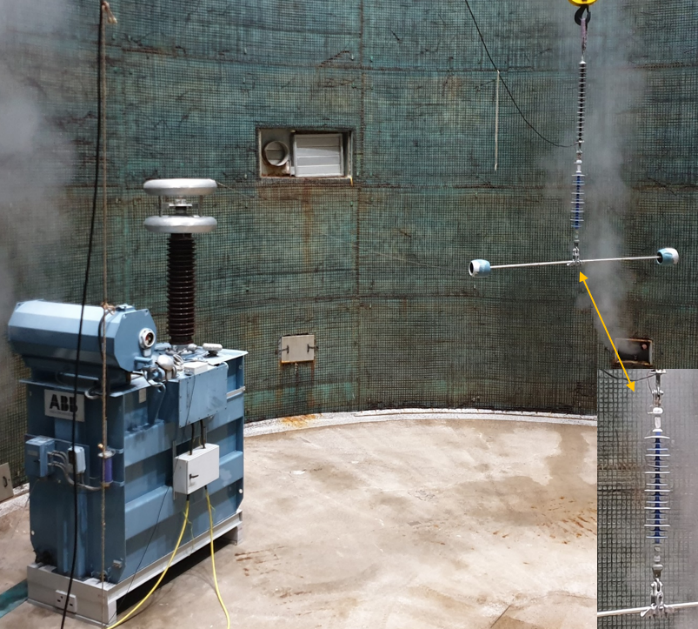
Figure 21 - Test set-up in the climatic hall of ABB STRI in Ludvika (Sweden) and insulator under test
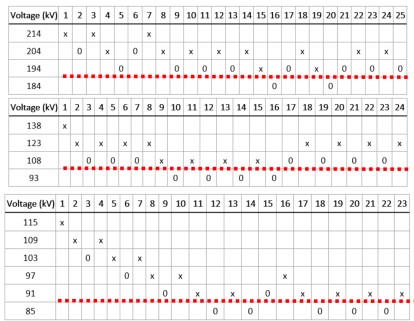
Figure 22 - Example of results from RFO test of one insulator in different surface conditions. Top: A = artificially cultivated biological growth, no standard kaolin-based pollution; middle: B = standard kaolin-based pollution, no artificially cultivated biological growth; bottom: C = Artificially cultivated biological growth and standard kaolin-based pollution together. Red dashed lines illustrate calculated flashover voltage level
4.3. Test results and discussion
Before the voltage tests, the pollution levels were evaluated according to IEC 60815-1 for all three types of surface conditions and the averaged results are presented in Table 2. As shown in Table 2 the artificially cultivated biological growth (condition A) do not contribute much to conductance on the surface of the insulators, but more in non-soluble part of the contamination. For standard kaolin-based suspension (condition B) the results are very close to the target value of ESDD (called SDD for laboratory test) of 0,1 mg/cm2. For combined contamination (condition C) the results are not an arithmetic sum of A+B but are slightly higher. This can be explained by more suspension kept and dried on the rougher structure of surface on these insulators with biological growth, in comparison to the clean insulators only preconditioned by application of dry kaolin. It is important to note that these results are not so far from the results from service (Fig. 23). The flashover voltage results are also presented in Table 2, three RFO tests per insulator were performed with very good repeatability.
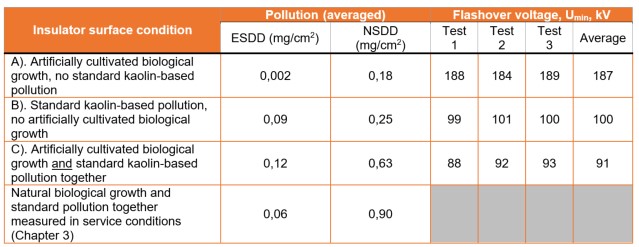
Table 2 - Pollution parameters and flashover test results
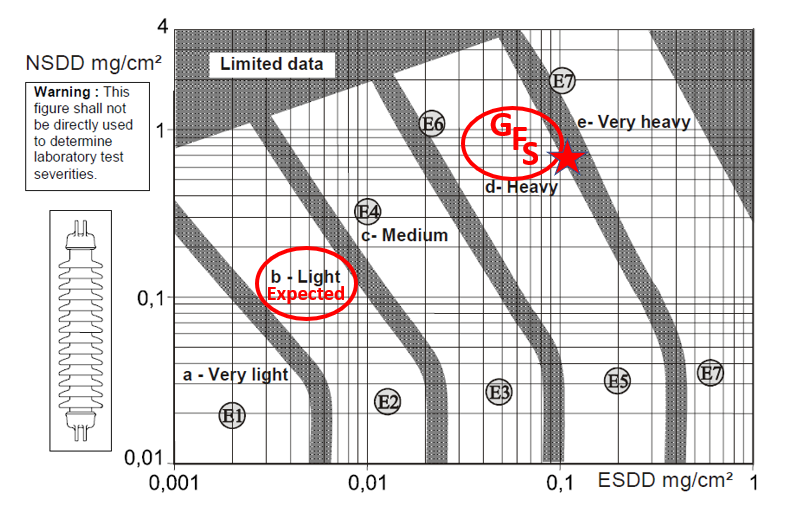
Figure 23 - Pollution Severity Class (from Very light to Very heavy) according to IEC 60815-1 expected at sites of interest and based on field ESDD/NSDD measurements (F = Finland; S = Sweden; G = Germany). Star shows similar results from laboratory investigations
The flashover voltage results show the follows:
- In clean environment the flashover voltage of pure biologically contaminated insulator is approximately 3,8 times higher than maximum operating voltage. This is calculated as follows. The tested insulator represents 145 kV voltage class, thus maximum operating voltage phase-to-ground will be 145/1,73=80 kV. The insulator was partially short-circuited to the insulation axial length of 0,62 m. Thus, the safety factor, using the average flashover voltage from Table 2 in comparison to maximum operating voltage, will be: (187/(80x0,62)) = 3,8.
- In low-medium pollution environment conservatively estimated for Central European conditions without biological growth the flashover voltage is 2 times higher than maximum operating voltage.
- In low-medium pollution environment conservatively estimated for Central European conditions with biological growth the flashover voltage is about 1,8 times higher than maximum operating voltage and only 9% lower than the same voltage without biological growth. Also, this is for complete (uniform) contamination of the insulator by biological growth, while in service the insulator is contaminated only partially.
5. Summary
This paper combines the following three parts of data:
- State-of-the-art literature investigation of the biological growth worldwide combined with two specially prepared questionnaires distributed among power utilities, manufacturers, and consultants.
- Field visits and measurements in service at three substations in Finland, Germany, and Sweden.
- Artificial cultivation of biological growth for 1 year followed by specially designed test program for pollution testing of biologically contaminated insulators.
A short summary of the obtained results are as follows:
- The biological growth appears at different types of insulators (composite, epoxy, RTV-coated, porcelain and glass) in relatively clean areas with relatively high humidity. No documented flashovers in service attributed to the biological growth are reported. The types of biological growth found at the inspected site in Germany are defined by the biological expert as well-known common European lichen which came from three families:
- Caliciales (genera: Amadinea)
- Candelariaceae (genera: Candelariella)
- Lecanoraceae (genera: Lecanora)
All of them were fertile with developed fruit bodies. These species are rather resistant to pollution, and their classical ecological environment is light but not too humid sites.
- It is concluded that the risk for reduction of pollution performance in light to medium polluted European environments is negligible (less than 10%) if standard creepage, as per standard pollution requirement according to IEC 60815, is chosen for composite insulators.
- Based on the present knowledge from service, in European conditions biological growth is a surface phenomenon and does not penetrate the material of housing. The present level of deterioration due to biological growth can be characterized as “Change in surface properties”. Thus, there is no need for the periodical cleaning or even quick removal of the biological growth from the insulators in service. If needed, it can be relatively easily removed, and often this is only a management decision based on appearance point of view.
- The most applicable procedure to remove the biological growth is still cleaning. However, it is possible to wash away some of the low molecular weight silicones located on the surface and temporarily reduce the hydrophobicity (might be for a few days). Thus, the question on how to clean the insulators with biological growth in the most effective way is still open and needs further investigation. In general, it can be done in two ways:
- Live-line or off-line washing. The pressure shall be limited not to damage silicone rubber insulators. No recommendations exist so far and contact with a manufacture is always recommended.
- Off-line manual cleaning procedure may include two steps, one where the physical stability of the biofilm is first weakened and then is removed from the surface in a subsequent step. Detergents are useful in the first step while flushing, brushing or similar methods are useful for the second step. Some recommendations exist as specific manufacturer instructions. Contact with a manufacture before cleaning is always recommended.
- For the present being practically recommended cleaning procedure is as follows. Avoid high-pressure washing and make manual (hand) cleaning using just mild detergent and water. Special lint-free cloth is recommended. Cleaning is not an urgent procedure and can be performed during the planned outage.
- Research activities intended to develop biocides to prevent the biological growth are continued without any practical (commercial) result yet. The variety of such biocides is huge. Very few manufacturers are doing internal research for special materials on limited scale because the signals they received from customers from service cannot be treated as requiring actions. Nothing from their research is published in open domain so far.
Acknowledgements
The authors wish to acknowledge support for this study from three European TSOs (Amprion, Fingrid and Svenska kraftnät), which made possible this project and this publication.
References
- A. Dernfalk, “Image Analysis for Diagnostics of Insulators with Biological Contamination”, Thesis for the degree of licentiate of engineering, Chalmers University of Technology, Gothenburg, Sweden, 2002
- I. Gutman, A. Dernfalk, M. Yarmarkin, “Biological Growths on Composite Insulators”, World Congress & Exhibition on Insulators, Arresters & Bushings, Barcelona-Sitges, Spain, 5-8 November 2017
- D. R. de Mello (Consultant, Brazil), private communications through E-mail dated 21 February 2019
- J. Velek (CEPS, Czech Republic), private communications through E-mail dated 22 February 2019
- F. Schmuck, “Polymer Insulation for Today’s Network Requirements”, World Congress & Exhibition on Insulators, Arresters & Bushings, Barcelona-Sitges, Spain, 5-8 November 2017
- M.N. Dinesh, et.al., “Performance of composite insulators with and without bio contamination”, 2008 International Conference on High Voltage Engineering and Application, Chongqing, China, November 9-13, 2008
- Xiaogang Ouyang, et al., “Influence of Algae Growth on the External Insulation Performance of HVDC Insulators”, IEEE Transactions on Dielectrics and Electrical Insulation Vol. 25, No. 1, February 2018
- Shifang Yang, et al., “Influence of Algae Growth on the Electrical Performance of RTV Coating”, 2017 Electrical Insulation Conference (EIC), Baltimore, MD, USA, 11 - 14 June 2017
- Xiaogang Ouyang, et al., “Influence of Algae Growth on the Electrical Performance of RTV Coated Post Insulators”, IEEE paper 2018
- K. Naito, R. Matsuoka, K. Sakanishi, “Investigation of the insulation performance of the insulator covered by lichen”, IEEE Transactions on Power Delivery, Vol. 5, N. 3, July 1990
- S. Kumagai, “Influence of Algal Fouling on Hydrophobicity and Leakage Current on Silicone Rubber”, IEEE Transactions on Dielectrics and Electrical Insulation, Vol. 14, No. 5, October 2007
- A. F. León, H. E. Rojas, L. F. Cantor, C. D. Pérez, “Performance of Ceramic and Polymeric Distribution Insulators with Mold Growth on its Surface”, IEEE paper 2014
- I. Gutman, P. Sidenvall, J. Lundquist, “Generic pollution performance curves for different types of insulators”, 18th ISH-2013, Seoul, Korea, 25-30 August 2013, PE-03
- I. Gutman, et al., “Long-term service experience and inspection results of HV equipment made of silicone rubber insulators”, CIGRE Symposium, Auckland, New Zealand, September 14-20, 2013, A3-412
- S. Wallström, “Microbiological adhesion to silicone rubber materials for outdoor high voltage insulation”, Thesis for the degree of licentiate of engineering, Royal Institute of Technology, Stockholm, Sweden, 2002
- G. Sakata (Tohoku Electric, Japan), private communications through E-mail dated 22 February 2019
- Xiaoxing Wei, et al., “Hydrophobicity and Insulated Resistance of Composite Insulators with Biological Contamination”, IEEE Transactions on Dielectrics and Electrical Insulation, 2016
- IEEE Std 1523™-2018, “IEEE Guide for the Application, Maintenance, and Evaluation of Room-Temperature Vulcanizing (RTV) Silicone Rubber Coatings for Outdoor Ceramic Insulators”, 2018
- https://www.pfisterer.com/fileadmin/pfisterer/downloads_en/Silcosil-Silicone-Insulators-AI-EN.pdf
- S. Gubanski, “Materials Toward Development of Insulators of the Future”, World Congress & Exhibition on Insulators, Arresters & Bushings, Barcelona-Sitges, Spain, 5-8 November 2017
- CIGRE Technical brochure 555, “Artificial pollution test for polymer insulators”, 2013
- CIGRE Technical brochure 691, “Pollution test of naturally and artificially contaminated insulators”, 2017
Biographies
Igor Gutman was born in 1958. He received his M.Sc. degree and Ph.D. degree (both in High Voltage Engineering) from State Polytechnic University, Leningrad, Russia in 1981 and 1989, respectively. His employment experience 1981-1993 includes HVDC Research Institute, PPEIU university, manufacturer “Composite Insulator” (all three in Russia). Since 1994 he worked for STRI (Sweden), and since October 2017 he works for Independent Insulation Group I2G in Sweden as Marketing Director. His special field is optimal selection, dimensioning and maintenance of outdoor insulation intended to operate in polluted (iced) environments. He is a Distinguished Member of CIGRE and Senior Member of IEEE.
Andreas Dernfalk was born in 1975. He received his M.Sc. degree in Electrical Engineering and his PhD in High Voltage Engineering from Chalmers University of technology in Gothenburg, Sweden, in 1999 and 2004, respectively. Since 2005 he worked as specialist in the field of outdoor insulation and high voltage technology at STRI (Sweden). Since October 2017 he is an expert working as consultant within insulation and insulation coordination at Independent Insulation Group (Sweden).
Vesa Malinen was born in 1989. He has received his M.Sc. degree in Electrical Engineering from Aalto University, Espoo, Finland in 2014. He has worked for Finnish transmission system operator Fingrid Oyj since 2011 and since September 2015 he works as transmission line maintenance specialist.
Milan Radosavljevic was born in 1965. He has received his M.Sc. degree in Electrical Engineering from Belgrade University, Serbia in 1993. After working in different positions in the former Yugoslavia, he has spent the past 15 years within the Swedish power industry. He worked as a consultant both at SwedPower and at Vattenfall Power Consultants before joining Svenska Kraftnät in 2011. His is an expert in both substations and cables, covering all aspects from design and installation to commissioning and refurbishment.
Kübranur Varli was born in 1993. She received her M.Sc. in Electrical Engineering and Information Technology from the Technical University in Dortmund in 2019. She started to work at the German TSO Amprion GmbH in 2015 as a working student in the department of transmission technology. From October 2017 to February 2019, she worked in the same department as a project auditor. Since February 2019 she is the technical product manager for insulators and grading rings at Amprion GmbH. She is also a member of CIGRE and several IEC Working Groups.