Estimation of ‘wet conductor’ audible corona noise from I-type suspension insulator strings at HVAC overhead power lines
AUTHOR
M. DANSACHMÜLLER - RIBE Elektroarmaturen GmbH & Co. KG

Summary
Audible corona noise (ACN) level of a single 420 kV I-type suspension insulator string in an AC power line during conditions of light rain (‘wet conductor’) is estimated based on the assumption that the arcing ring is the predominant source of ACN.
An empirical expression by Nourai [5] for the generated acoustic power by coronating toroids in the ‘wet conductor’ condition is modified and used to estimate ACN generated by arcing rings in I-type suspension insulator string arrangements. The modified expression is based on the assumption that ACN generation is dominated by water drops located at the lower part of the toroid. The influence of various parameters, such as the pipe diameter and the distance between toroid electrode and conductor, on the generated and received ACN level have been investigated.
The results indicate, that ACN levels near 420 kV power lines attributed to typical arcing rings at I-type suspension strings are expected to remain well below the German guideline audible noise level of 35 dB(A) in residential areas at night.
Twin arcing rings, due to the smaller pipe diameters of their individual rings are predicted to produce lower ACN levels during light rain or heavy fog conditions compared to single rings featuring similar maximum surface electric field strength values.
| ACN | Audible Corona Noise |
| AN | Audible Noise |
| FS | Electric Field Strengh |
| HVAC | High Voltage Alternative Current |
| SEFS | Surface Electric Field Strengh |
| SPL | Sound Pressure Level |
1. Introduction
Audible corona noise (ACN) from HVAC power lines, especially at light rain conditions or fog, can become a nuisance for residents living in proximity of the lines.
For the said light rain / wet conductor conditions the dominant source of the noise are corona discharges starting from water droplets hanging at the lower parts of mostly hydrophilic conductors and equipment.
Usually, ACN immission from overhead power lines can mostly be attributed to the cumulative noise emitted along the conductors. This is probably due to the much greater surface area of the conductors compared to that of power line hardware, such as suspension clamps and arcing rings.
For that reason, research has mainly been focused on measuring ACN from conductor arrangements and determining corresponding approximative expressions for ACN generation from conductors [1-4].
There is little research on the contribution of conductor fittings and insulator string components to ACN immission nearby power lines. Since localized components feature a much smaller surface area compared to the conductors, their impact will only be significant if they feature a surface electric field stress (SEFS) comparable to or higher than the SEFS at the conductors.
Conductor fittings by nature do not project significantly out of the field of influence of the conductor or conductor bundle. They are often well rounded or even cylindrical, with the main body having a larger radius of curvature than the conductor. Therefore, the SEFS on those fittings may exceed that of the conductor only over a small fraction of the total surface area, e.g. at their extremities (entrance and exit of the conductor).
The highest SEFS over a significant surface area at insulator strings can be expected at the arcing rings. They are usually located at a certain distance (usually < 1 m) from the conductor bundle, such that the shielding effect of the bundle is significantly reduced and the SEFS at the arcing ring can exceed the maximum SEFS at the conductors.
Arcing rings are often shaped like toroids. In his PhD thesis of 1978, Nourai performed measurements on the ACN generated by energised toroidal electrodes in the ‘wet conductor’ condition [5]. He found an empirical expression for the generated acoustic power as a function of the maximum SEFS at the toroid and its cross-sectional and outer diameters.
This paper uses the results of Nourai to estimate the acoustic power generated by typical coronating arcing rings of I-type single suspension insulator strings in the ‘wet conductor’ condition for a system voltage of 420 kV AC. Based on that result, the ACN immission level attributed to a single suspension string is calculated as a function of maximum SEFS at the arcing ring and as a function of distance from the emitting source. The result is compared with the nighttime limit audible noise level for residential areas in Germany.
The World Health Organization recommends a maximum community guideline value of 45 dB(A) for nighttime AN level outside of living spaces [9]. Electrical line design criteria with respect to ACN during wet or foul weather conditions vary between countries. According to table 7.12 of CIGRE Technical Brochure 792 “Compact AC overhead lines”, several countries, such as Norway, Canada, Korea and the USA, state limit values of 45 - 50 dB(A) [12]. In Germany the ‘TA Lärm’ recommends a guideline AN level of 35 dB(A) in residential areas at night [10].
2. Field calculation software
Field calculations were performed with the software Coulomb version 9.2 by Integrated Engineering Software, using a boundary element solver.
3. Investigated model arrangements
3.1. I-type single suspension insulator string in an overhead line
The case of a typical single suspension string located at the centre phase of a three-phase system as depicted in figure 1 was investigated. The consideration of the centre phase case is expected to be on the safe side, since maximum surface electric field strength (SEFS) values at conductor and hardware are highest for the centre phase. In the reference arrangement, ‘Single ring, reference’ (Fig. 4), the twin bundle conductors are modelled by cylinders of diameter 32.8 mm, with a total length of 55 m and a constant inclination of 7 ° with respect to horizontal. The subconductor spacing and phase spacing are 400 mm and 6 m, respectively. The suspension point is located at a height of 20 m above ground. The crossarm and the tower shaft are represented by grounded rectangular sheets, both with a width of 2 m, and a length of 15 m. The vertical distance between crossarm and toroid is 3.6 m. The distance between insulator axis and tower shaft is 10 m. The capacitive influence from any conductors of parallel three phase systems, as well as from the two neighbouring suspension strings of the same system, was considered sufficiently small to be neglected.
Note, that composite insulator strings usually come with an extra corona ring (also called a grading ring) in order to reduce the SEFS at the insulator to acceptable values. This type of corona ring has a smaller outer diameter and is located somewhat lower (toward the conductor) than the corresponding arcing ring. While the corona ring due to its small size and its location has a negligible effect on the SEFS at the arcing ring, the corona ring is electrically “shielded” by the larger arcing ring. Therefore, the SEFS at the corona ring is much smaller than at the arcing ring and consequently its contribution to wet conductor ACN is negligible.
Table 1 lists variations of the reference arrangement ‘Single ring, reference’ depicted in figures 1 and 4 which were considered with respect to their estimated contribution to ACN immission. In each variation, only one property is changed with respect to the reference arrangement, with the exception of the arrangement ‘twin ring’. In the latter arrangement, the twin ring is comprised of two coaxial rings with a vertical spacing of 6 cm, which additionally have a smaller pipe diameter than the single ring of the reference arrangement:
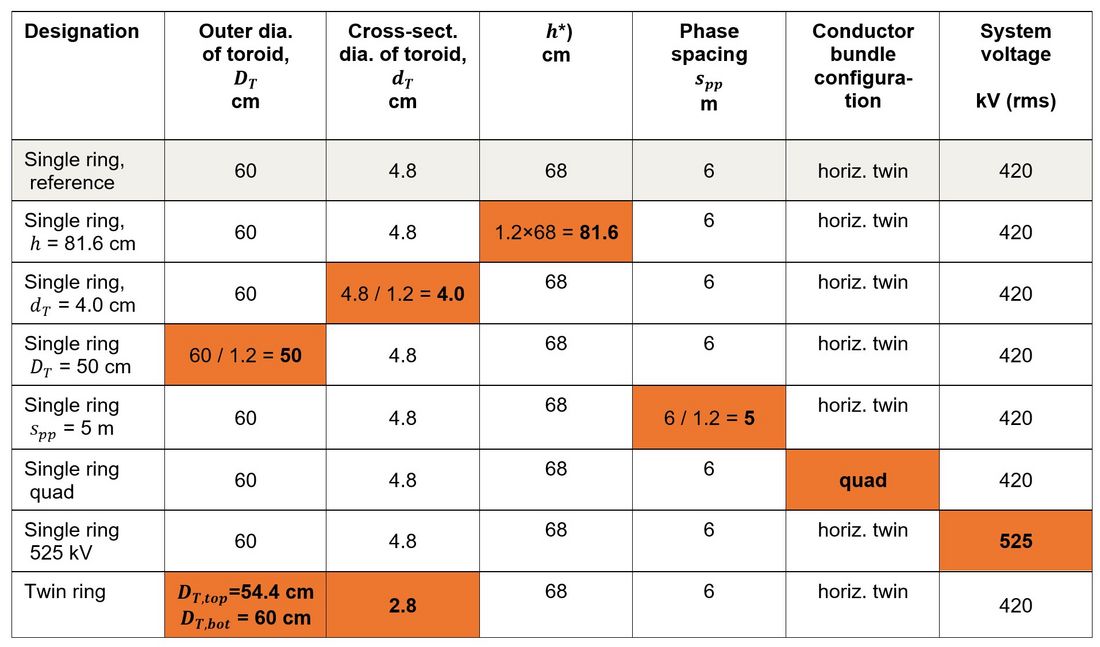
Parameter variations of investigated arrangements. *) Vertical centre to centre distance between arcing ring and nearest conductor. See also figures 4, 5 and 6 illustrating the arrangements ‘Single ring, reference’, ‘Single ring, quad’ and ‘Twin ring’, respectively.
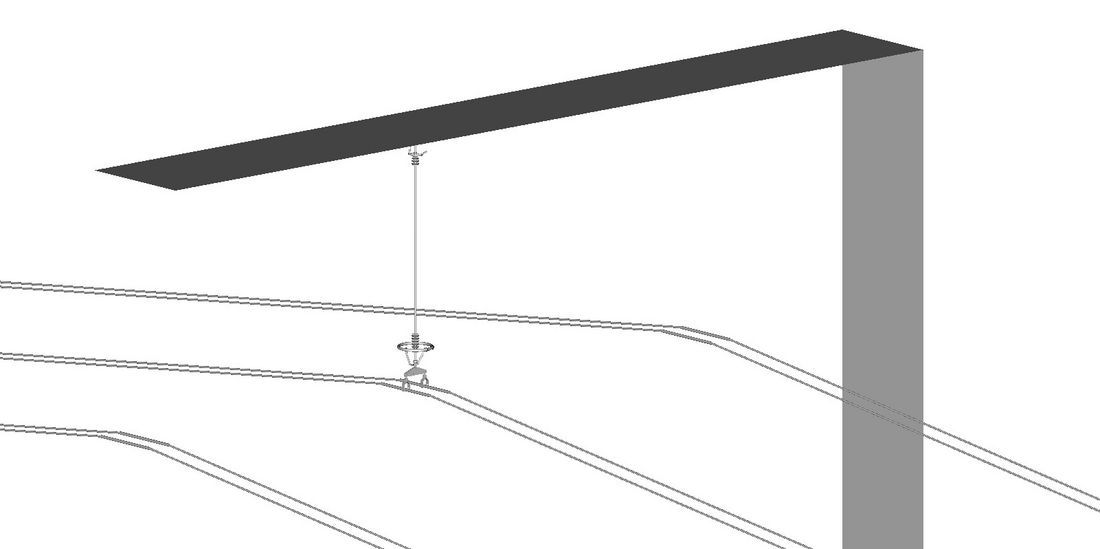
Figure 1 - Simplified model of an insulator string at the centre phase of a three-phase system supporting a horizontal twin conductor bundle
3.2. Test arrangement of Nourai
Figure 2 shows a picture of the test arrangement of Nourai [5] with a toroidal electrode in horizontal position. The toroid is suspended at mid-span by means of a vertical cylindrical metal electrode from a 16 x 3.31 cm x 142 cm bundle conductor with a span length of 340 m [5, 8]. The minimal distance to ground of the bundle axis was about 18.5 m. The centre of the toroid was located 9.75 m above ground or 8.75 m below the axis of the bundle conductor.
The Nourai arrangement was modelled in the field calculation software Coulomb. The bundle conductor from which the toroidal electrodes were suspended was modelled by a cylindrical tube with a parabolic catenary and a diameter equal to the capacitive equivalent diameter of the bundle conductor. The right hand side of figure 2 shows a detail from the model of the Nourai arrangement featuring a toroid with dimensions DT = 60 cm and dT = 4.8 cm. Surface electric field strength distributions were calculated for the following geometrical shapes of toroidal electrodes:
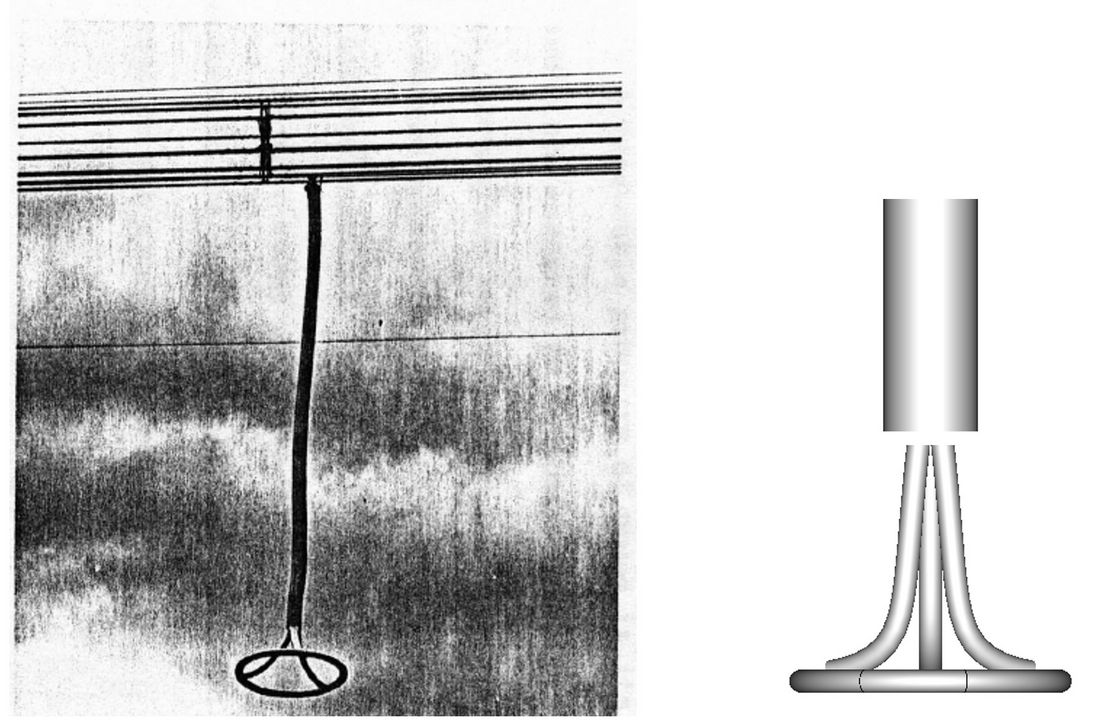
Figure 2 - On the left: Test arrangement to measure the audible corona noise level emitted by energised toroidial elec-trodes under ‘wet conductor’ conditions [5]. On the right: Detail of the model which was created in the field calculation software Coulomb as a representation of Nourais test arrangement. Note, that the dimensions of the specific toroid in the left picture differ from the dimensions of the toroidal electrodes investigated in this paper.
4. Acoustic power generated by a coronating wet toroid
The analysis shall be restricted to the ‘wet conductor’ condition representing acoustic corona noise (ACN) levels observed under conditions of natural light rain or maximum levels of fog [1]. Under this assumption the emitted noise will mainly originate from corona discharges at water drops hanging from the lower part of the toroid. This will hold true if the metal surface of the toroidal electrode is hydrophilic, in which case drops on the top of the electrode will be rather flat, while drops at the tilted or vertical faces will slide down to the lower part where they protrude from the surface due to their own weight. Since arcing rings for HVAC applications typically have to withstand 1 s short circuit currents in excess of 40 kA, they are usually made of galvanized steel and thus are by nature hydrophilic.
Based on comparative investigations involving new and aged conductors [11], it can be surmised that a hydrophobic surface would likely increase ACN generation for a given toroidal electrode under light rain conditions by up to 10 dB(A).
This analysis shall be limited to toroidal electrodes in horizontal position, typical for I-type suspension insulator strings.
4.1. Empirical expression found by Nourai
In 1978 Nourai published the following empirical expression for the acoustic noise level emitted by energised wet toroidal electrodes [5]:
(1)
(2)
with
Total A-weighted generated audible corona noise in decibels above 1 pW.
The effective gradient of simple toroids for evaluation of their ACN level in kilovolts per centimetre (to be interpreted as a root-mean-square value)
Outer diameter of the toroid in centimetres
Cross-sectional pipe diameter of the toroid in centimetres
Toroid maximum surface gradient in the Nourai arrangement in kilovolts per centimetre (to be interpretet as a root-mean-square value)
The ACN measurements of Nourai were done under ‘wet conductor’ conditions. The energised toroid was subjected to artificial rain of unspecified intensity for an unspecified duration. Subsequently, one minute after stopping the artificial rain, the ACN level was measured for a period of about 2 min [5].
The above empirical relations were tested within the following constraints:
cm (3)
cm (4)
kV(rms)/cm (5)
It is interesting to note, that – within the scope of the specific test arrangement of Nourai – the validity of expression (2) is not restricted to horizontal toroidal electrodes (see figure 2), but fits the measured data within the error of measurement for arbitrarily tilted toroids [5]. Nourai gave the following explanation for this surprising result [5]: “In the horizontal position, raindrops leave the electrode from the lowest part with a gradient much less than Emax . This indicates a lower noise level in this case (compared to the situation of a vertical toroid). On the other hand, the effective electrode area where the raindrops leave the toroid has been increased by changing the toroid position from vertical to horizontal. This indicates a higher level of audible noise in the horizontal position. It was observed, from the test data, that these two factors compensate each other very well.”
4.2. Modification of Nourai’s expression for horizontal toroids in arbitrary arrangements
Based on the assumption of a ‘wet conductor’ or ‘light natural rain’ (L50) type of situation [1], it can be surmised that identical horizontal toroids mounted in different arrangements will generate similar ACN levels if the SEFS at the location of the hanging drops (i.e., at the lower parts of the electrode), , is equal for both toroids. With this assumption,
in equation (2) can be replaced by
:.
(6)
where denotes the ratio bteween
and
for toroid (DT,dT) in the Nourai arrangement.
If toroid (DT,dT) is placed in a different arrangement, i , such as the suspension string arrangement ‘Single ring, reference’, expressions 1 and 6 can be used to calculate the generated ACN as a function of the SEFS at the lowest part of the electrode, .
However, it may be desirable to express the generated noise as a function of the maximum SEFS, , at the toroidal electrode for a given arrangement i. With the definitions
(7)
and
(8)
Ga can be written as
(9)
4.3. Attenuation of sound during propagation outdoors
In order to predict the equivalent sound pressure level (SPL) at a given distance from a point source, effects due to the propagation of sound have to be taken into account.
According to [6], the equivalent time averaged SPL within the octave band with centre frequency f is defined by
(10)
with
pf (t) Instantaneous value of the octave band sound pressure in pascals at centre band frequency f
p0 Reference sound pressure level (=2 x 10⁻⁵ Pa)
T An appropriately defined duration in seconds for time averaging
According to [6], Lp,f can be calculated for a point source emitting an acoustic power level Lw,f in the following way:
(11)
or after adding the A-weighting:
(12)
with
Lw,f Acoustic power level generated by the point source within the octave band given by centre frequency f
LW,A,f A-weighted generated acoustic power level
Aprop,f Octave band attenuation during the propagation of the sound from source to receiver.
Af Standardized A-weighting according to IEC 61672:2003 at frequency f
DC,f Correction factor taking account the directivity of the sound source. There is no data available about the directivity of the sound emitted by the coronating toroidal ring. For simplicity, it is assumed that the sound is emitted homogeneously in all directions, i.e. Dcf = 0 . The effect of this assumption on the results is discussed in Appendix 7.1.
According to [6] and assuming Dcf = 0 , the total time averaged A-weighted SPL due to a single point source can obtained by summation over the eight relevant octave bands ranging from centre frequency 63 Hz to 8 kHz:
(13)
with
Af,j Standardized A-weighting according to IEC 61672:2003 at octave band centre frequency number j
Aprop Effective attenuation during sound propagation.
Now, let’s assume a constant or flat frequency spectrum for the toroid (this assumption is discussed in more detail in sections 4.3.2 and 7.2), i.e.,
(14)
In that case, combining (13) and (14) yields
(15)
Aprop,f is comprised of the following contributions:
(16)
Adiv,f Attenuation due to geometrical propagation at frequency f
Aatm,f Attenuation due to absorption in air at frequency f
Agr,f Attenuation due to the effect of the ground at frequency f
Amisc,f Attenuation due to other effects, such as houses or foliage at frequency f
Within the scope of this work attenuation due to geometrical propagation and due to the effect of the ground will be considered. Attenuation due to absorption of sound energy by the air will be neglected, but it’s influence is discussed briefly in section 4.3.2. It will be assumed that there are no barriers or significant foliage between source and receiver. Attenuation (or amplification) due to presence of neighbouring houses will not be discussed within the scope of this paper. The effect of multiple reflections should be taken into account for each specific case individually.
Thus, the effective attenuation Aprop during sound propagation will be calculated as the sum of the effective attenuation due to geometrical propagation, Adiv (refer to section 4.3.1), and the effective attenuation due the effect of the ground, Agr (refer to section 4.3.3):
(17)
Note, that the influence of the weather conditions on the attenuation during outdoor sound propagation, i.e., the meteorological correction, is not considered in this work. Wind speed measured at a height from 3 to 11 m above ground is considered to be in the range of 1 to 5 m/s and directed approximately from the source toward the receiver (angle between the two directions smaller than 45 °) [6].
4.3.1. Divergence term Adiv,f
The attenuation term Adiv,f reflects the fact, that, barring other attenuation mechanisms, the sound intensity due to a point source decreases with the square of the distance d between source and receiver. According to [6] it is given by:
(18)
with
d Distance between source and receiver in metres
do = 1 m Reference distance
The constant 11 dB corresponds to the SPL at 1 m distance from a point source generating an acoustic power of 1 pW.
4.3.2. Atmospheric attenuation term Aatm,f
The expression for the attenuation term Aatm,f is given by [6]:
(19)
where αf denotes the absorption coefficient of air in decibels per kilometre and d denotes the distance between source and receiver in metres.
αf increases roughly with the square of frequency and depends on pressure as well as temperature [7]. For example, at 8 kHz table 2 in ISO 9613-2 lists absorption coefficients ranging from 59 to 202 dB/km. At a distance of 100 m, this amounts to an attenuation between 5.9 dB and 20.2 dB for the 8 kHz band centre frequency.
Taking the atmospheric attenuation into account would lead to smaller calculated A-weighted SPLs compared to the simplified assumption of neglecting its effect. The choice of Aatm,f =0 is therefore an assumption on the safe side. A discussion on the role of atmospheric attenuation in regard to the assumption of a flat SPL frequency spectrum for coronating wet toroids is given in appendix 7.2.
4.3.3. Attenuation term due to the effect of the ground, Agr,f
ISO 9613-2:1996 provides a procedure to calculate the attenuation due to the effect of the ground. Agr,f is comprised of contributions from near the source, near the receiver and from an intermediate region, as indicated in equation (20).
(20)
with
As,f Ground attenuation term for the region near the source
Ar,f Ground attenuation term for the region near the receiver
Am,f Ground attenuation term for the intermediate region
According to [6], Am,f =0 for . For 420 kV lines hs is usually larger than 20 m. Therefore, Am,f can be considered negligible up to horizontal distances dp of at least 600 m (refer to figure 3 for an illustration of hs, hr and dp).
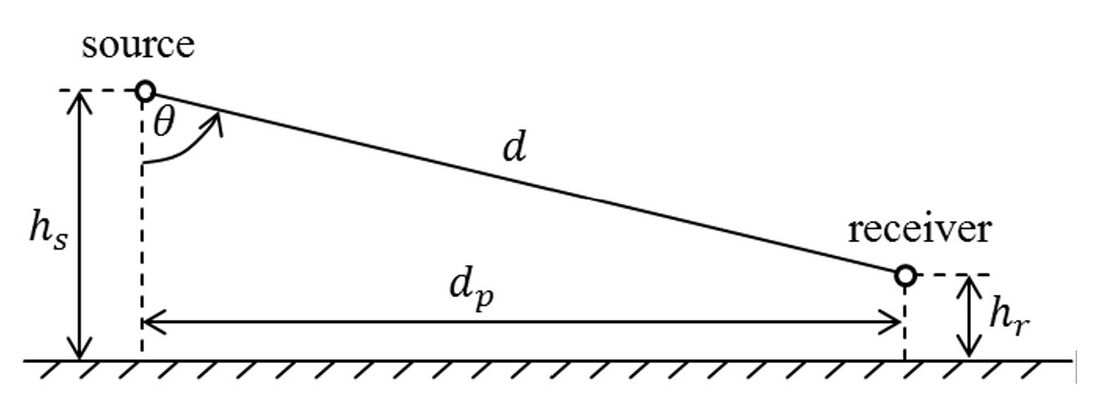
Figure 3
Geometrical description of the parameters d, dp, hs, hr,
Table 3 in [6] gives expressions for As,f and Ar,f as a function of octave band centre frequency f , height hs/r and horizontal distance between point source and receiver, dp . By setting ground factors G at the source and at the receiver it is possible to differentiate between hard ground (G = 0) such as stone or tarmac, and porous ground (G = 1), which is any ground covered by vegetation or topsoil [6].
From table 3 in [6] expressions for Ar and As an be deduced:
(21)
where fi denotes the octave band centre frequency number i . Both fi and ci are listed in the appendix (table 4 in section 7.3).
It turns out that for ,
and
, regardless of the type of ground at the noise source. For this estimation, hard ground (i.e., G = 0) will be assumed near the receiver in order to be on the safe side. This leads to minimum values of Ar,f and thus to maximum levels of Lp,a. It follows, that Ar,f,i = -1.5 for all octave band centre frequencies.
Assuming a simplified flat frequency spectrum according to (14), with LW,A,i = LW,A - 10 lg 8, and taking into account that Adiv,f = Adiv is independent of frequency, the effective ground attenuation term Agr can be calculated similarly to equation (15):
(22)
Therefore, the effect of the ground leads to an estimated amplification of the received SPL by 1.72 dB.
5. Results
In a first step, the distribution of the surface electric field strength (SEFS) around the pipe circumference of the toroidal electrodes was calculated for the various model arrangements listed in table 1. The maximum SEFS, , as well as
and
were determined for each toroid. Similarly, the corresponding quantities for the toroids in the Nourai arrangement,
,
and
, were calculated.
Using these quantities, estimated generated acoustic power and sound pressure levels were calculated for each of the arrangements listed in table 1. The sound pressure levels were plotted as a function of the horizontal distance dp between sound source and receiver.
5.1. Surface electric field strength distribution for exemplary arrangements
Figures 4, 5 and 6 show colour coded contour plots of SEFS at simplified arcing rings as well as conductors for the arrangements ‘Single ring, reference’, ‘Single ring, quad’ and ‘Twin ring’, respectively. The voltage boundary condition at the centre phase conductor was 242.5 kV (rms.) against ground, while the voltage at both neighbouring phases was defined as -121.25 kV (rms) against ground. This potential distribution corresponds to a system voltage of 420 kV (rms).
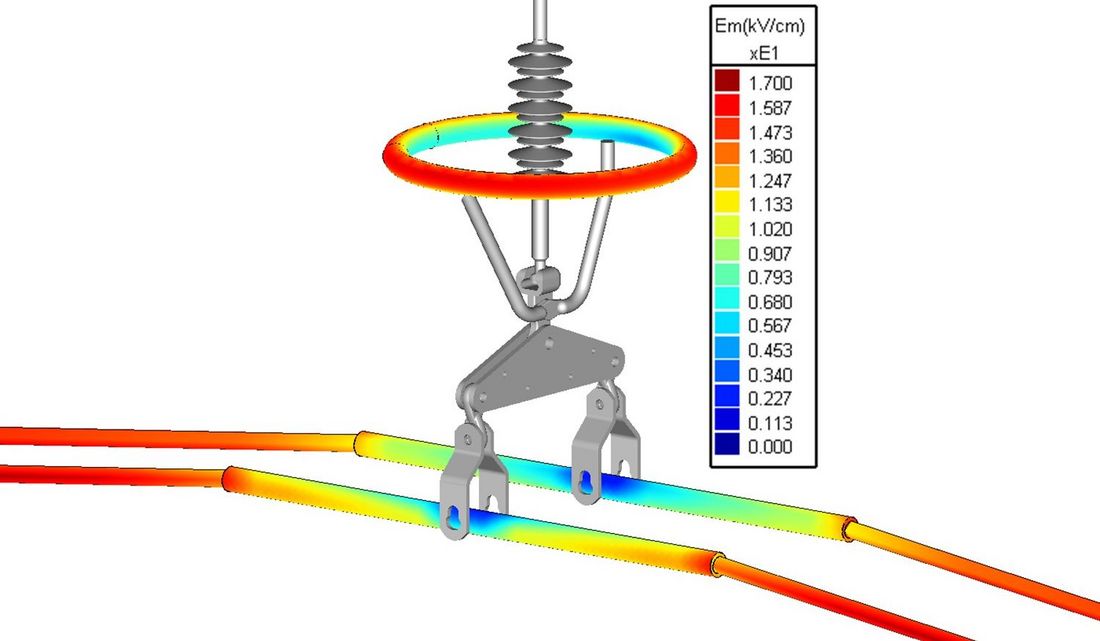
Figure 4 - Contour plot of SEFS in kV/cm (rms), denoted “Em” in the scale, for arrangement ‘single ring, reference’ in table 1
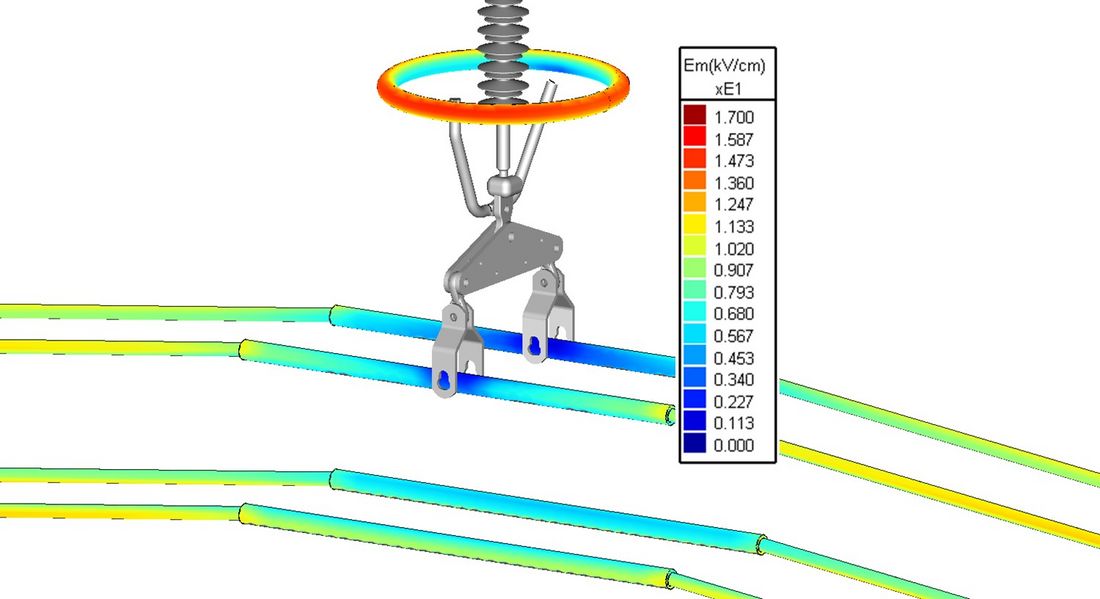
Figure 5 - Contour plot of SEFS in kV/cm (rms), denoted “Em” in the scale, for arrangement ‘single ring, quad’ in table 1.
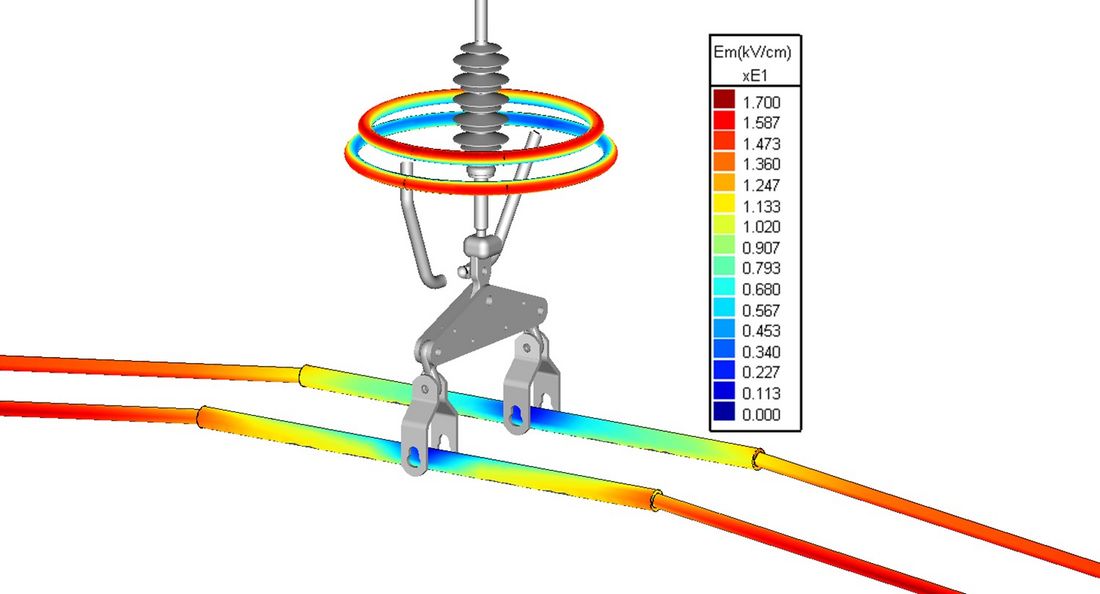
Figure 6 - Contour plot of SEFS in kV/cm (rms), denoted “Em” in the scale, for arrangement ‘twin ring’ in table 1.
Note, that SEFS at the single arcing rings exceeds SEFS at the quad bundle conductor but not that at the twin bundle. The maximum SEFS at the arcing rings was about 16 kV/cm in case of the twin bundle.
The present analysis wants to draw attention to the normalized distribution of SEFS around the smaller circumferences of the toroidal electrodes, respectively. Especially in terms of a comparison between the respective distributions for the I-type suspension string arrangement and the Nourai arrangement.
Figure 7 shows the polar plots of normalized SEFS around the pipe circumference of a toroidal electrode defined by DT = 60 cm, dT= 4.8 cm, for the model arrangements ‘Single ring, reference’, ‘Single ring, quad’ and ‘Nourai-D60d4.8’. While the angular distributions of SEFS are nearly identical for ‘Single ring, reference’ and ‘Single ring, quad’, they differ quite noticeably from the distribution for the Nourai arrangement. A value of was found for i = ‘Single ring, reference’. If a quad bundle instead of a twin bundle is simulated, the v-ratio becomes
, where i = ‘Single ring, quad’.
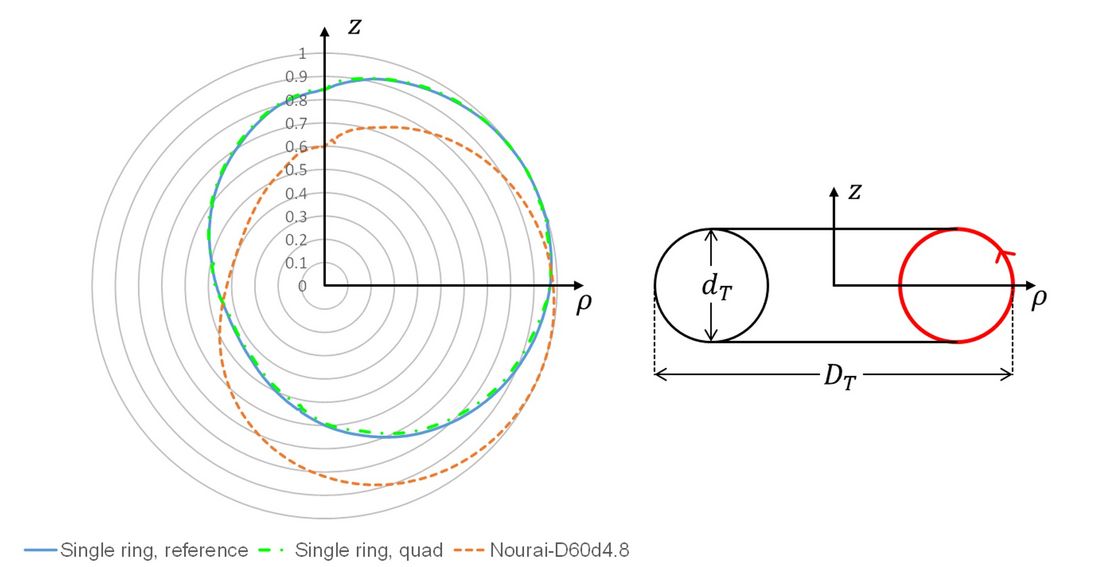
Figure 7 Normalized SEFS distribution around the pipe circumference of the toroidal electrode plotted in polar coordinates for the arrangements ‘Single ring, reference’, ‘Single ring, quad’ and Nourai-D60d4,8, respectively.
The same comparison was performed with regard to the angular distribution of normalized SEFS at the twin arcing ring displayed in figure 6. The polar plots in figure 8 indicate a big difference between the normalized SEFS distributions of the upper and the lower ring electrode. The relative SEFS at the lowest point of the upper ring is very small compared to that at the lower ring. This indicates, that ACN generation by water drops from the upper ring should be negligible compared to ACN generation from the lower ring, provided that maximum SEFS at the upper ring does not significantly exceed maximum SEFS at the lower ring. The corresponding v-ratios for the upper and lower ring are and
, respectively, where i = ‘Twin ring’
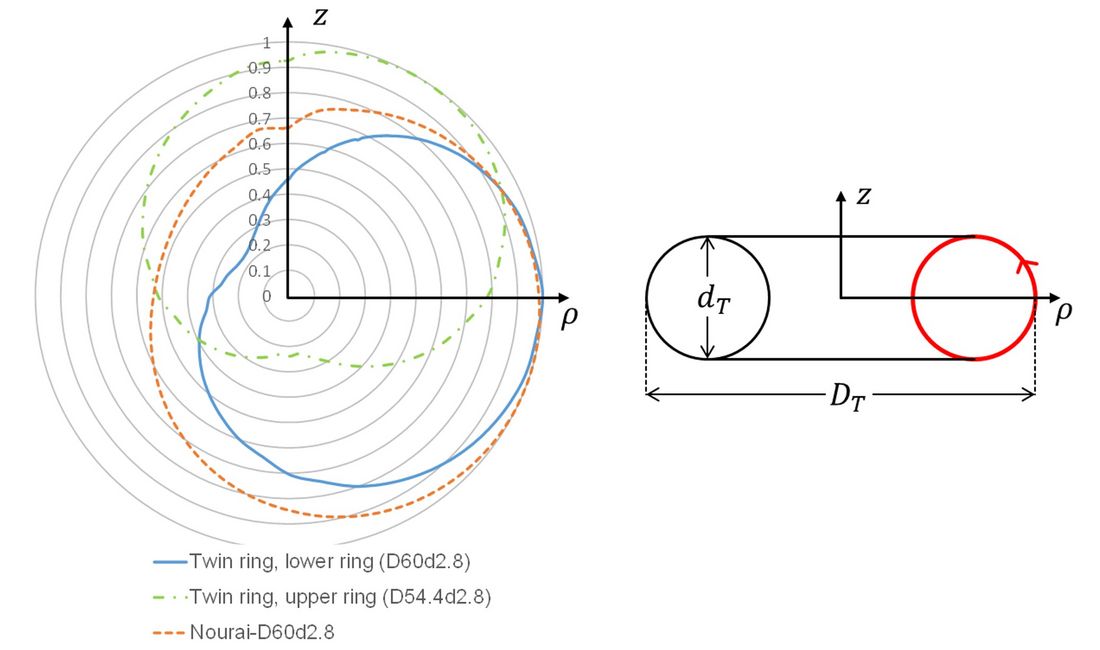
Figure 8 - Normalized SEFS distribution around the pipe circumference of the toroidal electrode plotted in polar coordi-nates for the lower and upper ring of the ‘Twin ring’ arrangement, and for the arrangement Nourai-D60d2.8, respectively.
5.2. Estimated sound pressure levels for various arrangements at defined voltage levels given in table 1
The characteristic parameters and
were determined for each arrangement of table 1 and listed in table 3. Figure 9 plots estimated sound pressure levels attributed to a single coronating wet toroidal arcing ring for the various arrangements listed in table 1 as a function of the horizontal distance dp from the arcing ring. As a reference for comparison, the dash-dotted dark red line indicates the WHO community guideline value for nighttime A-weighted equivalent SPL of 45 dB(A) at about 1 m from facades of living spaces [9]. The dashed red line indicates the German guideline noise level of 35 dB(A) in residential areas at night according to ‘TA Lärm’ [10].
Negative SPLs indicate calculated sound pressure values that are smaller than the reference pressure of , which marks the absolute threshold of hearing at a frequency of 1 kHz.
Notably, the twin ring, due to the smaller pipe diameter dT of its individual rings compared to the single ring, is estimated to produce a considerably smaller ACN level in the wet condition compared to single rings exhibiting similar maximum SEFS values. A short discussion of this finding can be found in the conclusion.
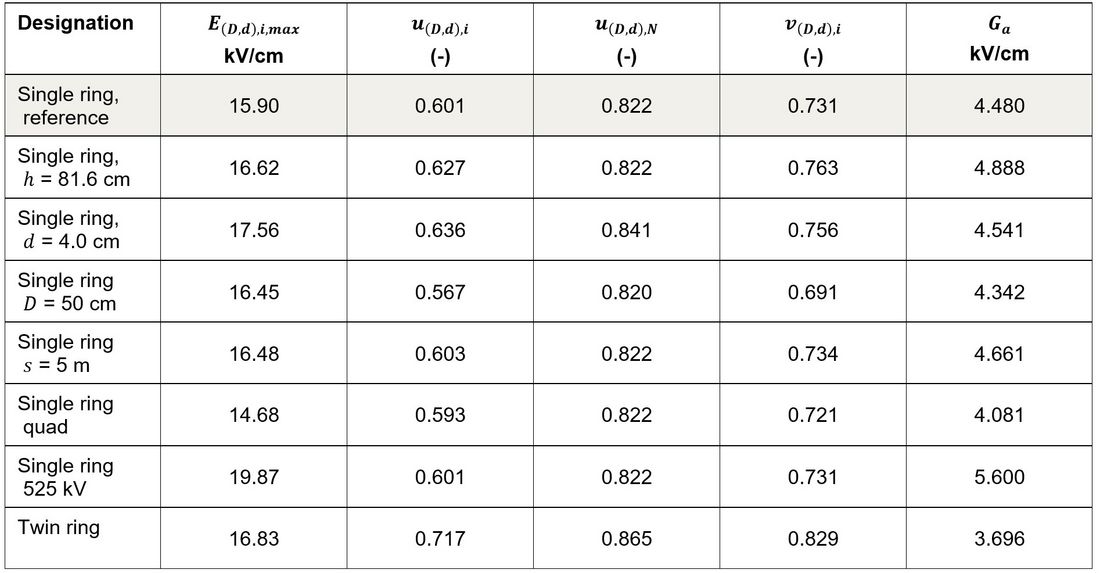
Table 3 - Determined parameters for the investigated arrangements
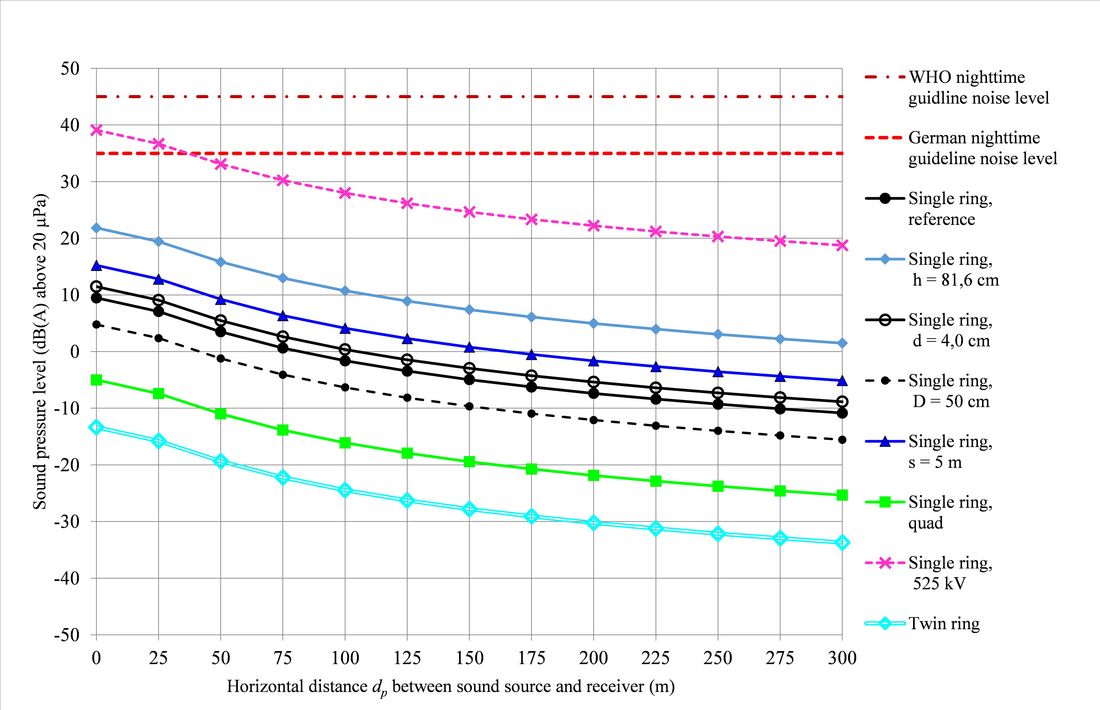
Figure 9- Estimated SPL under conditions of light rain due to a single coronating arcing ring for various parameter var-iations with respect to reference arrangement ‘Single ring, reference’. Dashed red line: German guideline noise level of 35 dB(A) in residential areas at night according to ‘TA Lärm’ [10]
6. Conclusion and outlook
Audible corona noise (ACN) generation and immission during conditions of light rain (‘wet conductor’) due to typical I-type suspension insulator strings at 420 kV AC power lines is expected to be dominated by the contribution of the arcing rings.
An empirical expression by Nourai for the calculation of acoustic power generated by coronating wet toroids was modified and used to estimate the ACN level generated by arcing rings in an I-type suspension insulator string arrangement. The modified expression is based on the assumption that ACN generation is dominated by water drops located at the lower part of the toroid. The influence of various parameters, such as the pipe diameter and the distance between toroid electrode and conductor, on the generated and received ACN level have been investigated.
It was found, that the distribution of surface electric field strength (SEFS) around the circumference of the pipe of the toroid depends on the specific arrangement or capacitive surrounding. The energized toroids in the test arrangement of Nourai were suspended at about 10 m above ground by a vertical cylindrical electrode at the same electric potential as the rings. In contrast, an arcing ring in an I-type insulator string arrangement is suspended by an insulator from a grounded crossarm and is located above a conductor bundle at the same potential. The differences in arrangement and E-field distribution were taken into account by the introduction of the ratio v relating Eb/Emax (SEFS value at the lower part of the toroid divided by the maximum SEFS at the toroid) for the suspension string arrangement to the corresponding quantity for the test arrangement of Nourai. The smaller v, the smaller the normalized SEFS at the lower part of the toroid and the smaller the generated ACN from the toroid for a given value of maximum SEFS at the toroid, Emax.
Using the expression for generated acoustic power, the ACN sound pressure levels were estimated for the investigated arcing ring arrangements. Attenuation during outdoor sound propagation due to geometrical divergence and the effect of ground was considered.
The results indicate, that ACN levels near 420 kV power lines attributed to typical arcing rings at I-type suspension strings are expected to remain well below the German guideline noise level of 35 dB(A) in residential areas at night according to ‘TA Lärm’ [10]. Increasing the voltage to 525 kV without changing the design of the insulator string leads to 25 % higher SEFS and an increase of SPL by about 30 dB(A) in case of the reference arrangement ‘Single ring, reference’.
Since the ACN from different coronating toroids is not correlated, the contribution of N insulator strings can roughly be estimated by adding to the calculated SPL due to a single insulator string. For a typical tower with two 420 kV systems, this contribution amounts to
. Thus, even the ACN level due to the combined contributions of all insulator strings from two 420 kV systems is expected to remain well below 35 dB(A).
Notably, twin arcing rings, due to the smaller cross-sectional diameter dT of their individual rings, are predicted to produce a considerably smaller ACN level in the ‘wet conductor’ condition compared to single rings exhibiting similar maximum SEFS values. The estimation is based on the comparison of the surface electric field strength values at the lower part of the toroids. This implicitly assumes that the normalized field strength (FS) distribution along a field line starting from the lower part of the lower toroidal ring with dimensions (DT, dT ) of the twin ring is the same as that from a single ring with the same dimensions. However, due to the additional capacitive effect of the second (upper) ring, the electric field near the lower ring of the twin ring is slightly more homogeneous (the FS declines less steeply along a field line) than without the additional upper ring. For example, let’s define Eb(s) as the FS at the end of a field streamline of length s which starts from the lower part of a toroid at s = 0 with a FS of Eb(0) = Eb. Then the ratio Eb (2 cm)/Eb for the lower ring with dimensions (DT = 60,dT = 2.8) in the ‘Twin ring’ arrangement is about 4.3 % higher than the corresponding ratio for the single ring with equal dimensions in the arrangement ‘Nourai_D60d2.8’. This means, that the estimated result for the ‘Twin ring’ arrangement might not be on the safe side. While it is difficult to give a reasonable estimation of the magnitude of this effect with respect to the generated ACN of the ‘Twin ring’ arrangement, it seems very unlikely that the effect can increase the ACN of the ‘Twin ring’ by more than 20 dB, which is the approximate difference in the results between the two arrangements ‘Single ring, reference’ and ‘Twin ring’.
It has to be noted, that the validity of the conclusions in this work is contingent on the validity of the assumptions made. The underlying assumption in the presented analysis are:
- The empirical expression of Nourai could be generalized for horizontal toroids in arbitrary arrangements by postulating that generated ACN is dominated by corona discharges at water drops hanging at the lower part of the toroidal rings, and therefore depends on the SEFS at the lowest point of the toroid, Eb, rather than Emax.
- The empirical expression for the generated acoustic power, LW,A, keeps approximately valid for modified effective toroid gradients Ga as low as 4.3 kV/cm.
- The surface of the arcing rings is hydrophilic.
Based on comparative investigations involving new and aged conductors [11], it can be surmised that a hydrophobic surface would likely increase ACN generation for a given toroidal electrode under light rain conditions by up to 10 dB(A).
In order to get a more complete picture of the contribution of insulator strings to the audible corona noise level nearby power lines, more work needs to be done on a similar analysis for V-type suspension and tension strings.
7. Appendix
7.1. Discussion of the effect of sound reflected by the lower part of the toroid
The determination of the generated sound power level in equation (1) was based on the assumption of a non-directional point source [5]. Therefore, the contribution of sound power reflected by the lower part of the toroid to the received SPL is in part already considered by equation (1). One of the microphones of Nourai was installed at a horizontal distance dp = 10.7 m from the toroid at a height of hr = 1.5 m. The corresponding angle of the line between sound source and microphone towards the vertical was about 52 °. By definition then, the correction factor for directivity should be zero for that angle, i.e.,
. Any error in the calculated SPL at the receiver attributed to a non zero
should be small if the deviation of the angle
in Fig. 3 from the corresponding angle
used in Nourai’s setup is small. However, for larger distances between source and receiver,
can become significantly larger then 52°. For that reason, it is interesting to approach the behaviour of
as function of
using a simplified model of a point source near a cylinder with diameter D (think of a coronating water drop hanging from the lower part of a cylindric conductor). The total SPL at the receiver R in figure 10 can be written as a sum of a direct contribution LW,f,direct from the point source and an indirect contribution LW,f,im coming from an imaginary source representing the contribution of sound reflected by the cylinder. Using equation (11), the general relationship between
and the real and imaginary sound source can be expressed by:
(23)
According to clause 7.5 of [6] the sound power level of the imaginary point source can be calculated by
(24)
with
Sound reflection coefficient for the cylinder,
.
Dlr Directivity of the imaginary sound source. For simplicity, it will be assumed, that Dlr =0.
Note, that the term is smaller or equal to zero.
For the selected model arrangement shown in figure 10, table 4 in [6] provides the following expression for :
(25)
with
D Diameter of cylinder
dsc Distance between point source and centre of cylinder.
180°-
(refer to figure 3 in section 4.3.3 for the definition of the angle
)
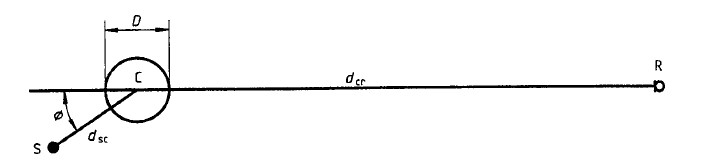
Figure 10
Schematic for the estimation of the sound reflection coefficient for a point source at S at a distance dsc from the centre C of a cylinder, where dsc is assumed to be much smaller than the distance between the cylinder and the receiver at R (taken from Fig. 9 in ISO 9613-2:1996).
Expression (25) only holds if the distance dsc between point source and cylinder is much smaller than the distance dcr between the cylinder and the receiver.
Eliminating by introducing
in equation (25) gives the relationship
(26)
which is a monotonically decreasing function of between 0° and 180°. Therefore, the sound power contribution of the image source, LW,im in equation (24), is also a monotonically decreasing function of
between 0 and 180°.
With increasing , and therefore with increasing horizontal distance dp between noise source and receiver, the sound reflection coeffiecient
and thus the relative size of the contribution of the imaginary sound source in equation (23) decreases.
Although, the geometry of a toroid differs from that of a straight cylinder, the basic conclusion stated in the above paragraph should also apply to the case when the sound is reflected from the lower part of a toroid instead of a cylinder. It is therefore likely, that the effective correction factor DC,f in equation (11) in relation to the generated acoustic power as given in equation (1) increases from zero to positive values for angles <52° and decreases to negative values for angles
>52° . Thus, using DC,f =0 is an assumption on the safe side with respect to the estimation of the received A-weighted SPL if
>52° (i.e., for
).
For horizontal distances the assumption of DC,f =0 should therefore be on the safe side with respect to the estimation of received A-weighted SPL from a coronating wet toroid.
The maximum contribution to of the effective correction factor for directivity,
, is reached at
=0° , i.e. when the receiver is located directly beneath the toroid. A rough estimation of the magnitude of
using the simplified model discussed above yields:
(27)
where dT denotes the pipe diameter of the toroid and x the distance of the sound source, (i.e. the corona discharge from the water drop) from the surface of the toroid. Inserting the lower bound for x of xmin=0 , gives the upper bound for  of 0.23 in equation (27), independent of the pipe diameter, dT .
Thus, even though, the estimation of the received SPL directly beneath the coronating toroid is not on the safe side under the assumption of DC,f =0, the error made due to this assumption is expected to be less than ~0.23 dB and thus negligible.
7.2. Discussion of the assumption of a flat SPL frequency spectrum of the coronating toroid
According to figure 29 in [5], SPL spectra of simple toroids show an increasing octave band SPL for frequencies above roughly 1 kHz up to a maximum SPL at about 8 kHz. Above 8 kHz the SPL decreases with frequency. The spectra also show a peak at 60 Hz with a width of about one octave, which is almost independent of the applied voltage to the toroid. This was considered an artifact and attributed to the electrostatic coupling between the microphone system and the transmission line by Nourai [5]. Between 200 Hz and 1 kHz, the octave band SPL of the spectra can be considered roughly constant. Depending on the applied voltage to the toroid, the difference in octave band SPL between the peak at 8 kHz and the plateau at lower frequencies ranges between about 6 – 15 dB for the sound pressure spectra exemplified in figure 29 of [5].
The total A-weighted SPL was calculated by Nourai by adding the A-weighting to the octave band SPLs and summing up over all weighted octave band SPLs. Due to the strong attenuation of the A-weighting at low frequencies (~27 dB at 60 Hz) the influence of the artificially high octave band SPL at 63 Hz on the total A-weighted SPL is small. The A-weighted acoustic power level generated by the toroids was calculated by Nourai only taking into account the attenuation represented by the divergence term in equation (18). The distance between the microphone and the sound source was about 13 m. Due to the mentioned peak at 8 kHz in the octave band SPL spectra of the toroids, the higher frequency octave bands contribute more to the total generated power in relation to the lower frequency bands. At the same time the atmospheric attenuation is also stronger for higher frequencies. The overall effect is, that the received total A-weighted SPL Lp,A(d) at a distance d from a coronating toroid generating a total noise level of x dB above 1 pW should be smaller than the corresponding Lp,A(d) due to a point source generating the same total noise level with a flat frequency spectrum between octave band frequencies 63 Hz and 8 kHz. Therefore, the assumption of a constant frequency response over the octave bands from 63 Hz to 8 kHz is on the safe side with respect to the estimation of A-weighted sound pressure immission levels of coronating wet toroids.
7.3. Table of empirical expressions ci(hs/r,dp)
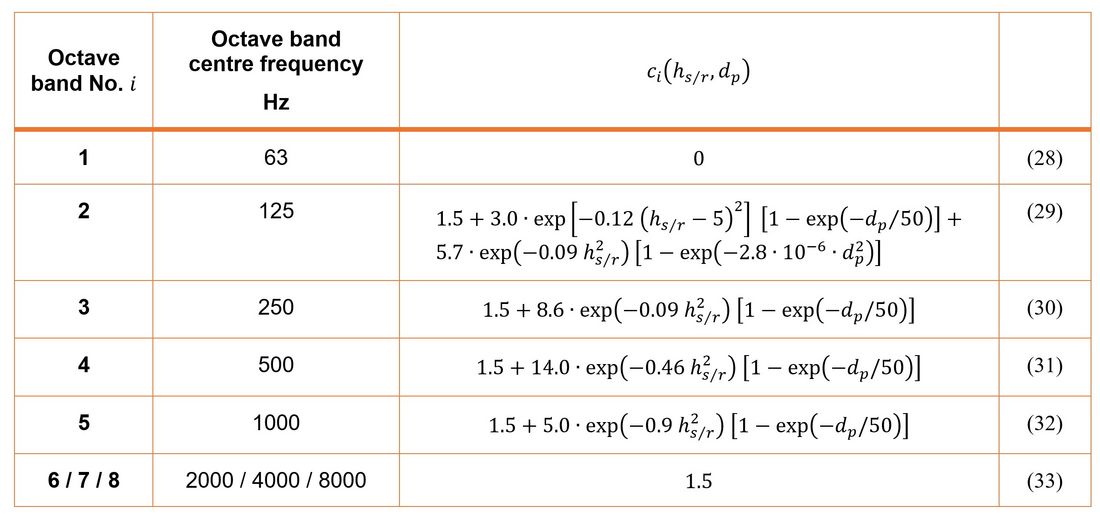
Table 4
Octave band centre frequencies and empirical expressions ci (hs/r,dp) (Note: exp(1)=e )
References
- M. Comber, R. J. Nigbor, L. E. Zaffanella: Transmission line reference book - 345 kV and above, Chapter 6, Electric Power Research Institute, Palo Alto, California, Second Edition, 1982
- V. L. Chartier, R. D. Stearns: Formulas for predicting audible noise from overhead high voltage AC and DC lines. Bonneville Power Administration, IEEE Transaction on Power Apparatus and Systems, Vol. PAS-100 No. 1, pp. 121-130, January 1981.
- CIGRE Working Group 36.01: Technical Brochure 61: Interferences produced by corona effects of electric systems, 1974
- Task Force of the Corona and Field Effects Subcommittee: A Comparison of Methods for Calculating Audible Noise of High Voltage Transmission Lines. IEEE Trans. Power Apparatus and Systems, Vol. PAS-101, no. 10, pp. 4090-4099, 1982.
- A. Nourai: Corona Performance of Toroidal Electrodes for High Voltage Equipment. PhD thesis at the Rensselaer Polytechnic Institute, Troy, New York, 1978.
- ISO 9613-2:1996, Acoustics – Attenuation of sound during propagation outdoors – Part 2: General method of calculation.
- ISO 9613-1:1996, Acoustics – Attenuation of sound during propagation outdoors – Part 1: Calculation of the absorption of sound by the atmosphere.
- M. G. Comber, J. R. Doyle, H. M. Schneider, L. E. Zaffanella: Three-Phase Testing Facilities at EPRI’s Project UHV. IEEE Transaction on Power Apparatus and Systems, Vol. PAS-95, no. 5, September/October 1976.
- World Health Organization: Guidelines for Community Noise, p. xiii, 1999.
- Sechste Allgemeine Verwaltungsvorschrift zum Bundes-Immissionsschutzgesetz (Technische Anleitung zum Schutz gegen Lärm – TA Lärm) vom 26. August 1998 (GMBI Nr. 26/1998 S.503)
- U. Straumann, H.-J. Weber: Potential reduction of audible noise from new and aged overhead transmission line conductors by increasing their hydrophilicity. CIGRE, B2-113, 2010
- CIGRE WG B2.63: Compact AC overhead lines. Technical brochure 792, February 2020