Frequency Domain Measurements for Diagnosis of Power Transformers: Experiences from Australia, Malaysia, Sri Lanka and UK
Authors
S. KUMARA1,8, S. MATHARAGE2, K. BANDARA3, P. WICKRAMASURIYA4, F. YOUSUF5, C. EKANAYAKE6, M. FERNANDO1, Z. WANG2,7, S.M. GUBANSKI8
1 Department of Electrical and Electronic Engineering, University of Peradeniya, Sri Lanka
2 College of Engineering, Mathematics and Physical Sciences, University of Exeter, United Kingdom
3 Ceylon Electricity Board, Sri Lanka
4 Energy Queensland, Australia
5 Faculty of Electrical and Electronic Eng., Universiti Tun Hussein Onn, Malaysia
6 School of Info. Tech. and Electrical Eng., The University of Queensland, Australia
7 Dep. of Electrical and Electronic Eng., The University of Manchester, United Kingdom
8 Dep. of Electrical Eng., Chalmers University of Technology, Sweden

Summary
Power transformers and their performance and reliability in electric power networks are important research issues of power systems. Much information has already been collected and reported; however, it is rare to report comparisons of transformer service performance under different geographical locations and working conditions. CIGRE Working Group A2.37 collected information on 964 transformer failures from 58 utilities and 21 countries covering the period from 1996 to 2009. The main failure modes included failures in windings, tap changers, bushings, insulation, and core. As estimated, based on available literature, nearly 50% of the failures could be related to transformer windings and insulation. This collective paper summarizes experiences from the use of diagnostic tools based on frequency domain measurements at different geographical regions of the world. It starts with a short introduction to response measurements in frequency domain for condition assessment of transformers; then theoretical backgrounds of the two widely used response measurements, namely Frequency Dielectric Spectroscopy (FDS) and Frequency Response Analysis (FRA), are presented. Afterward details of tested transformers and measurement procedures are described for which selected set of FDS and FRA measurement results are analysed for respectively elucidating their potential in assessment of moisture content, ageing degree and fault identification.
Keywords
Transformer – condition assessment – frequency dielectric spectroscopy – frequency response analysis – moisture – winding fault – mechanical fault1. Introduction
Condition of power transformers are monitored through both non-electrical and electrical tests. The non-electrical diagnostics tools are mostly based on oil analyses: dissolved gas in oil (DGA), furan in oil (2-FAL), moisture in oil and colour of oil [1-5]. Electrical tests include winding resistance, excitation current, partial discharge and turn ratio measurements. Most of the electrical tests are performed in the time domain while the two most commonly used frequency domain diagnostic techniques are the frequency response analysis (FRA) [4,7-17] and frequency dielectric spectroscopy (FDS) [5,6,11,18]. In both the cases, a low voltage sinusoidal signal with a variable frequency is applied to transformer windings and changes of complex impedances are monitored.
In FRA technique, the transfer function related to the winding impedance, characterized by inductive and capacitive coupling, is used to identify electrical and mechanical damages by comparing it with a reference measurement. Changes in the winding geometry are typically reflected in the magnitude and the phase frequency response spectra above ~10 kHz [2]. Attempts of interpreting FRA results below this frequency range have also been reported [2, 9]. In FDS, the complex impedance representing the transformer insulation consisting of oil, paper and pressboard is measured at frequencies below 1 kHz, where polarization and conduction processes in the insulation dominate. FDS investigations at high frequencies have also been reported, where the polarization of moisture at GHz frequency range is analysed using a ring resonator [20, 21] as well as visible light analyses are performed in THz frequency range [22]. Anyhow, in all these cases the complex capacitance and loss tangent are measured for the analyses [5, 18].
2. Theory
2.1. Frequency Dielectric Spectroscopy
Frequency Dielectric Spectroscopy (FDS) of a transformer insulation system provides information about polarization and conduction phenomena in both oil and paper insulation. Therefore, adequate understanding of dielectric response behaviour of the individual materials is required to correctly interpret FDS measurements obtained from transformer insulation systems. In general, all types of insulating oils show solely conductive behaviour and thereby, FDS of an insulating liquid can be characterized using its DC conductivity (σoil) and permittivity (ɛoil), as indicated by equation (1). DC conductivity of new mineral oil at 20 ºC is typically in the range 0.05-1 pS/m [23]. Ageing may cause the conductivity of oil to increase as high as to 1000 pS/m [23].
(1)
Several scholars have reported that moisture, temperature and ageing process largely influence the frequency domain dielectric response of oil impregnated cellulose-based insulation by intensifying both conduction and polarisation phenomena [6, 23-28]. Thereby, an increase of temperature and moisture results in a shift of the dielectric response towards a higher frequency. The frequency shift due to a temperature change can be characterised by Arrhenius type of dependence, equation (2), with an activation energy Ea expressed in eV.
(2)
where, ωT and ωref are the frequencies, at which the response has the same magnitude at temperatures T and Tref. K represents Boltzmann constant.
Figure 1 elucidates the general way to interpret the dielectric response of the oil–paper insulation system of a transformer. A common practice is to observe the variation of dissipation factor with frequency as it provides useful information about ageing and moisture content in both paper and oil insulations. As seen in the figure, the response of paper insulation dominates in the high frequency range (10-1000 Hz). In the mid frequency range (0.1-10 Hz) dissipation factor increases with a slope of -1 towards the low frequency and this region can be attributed to the conductive effect of oil. It is followed by a peak originated by the interfacial polarisation phenomenon due to accumulation of space charges at the oil-paper interface. With further decreasing frequency, the response of the composite system again represents dielectric properties of the paper insulation, where it is largely influenced by the moisture and ageing by-products [23, 29].
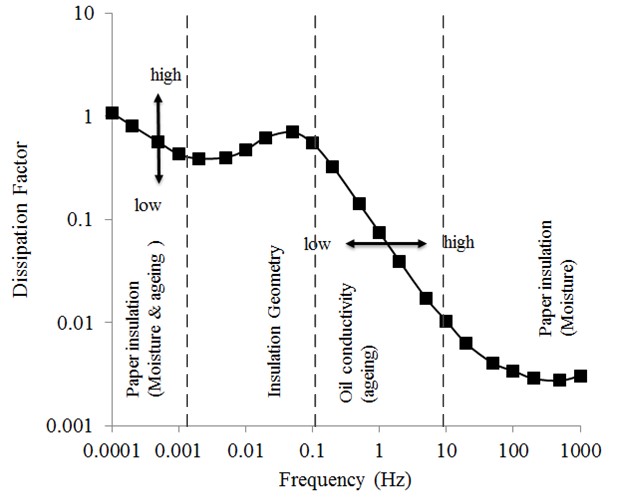
Figure 1 - Typical dielectric response of oil-paper insulated transformer [23]
In [23, 25, 26], a moisture determination technique has been proposed, which is based on a comparison of measured FDS of a transformer over a wide range of frequency to a mathematically modelled dielectric response. This method has proven to be effective in practice and its accuracy is based on precise determination of model data, used for building the mathematical simulation. Such a database contains dielectric response data of oil impregnated paper and pressboard samples measured at different moisture, temperature and ageing conditions. For the simulation, the cylindrical insulation structure between low and high voltage windings of a transformer is represented by the so-called X-Y model, shown Figure 2 [30-31]. X is the ratio of the sum of thickness of all barriers in the duct, lumped together and divided by the duct width. Y is the ratio of the total width of all spacers to the length of periphery of the oil duct. Typically, the value of X is in the range 20-50 % and Y in the range 15-25 %. To estimate the moisture content in the solid insulation, this method combines the dielectric response of the X-Y model to give the best fit with the measured response at a given temperature. Most of the commercialized FDS based moisture diagnostic tools use nowadays this approach.
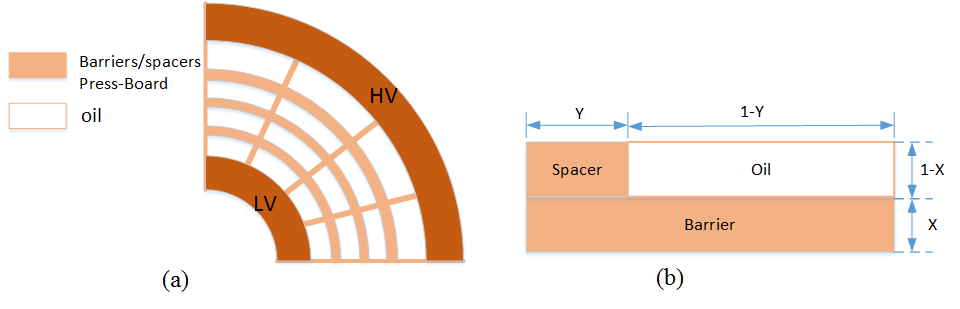
Figure 2 - (a) Representation of typical transformer insulation, (b) Equivalent X-Y model
2.2. Frequency Response Analysis
Frequency response analysis (FRA) is a condition assessment technique mainly used to indicate deformation, displacement or damage of transformer windings. In addition, the technique also allows to detect core defects, contact resistance problems, residual magnetisation and presence of floating shields [4]. FRA measurements are typically conducted after the transportation and/or installation of a transformer or after a system short circuit fault. Condition assessment through FRA is conducted by comparing the measured response against its reference, the latter being normally obtained by the manufacturer before dispatching the transformer to the site.
The FRA trace combines a collective effect of electrical parameters of the winding equivalent circuit, i.e. the capacitances and the inductances that are determined by winding physical dimensions and structure. The alterations in this trace compared to the reference are mainly caused by the changes in the electrical parameters of the windings, and thus winding displacement/deformation can be indicated. Resonances and anti-resonances normally appear on FRA traces as local maxima and minima. Shifting/appearance/disappearance of resonance/anti-resonance of FRA is regarded as the key features to diagnose the winding displacement/deformation.
As shown in Figure 3, FRA spectra can generally be divided into four frequency regions [37]. The response in the lowest frequency region (A) is dominated by the transformer magnetizing inductance and equivalent capacitance seen from tested terminals [32, 35], while in the highest frequency region (D) it is influenced by the measurement set-up. The response in two intermediate frequency regions, B and C, are affected by winding mutual interactions and winding-under-test structure, respectively. The frequency boundaries of these regions may change due to the variations in transformer parameters, such as voltage level, power rating and winding type. Out of the four regions, region C is commonly analysed to determine winding deformations.
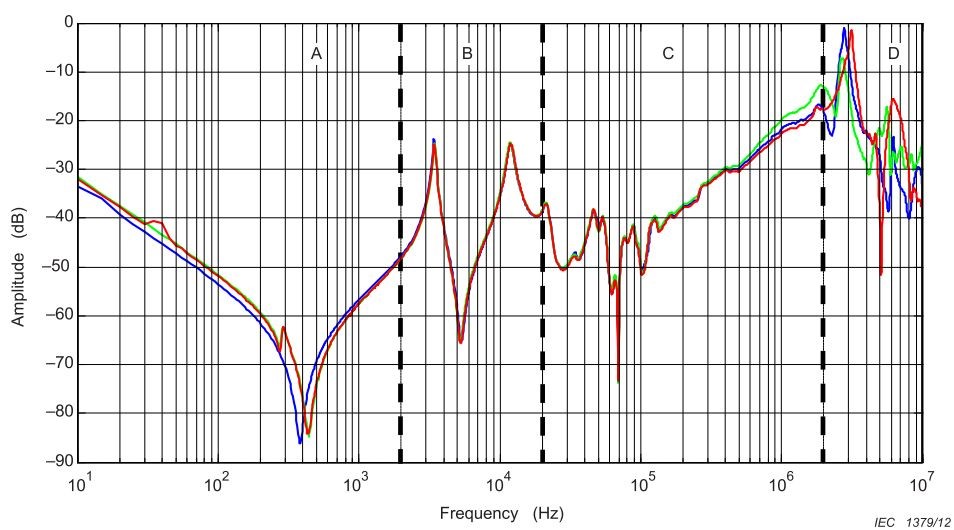
Figure 3 - Four characteristic frequency regions of FRA spectra [37]
The difficulty in interpreting FRA is to correlate the changes in FRA traces to the change in physical parameters of the winding’s equivalent electrical circuit. In order to understand the deviations occurring in the frequency responses and to correlate the changes to the winding components, numerous sensitivity studies are needed. There are two ways to implement sensitivity studies, one is by experimenting on either failed transformers or lab-constructed windings, and the other is by simulating various deformation scenarios on an accurate transformer model. Out of these, the simulation method is preferred nowadays with the development of computational tools as the experiment is costly and from time to time unrepeatable.
Simulation models used in FRA can be divided into three categories: black box model, grey box model and white box model. Black box model has no physical meaning as it represents the FRA spectra by a certain mathematical expression. Grey box model is a model built up based on limited transformer information such as the terminal test results, thus the accuracy of it is limited. White box model converts the winding geometry into electrical components which can be plugged into a circuit network to produce frequency responses. The latter allows the relationship among winding geometry, transformer equivalent electrical components and the corresponding FRA to be uniquely defined. Therefore, white box model is regarded as most suitable for FRA interpretation whenever the winding design data is accessible.
One of the frequently used transformer white box models is the lumped element model [4], which consists of a certain number of units. Each unit contains electrical circuit components including inductors, capacitors, and resistors representing a section of the transformer winding, and these electrical components are transformer winding geometry dependent [7, 8, 35]. Figure 4 shows a generic lumped element model for a single-phase two winding transformer [35]. Each lumped unit in the model represents either double discs in a disc type winding or a turn in a single helical/multi-layer winding. In the equivalent circuit, Cs is winding series capacitance, Cg is winding shunt capacitance to ground and CHL is inter-winding capacitance. Mutual inductance (Mcore+Mair) between the units needs to be considered to ensure the accuracy of the model.
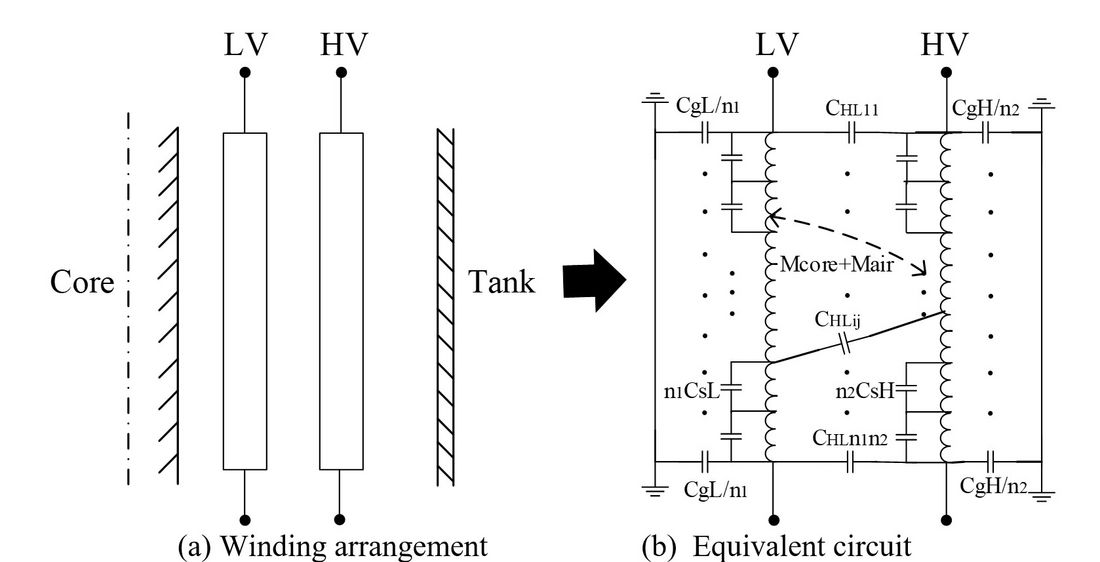
Figure 4 - Lumped element model for a single phase two winding transformer [35]
Apart from the lumped element model, distributed parameter and finite element models (FEM) are also used for simulating various deformation scenarios. The distributed parameter model is developed based on multi-transmission line theory, where each turn of the winding is viewed as a transmission line, for which the propagation of the voltage signal is described. However, the calculation becomes complex with the increase in the number of winding turns [39-41]. The finite element model is essentially a white box model, based on 3-dimensional electromagnetic simulation. The model is meshed into many small sections, or the so-called finite elements and the response of the is obtained by computing the response of each element in terms of electrostatic energy, leakage fluxes and electromagnetic forces.
With the increase in voltage levels, the winding structure of transformers has evolved over the years from a single helical to a double helical or multi-layer winding, or from a plain disc to an inter-shielded or interleaved disc winding. The variety of winding designs applied by transformer manufacturers intrinsically increased the variations of characteristics in the measured FRA spectra. In [7], space coefficient (α), is identified as the main factor influencing the shape of frequency responses in the high frequency region that is dominated by the winding structure (region C in Figure 3). This coefficient plays the key role in non-linear voltage distribution in windings during impulse test and is calculated as the square root of the ratio between Cg and Cs. Mathematical expressions related to the space coefficient are further developed in [35] for FRA pattern recognition and revealed the physics behind the variation of FRA shapes. Based on the understanding obtained in [7, 35], multiple oscillations are expected on the frequency responses measured on windings with low Cs value, such as helical winding and plain disc winding. On the other hand, fewer oscillations are expected on the frequency responses measured on windings with high Cs value, such as interleaved disc winding. In addition, coefficient α also affects the features in the low frequency region of the spectrum (region A in Figure 3). In [35, 36] mathematical equations are developed to locate the anti-resonance and its shape in the low frequency region through circuit analysis.
FRA spectra of region B are not only influenced by the winding interaction within the same phase, but also mutual impacts among different phases. A study conducted in [8] on a 400/275/13 kV, 1000 MVA autotransformer has shown how the FRA traces in this region are affected by mutual interactions among different phases through a delta connection. The study concludes that delta connection of tertiary windings is the reason for appearance of ‘double peak’ features on such autotransformers.
3. Field measurements
3.1 Transformer fleet
Table 1 summaries details about the tested transformer fleet. Altogether the measurements were performed on 577 power transformers, having power rating of 5-1000 MVA, voltage level between 6.9 and 400 kV and service age in the range of 1-65 years. Majority of these transformers are two winding, three phase step-down transformers from grid substations. Included in the study are also about 30 generator step-up single-phase transformers from hydro power plants. In addition, a few special transformers are included, such as three winding transformers, auto transformers and dry type transformers. The results of FRA and/or FDS measurements on all these transformers have been analysed by one or more authors either as parts of individual research projects [42-45] or within utility condition assessment programmes. Although the general conclusions drawn in this publication are based on experience from all these transformers, for clarity only a selected set of cases are presented in detail.
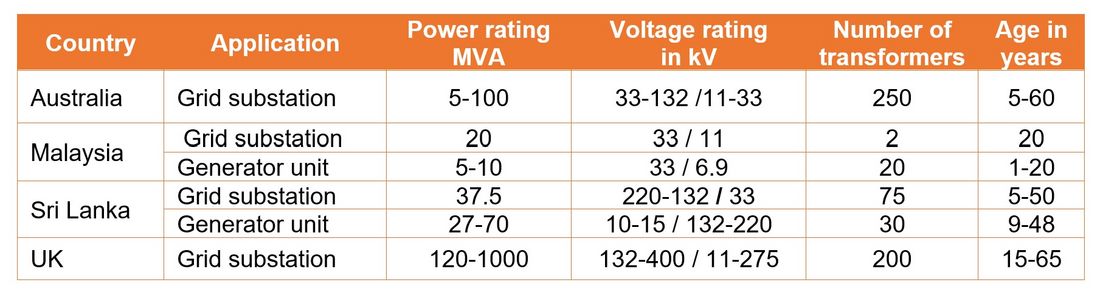
Table 1 - Summary of transformer fleet
3.2. FDS Measurements
In case of power transformers, FDS measurements are most frequently conducted for main insulation between HV and LV winding, as illustrated in Figure 5. During the measurement, HV and LV winding terminals are shorted separately and the frequency dependence complex capacitance C(ω), and hence dissipation factor, of the insulation is derived from the current response. It is important to connect the guard terminal of FDS equipment to the transformer tank to compensate for the leakage current.
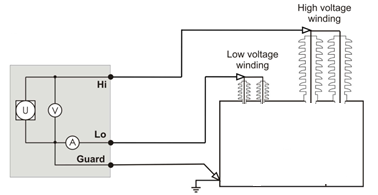
Figure 5 - Typical onsite FDS measurement connection for transformers [5]
3.3. FRA measurements
The frequency response is obtained by injecting a low voltage sinusoidal signal with a variable frequency into one terminal of the winding and measuring the response signal at the other terminal of the same winding. The voltage ratio of output and input signals in dB format is plotted against the frequency as the FRA magnitude response, and the phase angle difference between output and input signals is plotted as the FRA phase angle response. This method is called end-to-end open circuit measurement, which is the most commonly used connection scheme due to its simplicity and possibility to examine each winding individually. However, international standards [37,46] and CIGRE Technical Brochures [4,32] identify four main connection methods, as illustrated in Figure 6. Blocks Vs and Vr represent source voltage and response voltage respectively. In addition to these main configurations, FRA measurement schemes can be further categorised according to different terminal conditions such as neutral grounding or floating, phase injection or neutral injection. Anyhow, it is important to use the same connection scheme to obtain the reference and the diagnostic spectra. Good practices and caution related to factors affecting the measurement are extremely important (see Table 2 [4] for details).
Figure 6 - Four recommended winding connections for FRA measurements [4]
Table 2 - Summary of FRA measurement practices [4]
4. Results
4.1. FDS analysis for moisture and ageing estimation
This analysis focuses on assessment of moisture in paper insulation system using FDS measurement performed on 30 generator step-up transformers rated at 27-70 MVA and 10-15 kV. These transformers have been in service for 9-44 years. All of them have been well maintained and almost no oil leaks could be seen. Further, almost all the transformers are equipped with rubber diaphragm and replacement of moisture absorbent is done regularly. FDS measurements were performed for the frequency range of 0.1 mHz-1 kHz at peak voltage of 200 V using a commercial instrument. Moisture content in paper insulation was obtained from the inbuilt evaluation program in the instrument. In addition, moisture content in paper insulation (C) was evaluated from the measured relative moisture saturation in oil samples taken from the bottom filtering valve according to equation (3) [47].
(3)
where PV, is the vapor pressure of water in atmosphere in mmHg, and T is the absolute temperature in K. Concentration of dissolved 2-furfuraldehyde (2-FAL) was also measured in these oil samples by means of a commercial liquid chromatograph as per ASTM D5837, from which the degree of polymerization (DP) was calculated using Chendong’s equation [48]. All these tests were performed about 3-5 days after disconnecting the transformer from service, when the bottom oil temperature reached a constant value in the range of 23-35 °C and the difference between top and bottom oil temperatures was within 1 °C.
Figure 7 shows a comparison of the moisture content of the insulation assessed by using FDS and relative saturation (RS) techniques. Except for one of the transformers, the estimates based on FDS measurements are lower than the ones derived from relative saturation. This deviation can be explained by the effect of temperature distribution and ageing condition of the oil [49]. However, as a similar deviation has been observed for relatively new and aged oil samples, the effect of temperature distribution seems to be dominant over the effect of ageing condition.
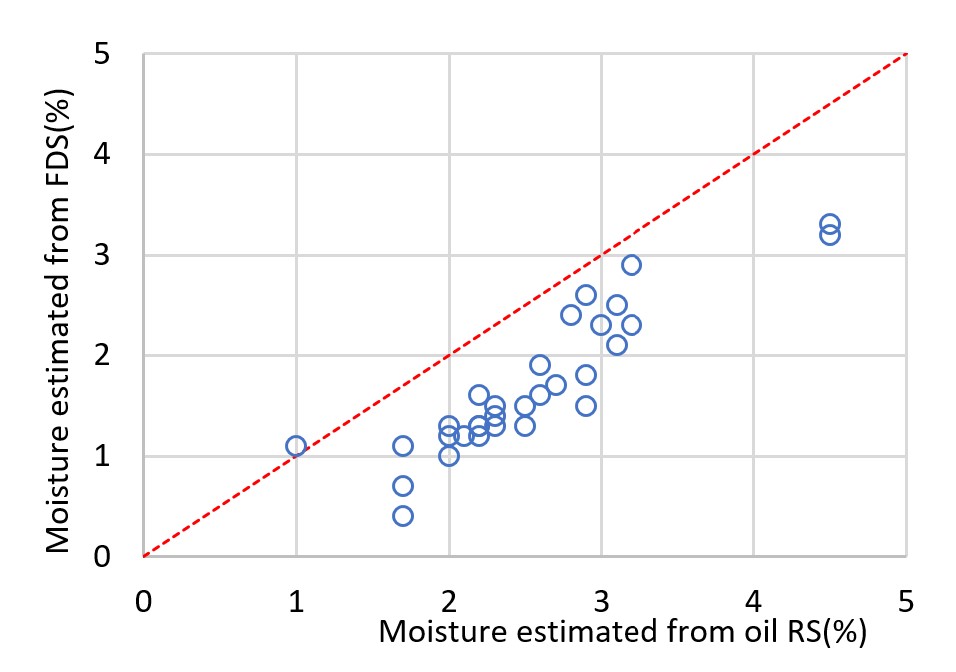
Figure 7 - Comparison of moisture contents in paper insulation estimated by two methods: FDS and relative moisture saturation in oil.
Figure 8 shows the correlation between moisture contents and DP values for all the transformers. Moisture content estimated by both FDS and RS techniques shows a linear relationship (correlation coefficient of ~ 80%) with the DP values. Particularly, as the array of transformers used in this study has been well maintained, it can be assumed that the moisture has been almost solely produced by ageing of paper insulation. This confirms that moisture content estimated by FDS or RS techniques provide a good indication of amount of moisture in transformer solid insulation. The reason for observing two clusters of DP values (one above 700 and one below 450) is due to the dynamics of 2-FAL equilibrium between paper insulation and oil, a comparatively lower rate of 2-FAL production rate appears when DP of paper insulation is greater than 400. It means, at the initial stage of paper ageing produces lower 2-FAL quantity and therefore, removal of 2-FAL due to oil filtering cannot be compensated, causing data points to move toward the right-hand side. On the other hand, when DP drops below 400 with ageing, production rate of 2-FAL is high and therefore, removal of 2-FAL due to oil filtering is compensated [50].
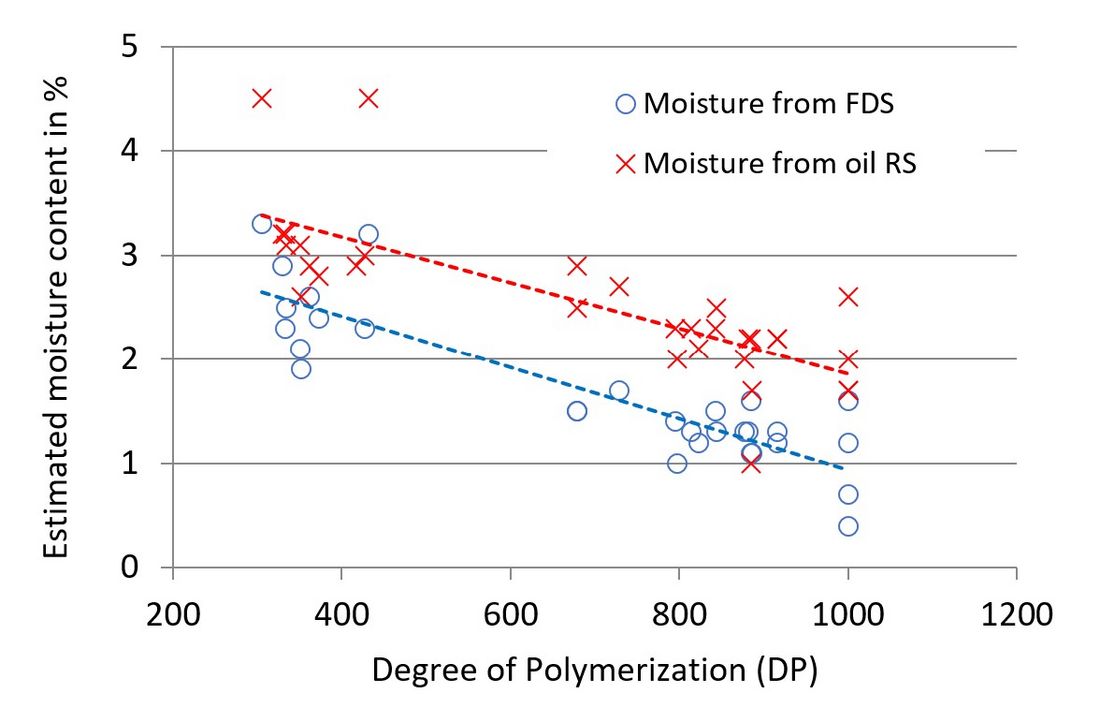
Figure 8 - Correlation between moisture content (based on FDS and oil RS) with DP (derived from 2 FAL concentration)
Figure 9 shows FDS curves for five selected single-phase transformers from one of the power plants. All the transformers are of the same design and in service for 37 years. Transformers of Unit 2, each connected to different phases have shown similar loss tangent spectra. However, the spectrum of Unit 3-R phase transformer considerably deviates from the others. When comparing these curves with the typical loss tangent spectrum shown in Figure 1, one can conclude that Unit 3-R phase transformer has lower moisture content and lower oil conductivity than the others (i.e. less aged). This observation agrees with both moisture and 2-FAL measurements; Unit 3-R has only 1.7% moisture content and those of Unit 1-R and Unit 2-R have respectively 2.3% and 2.9%. The calculated DP value of insulation in transformer Unit 3-R is as high as 730 whereas for the other two transformers they are 427 and 330, respectively.
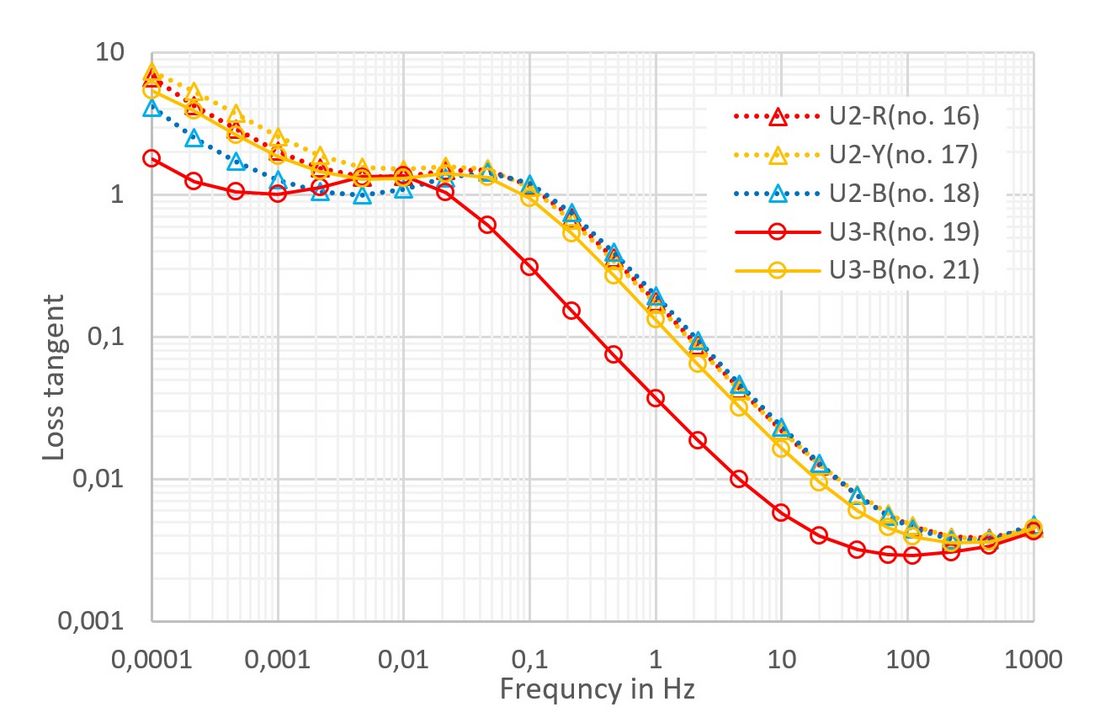
Figure 9 - Loss tangent spectrums of five single phase transformers in service for 37 years in a hydro power plant
4.2. FRA analyses for identification of mechanical faults
4.2.1. Fault in tap changer of an autotransformer
This case indicates detection of winding deformation through construction-based FRA comparison when reference data is not available. A 120 MVA, 275/132/11 kV, Yan0d three phase autotransformer installed in the UK in 1956 failed in 2004 due to an internal short circuit caused by damage to tap-changer from incorrect oil handling [42]. This transformer had a 3 limb-core, a helical type winding as tertiary winding, a plain disc common winding, a five-layer series winding and a two-layer multi-start tap winding. A line-end reverse tap changer was used at the terminal of common winding (132 kV) with a tap range from -15% to +15%, in 9 steps and 1.67% interval.
Due to lack of reference FRA data, construction-based analysis has been used for the diagnosis. Three end-to-end open circuit FRA tests were performed on the transformer. Figure (a) shows the FRA results obtained for common windings from 10 Hz to 2 MHz. Apart from the shift on the 1st peak of ‘double peak’ feature at around 3 kHz, most parts of the FRA plots were similar. The shift could have been caused by the direct electric connection between common winding and tap winding. This phenomenon is common in auto-transformer connection where winding interaction is the dominating factor [8]. In addition, minor shifts can be observed from 10 kHz to 100 kHz and at around 800 kHz, which indicate the winding mechanical fault caused by electrostatic and electromagnetic coupling between common and tap windings. Figure (b) shows the FRA results for tap winding, which clearly indicates the shift in the FRA spectra of B phase tap winding compared to other two phases, which confirms a significant deformation in B phase.
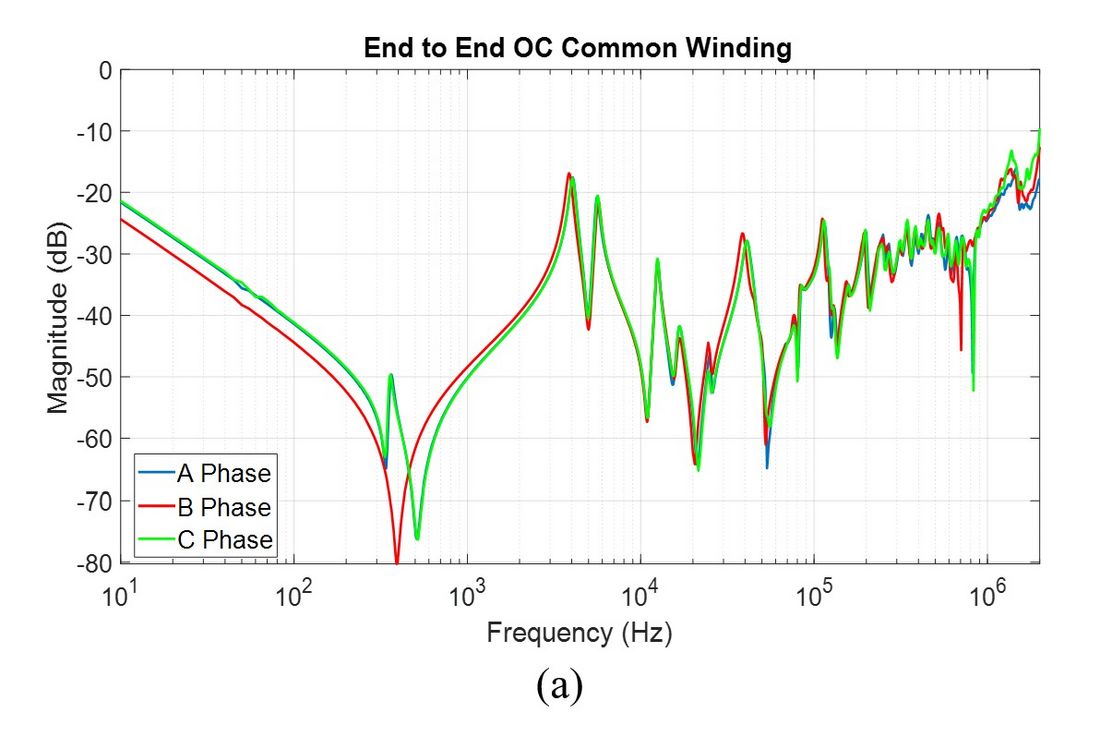
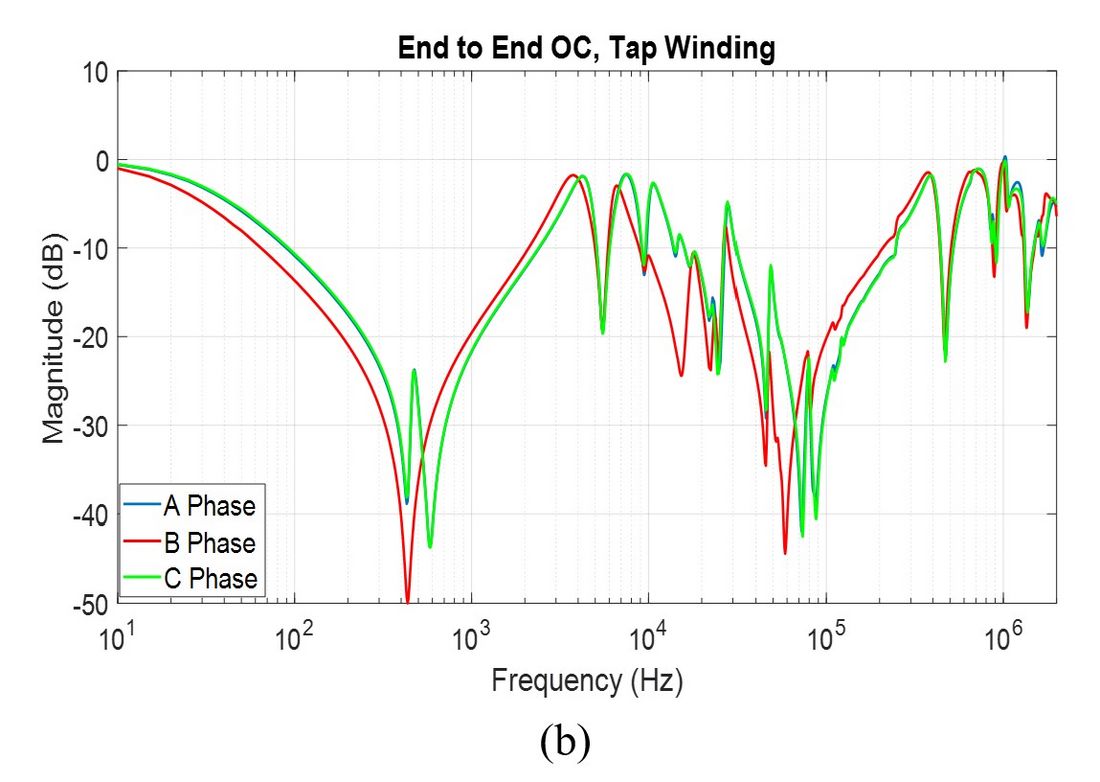
Figure 10 - Three phase FRA measured from; (a) common winding, (b) tap winding; for with end-to-end open circuit connection
4.2.2. Winding movement in a three-winding transformer
This case presents an investigation on a 60 MVA, 132/33 kV, YNyn0d11 three-winding power transformer from Australia having winding movements and displacements in winding blocks as shown in Figure 11. No electrical failures have been detected. Winding resistance measured after failure showed no significant variations from pre fault values. Turns ratio test also showed only minor variations up to 0.75% at a few tap positions.
FRA spectra obtained from the three HV windings with end-to-end open circuit connection are shown in Figure 12. The measurement was carried out for a frequency range of 20 Hz to 2 MHz. B phase FRA spectrum significantly deviates from the other two phases, especially for frequencies above 7 kHz. According to the theoretical framework presented in section 2.2, deviation in region C of the spectrum can indicate a change of the winding structure due to its deformation and movements.
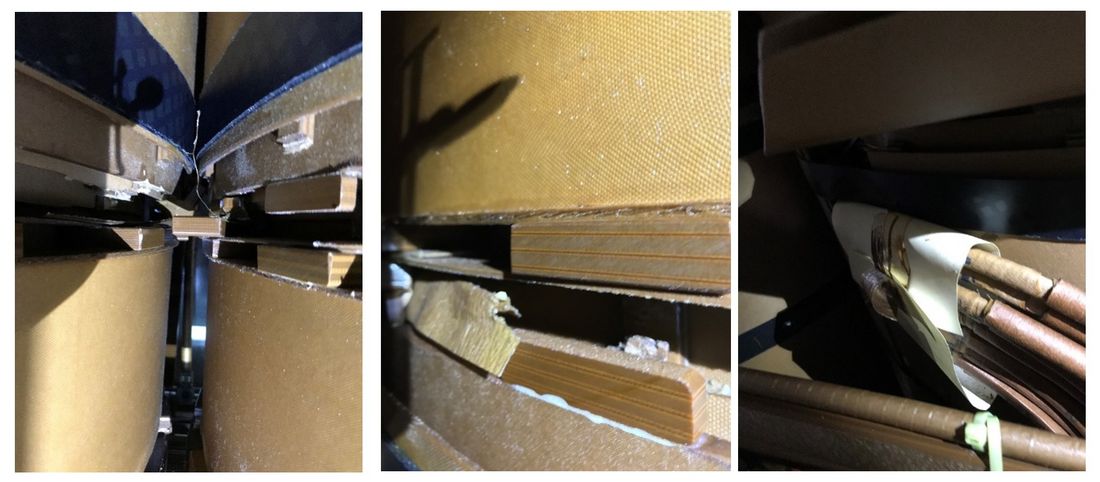
Figure 11 - Photos showing the winding movements
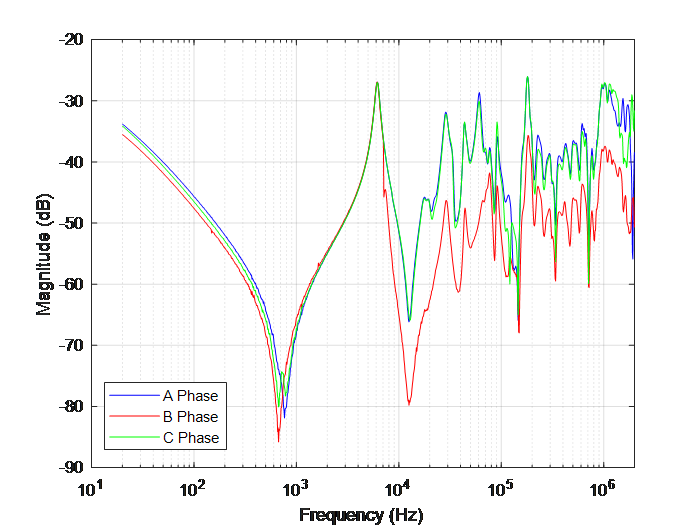
Figure 12 - Three phase FRA measured from HV winding with end-to-end open circuit connection
4.3. FRA for identification of insulation failures
4.3.1. Shorted LV windings in a decommissioned generator transformer
This analysis was performed for a 27 MVA, 132/12.5 kV, YNd11 generator transformer from Sri Lanka, which has been decommissioned due to operation of its protection unit after about 40 years in service. One year after the decommissioning, a comprehensive post-mortem analysis was conducted to identify and localize the fault in the transformer. First, performed electrical tests included measurements of FRA, winding resistance, voltage ratio and excitation current. Thereafter the winding was removed for detailed visual inspection, during which metal particles were found on the top york near to phase C winding, as shown in Figure 13. As no shorted lamination in the core was noticed, it was confirmed that the melted metal particles were of copper from shorted LV winding of C phase.
FRA measurements performed for all 4 configurations mentioned in section 3.3 were analysed to identify the fault. Out of them, only end-to-end and inductive configurations indicated severe winding deformation as per the standard guidelines. Figure 14 shows pre-fault and post-fault FRA spectra for two end-to-end open configurations: (a) C phase of HV winding while LV kept open, (b) LV winding, injected from b and measured from c while HV kept open. Clear deviations in low frequency region (i.e. region A) of this spectrum reveal that the magnetization component of C phase has changed significantly. In addition to this deviation, spectrum of LV winding shows a deviation in high frequency region (i.e. region C) whereas spectrum of HV winding(Fig. 13(a)) has no deviation in this region. Hence, it indicates that the fault is in either c phase of LV winding or the core limb. As an alternative method, similar fault identification can be achieved by end to end short circuit tests performed on both HV and LV sides. If the fault is located on the shorted winding spectrum of three phases will be similar whereas, if it is located on the supplied winding, the faulted phase will be different. In either method, further discriminate between two possibilities (winding short circuit or fault in core limb) requires other tests.
As an alternative option, it is possible to reach similar predictions by analysing the magnetization current, as presented in Table 3. It can further be refined as a winding short circuit fault by considering results of winding resistance and turn ratio tests.
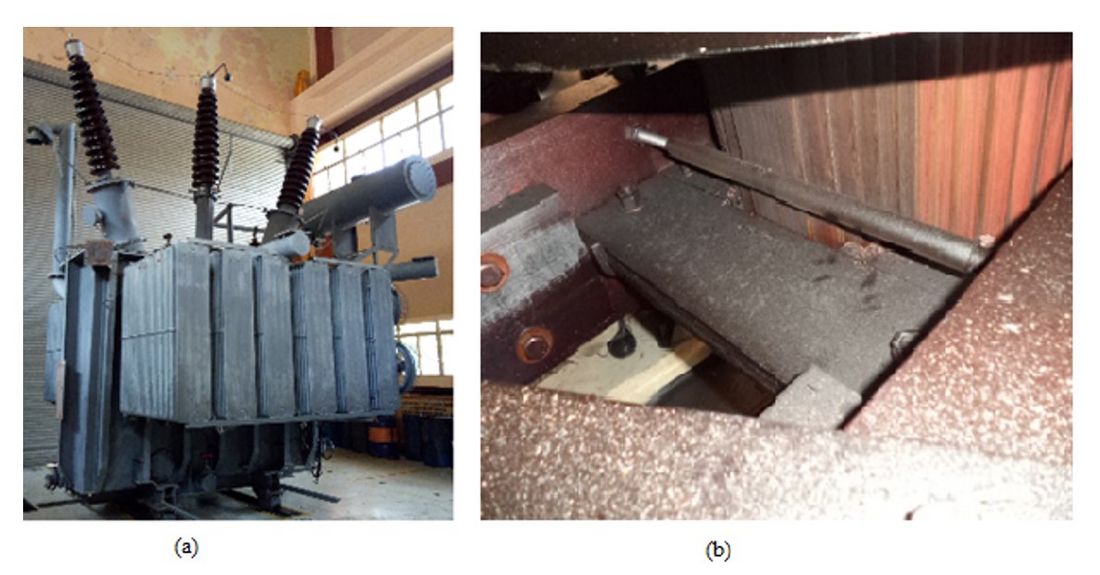
Figure 13 - (a) Photograph of the decommissioned transformer,(b) metal particles on the york near to phase c
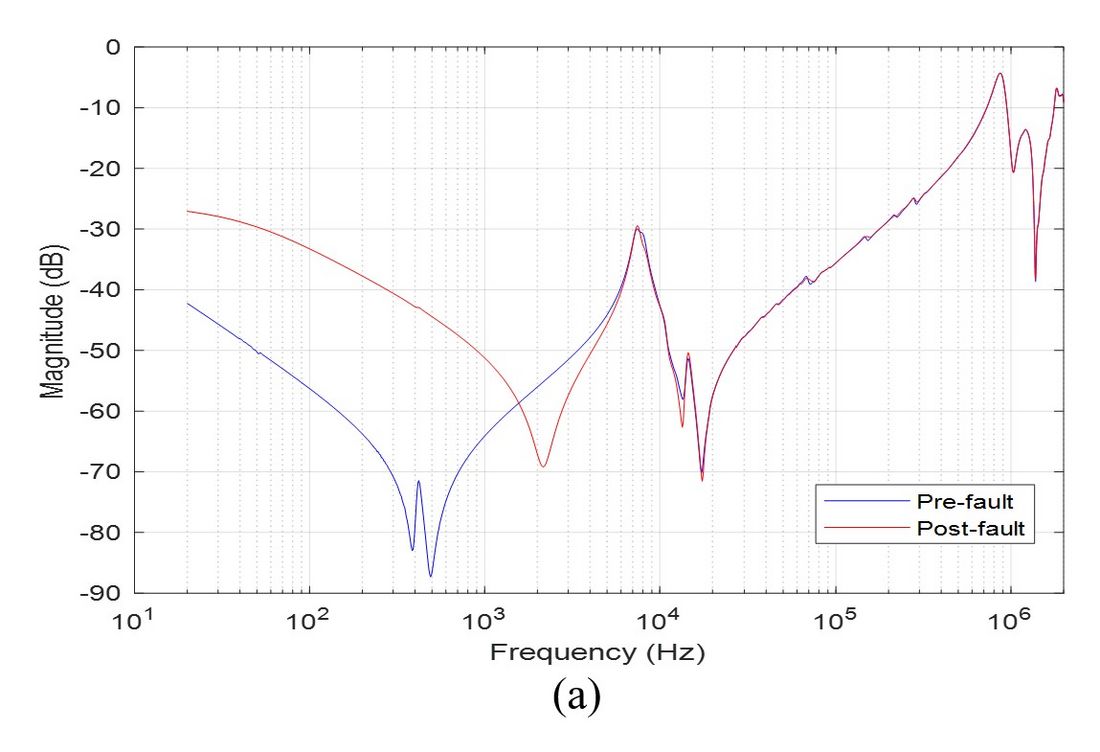
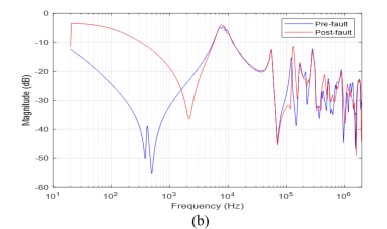
Figure 14 - FRA measured for: (a) C phase of HV winding with end-to-end open circuit connection and (b) c phase of LV winding by injecting from b phase while HV winding kept open
Table 3 - Result of other electrical tests
4.3.2. Turn to turn insulation failure in a grid substation transformer (from Sri Lanka)
A 75 MVA, 220/33 kV, YNd1 power transformer in Sri Lanka was tripped by differential protection. A series of test including FRA, DGA, excitation current, ratio test, winding resistance and insulation resistance were conducted after the failure incident. Three phase FRA spectrum of LV windings shown in Figure 15 was used for fault identification. A deviation among three windings like that one presented in section 4.3.1 between pre fault and after fault FRA spectra can be seen here. Low frequency regions of windings a-b and b-c have similar shape to the pre fault case whereas the shape of spectrum for windings c-a follows the post fault case. This clearly indicate that the magnetic component of windings c-a has changed either due turn-to-turn insulation failure or a fault in the core limb. By analysing the results of other tests, as shown in Table 4, similar conclusions on fault location in the turn-to-turn insulation of windings c-a can be drawn.
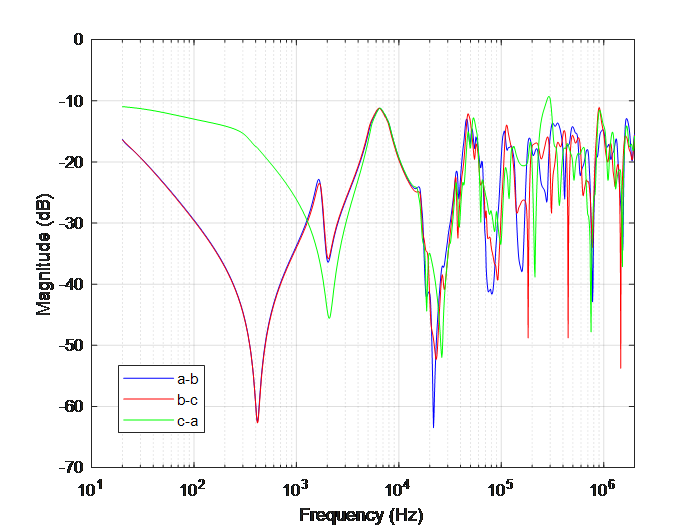
Figure 15 - Three phase FRA spectra measured from LV windings while HV kept open
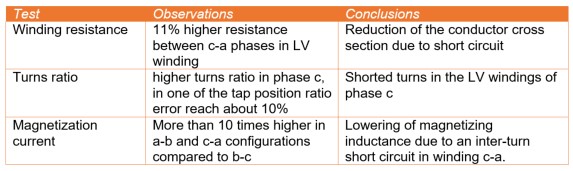
Table 4 - Result of some other electrical tests
4.3.3. Dry type transformer of special design
This case is related to a special design dry-type 1250 kVA, 6.6/0.48/0.415 kV transformer from Malaysia shown in Figure 16(a). The transformer has four windings where three of them are LV windings. The transformer was subjected to offline electrical tests (FRA, winding resistance and turn ratio) prior to servicing the unit. During the inspection, burn mark was spotted at the corner of the LV winding of phase c, as shown in Figure 16(b). The fault could occur due to high electrical stress at the corner of the winding and tap lead, resulting in partial discharge activity in this area and consequently a development of localised hot spot.
Results from end-to-end open circuit FRA measurements on the HV windings are provided in Figure 17. Response of phase C in the low frequency region (below 10 kHz) deviates considerably from the other two phases, indicating a change of magnetic performance. This deviation is similar to the deviations observed in section 4.3.1 and 4.3.2 for low voltage windings with turn-to-turn insulation failures. As summarized by Table 5, winding resistance and turn-to-turn ratio test further confirmed this conclusion.
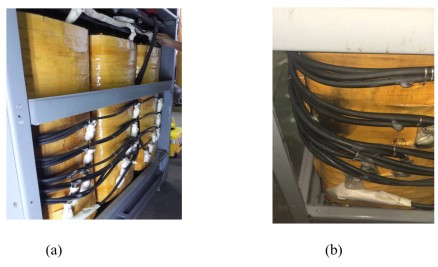
Figure 16 - (a) Windings of the dry-type transformer, (b) burn marks near the corner of a winding
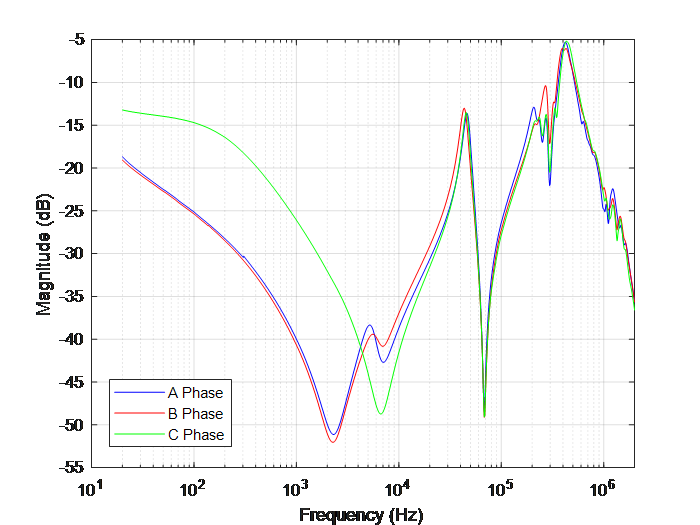
Figure 17 - Three phase FRA spectra measured from HV winding with end-to-end open circuit connection
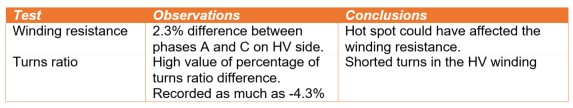
Table 5 - Result of other electrical tests on dry type transformer
4.3.4. Open winding in a distribution transformer
In this case study, a 20 MVA, 33/11 kV, Dyn11 distribution transformer from Malaysia experienced tripping shortly after it was energized after a routine offline maintenance work. The team was requested to perform various electrical tests including FRA on the unit to determine the cause of tripping. Figure 18(a) and (b) show the damage found in on-load tap changer and in phase B of HV winding respectively. Three phase FRA spectra for end-to-end open circuit response of the HV winding are shown in Figure 19. The trend seen in the region from 40 Hz to 4 kHz indicates that response of all three phases are governed by capacitive element. It should have a negative trending slope due to winding and core magnetising inductance, but the impact of the capacitive element indicates the presence of an open circuit between the terminals due to damage in the tap changer. Resonances appear in frequency range of 20-40 Hz, at which instrument is working at lower level of its dynamic range, is most probably due to noise floor.
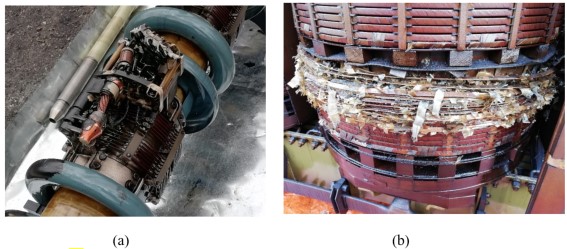
Figure 18 - (a) Damaged on-load tap changer and (b) damaged B phase of HV winding
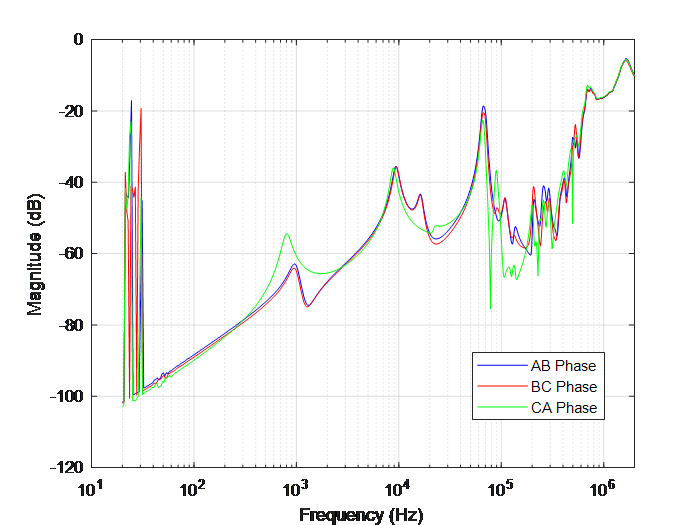
Figure 19 - Three phase FRA spectra measured from HV winding with end-to-end open circuit connection
5. Summary and conclusions
In this section, the main observations from FDS and FRA tests conducted on different transformers from Australia, Malaysia, Sri Lanka and the UK are summarised. Under FDS tests, more than 150 transformers having voltage levels up to 220 kV and ages up to 50 years were investigated. A reliable estimation of the moisture content in solid insulation is important for condition monitoring and maintenance of power transformers. The presented results here of FDS tests for 30 generator transformers from Sri Lanka were compared for further verification with other oil tests and a correlation coefficient of 80% was obtained. This verifies the high reliability of the FDS technique for estimating moisture content of oil impregnated insulation of power transformers.
The in parallel performed study of 2-FAL content in transformer oils were used to estimate the DP values for estimating the degree of ageing of the transformer insulation. It was interesting to note that the moisture content level of transformer pressboard derived by FDS measurement had a good agreement with estimated DP values. As the final remark, our observations confirm that the insulation ageing is determined by the level of moisture content, which in turn can be estimated by conducting an FDS test.
For the FRA measurements, more than 500 transformers of ages up to 65 years were tested. They included generator transformers, grid step-down transformers, autotransformers and distribution transformers, rated at voltage levels up to 220 kV/400 kV and 1000 MVA. Unlike in FDS analyses which indicates the condition of the whole insulation system, FRA spectra could be used for detecting mechanical and insulation failures of the transformer windings. However, a reference FRA spectrum is needed for comparison, as the diagnostic spectrum on its own does not allow directly identifying the fault. We however propose a possibility of identification of winding short circuit condition under construction-based FRA testing, for turn-to-turn insulation failures the responses significantly deviated from those of a healthy winding in the low frequency region. In case of mechanical faults, a clear shift of the resonant frequencies and/or appearance or disappearance of resonances in frequency responses were observed in the entire or part of the middle frequency range (2 kHz-2 MHz).
References
- J. Singh, Y. R. Sood and R. K. Jarial, "Condition Monitoring of Power Transformers - Bibliography Survey," IEEE Electrical Insulation Magazine, vol. 24, no. 3, pp. 11-25, June 2008.
- S. Tenbohlen, S. Coenen, M. Djamali, A. Müller, M.H. Samimi and M.Siegel, “Diagnostic Measurements for Power Transformers,” Energies, vol. 9, p. 347,2016.
- Cigre technical brochure 642, “Transformer Reliability Survey,” Cigre working group WG A2.37, 2015.
- Cigre technical brochure 342, “Mechanical Condition Assessment of Transformer Windings using Frequency Response Analysis (FRA),” Cigre working group WG A2.26, 2008.
- S.M. Gubanski, J. Blennow, B. Holmgren, M. Koch, A. Kuechler, R. Kutzner, et al., "Dielectric Response Diagnoses for Transformer Windings", CIGRE Technical Brochure 414 WG D1.01 (TF 14), 2010.
- C. Ekanayake, S. M. Gubanski, A. Graczkowski and K. Walczak, "Frequency response of oil impregnated pressboard and paper samples for estimating moisture in transformer insulation," IEEE Trans. on Power Delivery, vol. 21, no. 3, pp. 1309-1317, July 2006.
- Z.D. Wang, J. Li and D. M. Sofian, "Interpretation of Transformer FRA Responses— Part I: Influence of Winding Structure," IEEE Trans. on Power Delivery, vol. 24, no. 2, pp. 703-710, April 2009.
- D. M. Sofian, Z.D. Wang and J. Li, "Interpretation of Transformer FRA Responses— Part II: Influence of Transformer Structure," IEEE Trans. on Power Delivery, vol. 25, no. 4, pp. 2582-2589, Oct. 2010.
- A. Abu-Siada, N. Hashemnia, S. Islam and M. A. S. Masoum, "Understanding power transformer frequency response analysis signatures," IEEE Electrical Insulation Magazine, vol. 29, no. 3, pp. 48-56, May-June 2013, doi: 10.1109/MEI.2013.6507414.
- M. Bagheri, B. T. Phung and T. Blackburn, "Influence of temperature and moisture content on frequency response analysis of transformer winding," IEEE Trans. on Dielectrics and Electrical Insulation, vol. 21, no. 3, pp. 1393-1404, June 2014.
- M. F. M. Yousof, C. Ekanayake and T. K. Saha, "Examining the ageing of transformer insulation using FRA and FDS techniques," IEEE Trans. on Dielectrics and Electrical Insulation, vol. 22, no. 2, pp. 1258-1265, April 2015.
- M. F. M. Yousof, C. Ekanayake and T. K. Saha, "Frequency response analysis to investigate deformation of transformer winding," IEEE Trans. on Dielectrics and Electrical Insulation, vol. 22, no. 4, pp. 2359-2367, August 2015.
- Y. Liu et al., "A study of the sweep frequency impedance method and its application in the detection of internal winding short circuit faults in power transformers," IEEE Trans. on Dielectrics and Electrical Insulation, vol. 22, no. 4, pp. 2046-2056, August 2015.
- S. A. Ryder, "Diagnosing transformer faults using frequency response analysis," IEEE Electrical Insulation Magazine, vol. 19, no. 2, pp. 16-22, March-April 2003.
- N. Abeywickrama, Y. V. Serdyuk and S. M. Gubanski, "High-Frequency Modeling of Power Transformers for Use in Frequency Response Analysis (FRA)," IEEE Trans. on Power Delivery, vol. 23, no. 4, pp. 2042-2049, Oct. 2008.
- M. Bagheri, B. T. Phung and T. Blackburn, "Transformer frequency response analysis: mathematical and practical approach to interpret mid-frequency oscillations," IEEE Trans. on Dielectrics and Electrical Insulation, vol. 20, no. 6, pp. 1962-1970, December 2013.
- M. H. Samimi and S. Tenbohlen, "FRA interpretation using numerical indices: State-of-the-art", Int. J. Electr. Power Energy Syst., vol. 89, pp. 115-125, 2017.
- J. Blennow, C. Ekanayake, K. Walczak, B. Garcia and S. M. Gubanski, "Field experiences with measurements of dielectric response in frequency domain for power transformer diagnostics," IEEE Trans. on Power Delivery, vol. 21, no. 2, pp. 681-688, April 2006.
- I. Atanasova-Höhlein et al., "Experience with capacitive on-line sensors for moisture evaluation in transformer insulation," IEEE Electrical Insulation Magazine, vol. 35, no. 2, pp. 18-26, March-April 2019.
- W. M. S. C. Samarasinghe, J. R. S. S. Kumara, M. A. R. M. Fernando and A. U. A. W. Gunawardena, "Aging assessment of transformer pressboard insulation by micro-strip ring resonator at GHz frequencies," IEEE Trans. on Dielectrics and Electrical Insulation, vol. 24, no. 3, pp. 1923-1930, June 2017.
- W. M. S. C. Samarasinghe, J. R. S. S. Kumara, M. A. R. M. Fernando, A. C. M. Ahamed and A. U. A. W. Gunawardena, "Moisture estimation of transformer pressboard by micro-strip ring resonator at GHz frequencies," IEEE Trans. on Dielectrics and Electrical Insulation, vol. 23, no. 3, pp. 1409-1417, June 2016.
- N. Fuse, T. Takahashi, Y. Ohki, R. Sato, M. Mizuno and K. Fukunaga, "Terahertz spectroscopy as a new tool for insulating material analysis and condition monitoring," IEEE Electrical Insulation Magazine, vol. 27, no. 3, pp. 26-35, May-June 2011.
- M. Koch and T. Prevost, "Analysis of dielectric response measurements for condition assessment of oil-paper transformer insulation," IEEE Trans. on Dielectrics and Electrical Insulation, vol. 19, no. 6, pp. 1908-1915, 2012.
- R. B. Jadav, C. Ekanayake, and T. K. Saha, "Understanding the impact of moisture and ageing of transformer insulation on frequency domain spectroscopy," IEEE Trans. on Dielectrics and Electrical Insulation, vol. 21, no. 1, pp. 369-379, 2014.
- C. Ekanayake, "Diagnosis of Moisture in Transfomer Insulation- Application of frequency domain spectroscopy," PhD Thesis, Chalmers Univesrity of Technology, gothenburg, Sweden, 2006.
- M. Koch, M. Kruger and M. Gupta, "A fast and reliable dielectric diagnostic method to determine moisture in power transformers," International Symposium on Electrical Insulating Materials (ISEIM 2008), Mie, 2008, pp. 672-672.
- D. Linhjell, L. Lundgaard, and U. Gafvert, "Dielectric response of mineral oil impregnated cellulose and the impact of aging," IEEE Trans. on Dielectrics and Electrical Insulation, , vol. 14, no. 1, pp. 156-169, 2007.
- J. H. Yew, T. K. Saha, and A. J. Thomas, "Impact of temperature on the frequency domain dielectric spectroscopy for the diagnosis of power transformer insulation," in Power Engineering Society General Meeting, 2006, 2006, p. 7.
- M. Koch, M. Krueger, and M. Puetter, "Advanced insulation diagnostic by dielectric spectroscopy," TechCon Asia Pacific, Sydney, Australia, 2009.
- U. Gafvert, G. Frimpong, and J. Fuhr, “Modeling of dielectric measurements on power transformers,” Proceeding of CIGRE sessions, Vol. 5, pp. 8-8, 1998.
- S.M. Gubanski, G. Csépes, V. Der, Houhanessian, J. Filippini, P. Guuinic, U. Gäfvert, V., Karius, J. Lapworth, G. Urbani, P. Werelius, W.Zaengl, "Dielectric response methods for diagnostics of power transformers," IEE Electrical Insulation Magazine, vol. 19, no. 3, pp. 12-18, 2003.
- Cigre technical brochure 812, “Advances in the Interpretation of Transformer Frequency Response Analysis (FRA),” Cigre working group WG A2.53, 2020.
- E. Rahimpour, J. Christian, K. Feser, and H. Mohseni, "Transfer function method to diagnose axial displacement and radial deformation of transformer windings," IEEE Trans. on Power Delivery, vol. 18, no. 2, pp. 493-505, 2003.
- K. G. N. B. Abeywickrama, Y. V. Serdyuk, and S. M. Gubanski, "Exploring possibilities for characterization of power transformer insulation by frequency response analysis (FRA)," IEEE Trans. on Power Delivery, vol. 21, no. 3, pp. 1375-1382, 2006.
- B.Z. Cheng, Z.D. Wang, and P. A. Crossley, "Using Lumped Element Equivalent Network Model to Derive Analytical Equations for Interpretation of Transformer Frequency Responses," IEEE Access, vol. 8, pp. 179486-179496, 2020.
- B.Z. Cheng, X.Z. Mao, Y.X. Yang, Z.D. Wang, P.A. Crossley, and A. Fieldsend-roxbrough, "Factors dominating low frequency ‘V, ∩, U’ shape features in transformer FRA spectra," IEEE International Conference on High Voltage Engineering and Application, 2020.
- IEC 60076-18, “Power Transformers-part 18: Measurement of Frequency Response," 2012.
- K. Cornick, "Distribution of very fast transient overvoltages in transformer windings," CIGRE report, 1992.
- M. Popov, L. V. D. Sluis, R. P. P. Smeets, and J. L. Roldan, "Analysis of Very Fast Transients in Layer-Type Transformer Windings," IEEE Trans. on Power Delivery, vol. 22, no. 1, pp. 238-247, 2007.
- M. Popov, L. V. D. Sluis, R. P. P. Smeets, J. Lopez-Roldan, and V. V. Terzija, "Modelling, simulation and measurement of fast transients in transformer windings with consideration of frequency-dependent losses," IET Electric Power Applications, vol. 1, no. 1, pp. 29-35, 2007.
- T. Ji, W. Tang, and Q. Wu, "Detection of power transformer winding deformation and variation of measurement connections using a hybrid winding model," Electric Power Systems Research, vol. 87, pp. 39-46, 2012.
- X. Mao, "Transfer Function Estimation and AI Application for Transformer FRA Interpretation," PhD Thesis, University of Manchester, 2019.
- X. Mao, Z. Wang, P. Jarman and A. Fieldsend-Roxborough, "Winding Type Recognition through Supervised Machine Learning using Frequency Response Analysis (FRA) Data," 2nd International Conference on Electrical Materials and Power Equipment (ICEMPE), 2019, pp. 588-591.
- G. A. T. N. Aravinda, K. Bandara, G. A. Jayantha, J. R. S. S. Kumara and M. A. R. M. Fernando, "Application of SFRA techniques to discriminate short circuit faults of transformer winding," IEEE International Conference on Industrial and Information Systems (ICIIS), 2017, pp. 1-5.
- T. Samarasingha, J.R.S.S. Kumara, M.A.R.M. Fernando, "Condition Assessment of Power Transformers using Dissolved Gas Analysis", 111th IESL Annual Sessions, Colombo, Sri Lanka, 2017.
- IEEE Std C57.149-2012, "IEEE Guide for the Application and Interpretation of Frequency Response Analysis for Oil-Immersed Transformers,", pp. 1-72, 2013.
- Y. Du, M. Zahn, B. C. Lesieutre, A. V. Mamishev and S. R. Lindgren, "Moisture equilibrium in transformer paper-oil systems," IEEE Electrical Insulation Magazine, vol. 15, no. 1, pp. 11-20, Jan 1999.
- C. D. Xue, “Monitoring paper insulation aging by measuring furfural contents in oil,” 7th International Symposium on High Voltage Engineering, 1991, pp.139–142.
- M. Koch, S. Tenbohlen, T. Stirl, "Diagnostic Application of Moisture Equilibrium for Power Transformers", IEEE Transactions on Power Delivery, Vol. 25, No. 4, pp. 2574-2581, October 2010.
- A. M. Emsley, X. Xiao, R. J. Heywood and M. Ali, "Degradation of cellulosic insulation in power transformers. Part 3: effects of oxygen and water on ageing in oil," IET Science, Measurement and Technology, vol. 147, no. 3, pp. 115-119, May 2000.