Frequency and Voltage Stability Towards 100% Renewables in Suðuroy, Faroe Islands
Authors
H.M. TRÓNDHEIM - The Power Company SEV, Aalborg University and the University of the Faroe Islands
L. HOFMANN - Leibniz University Hannover
P. GARTMANN, E. QUITMANN - Enercon GmbH
C. LETH BAK, F. FARIA DA SILVA - Aalborg University
T. NIELSEN - The Power Company SEV
B.A. NICLASEN - University of the Faroe Islands

Summary
Frequency and voltage stability is a challenge as power systems move towards a more renewable future. This study focuses on the power system of Suðuroy, Faroe Islands, which is in the transition towards 100% renewables. The impact of three events on the frequency and voltage responses has been simulated based on 2020, 2023, 2026 and 2030 and with different settings using a measurement validated model. These results show that additional ancillary services, provided by e.g., batteries and synchronous condensers, are required to keep the stability level at the same level as today. The isolated power system in Suðuroy (~10% of total annual demand) will be connected to the main grid (~90% of total annual demand) in the future (2026 according to the RoadMap), and thus the system has also been studied with this interconnection. According to the simulation results, the main grid contributes significantly to the power system stability in Suðuroy when the systems are interconnected. The impact of how the main grid has been represented is also analysed by conducting simulations using a detailed model of the main grid or approximated models. The results show that the suggested approximated models do not show a sufficiently accurate response compared to the detailed model; especially when batteries in the main grid are contributing with active power regulation. Therefore, new approximated models of power systems with high shares of inverter-based technologies should be developed with this consideration. Finally, the contribution from wind turbine inertia emulation is analysed and shows that the system frequency nadir can be improved with the emulated inertia feature switched on.
Keywords
Inertia emulation - isolated power system - network reduction - power system stability - renewable energyNomenclature
SEV: The Power Company in the Faroe Islands
SCP: Short circuit power
BS and BESS: Battery energy storage system
SC: Synchronous condenser
AVR: Automatic voltage regulators
IE: Inertia emulation
PV: Photovoltaics
IBR: Inverter based resources
ROCOF: Rate of change of frequency
PDF: probability density function
1. Introduction
Suðuroy is the most southern island of the Faroe Islands in the North Atlantic Ocean, see Figure 1 [1]. The Faroese Power System has seven individual grids of different sizes and complexity, and the isolated power system on Suðuroy is one of these seven grids. The energy production in Suðuroy in 2020 was 35 GWh in total, which was 9% of the total generation in the Faroe Islands and consisted of diesel and heavy fuel oil (85%), hydro (11.5%), wind (3%) and solar power generation (0.5%). The low wind power generation is due to the wind farm being inaugurated in February 2021, and thus only in operation in 2020 for test runs etc.
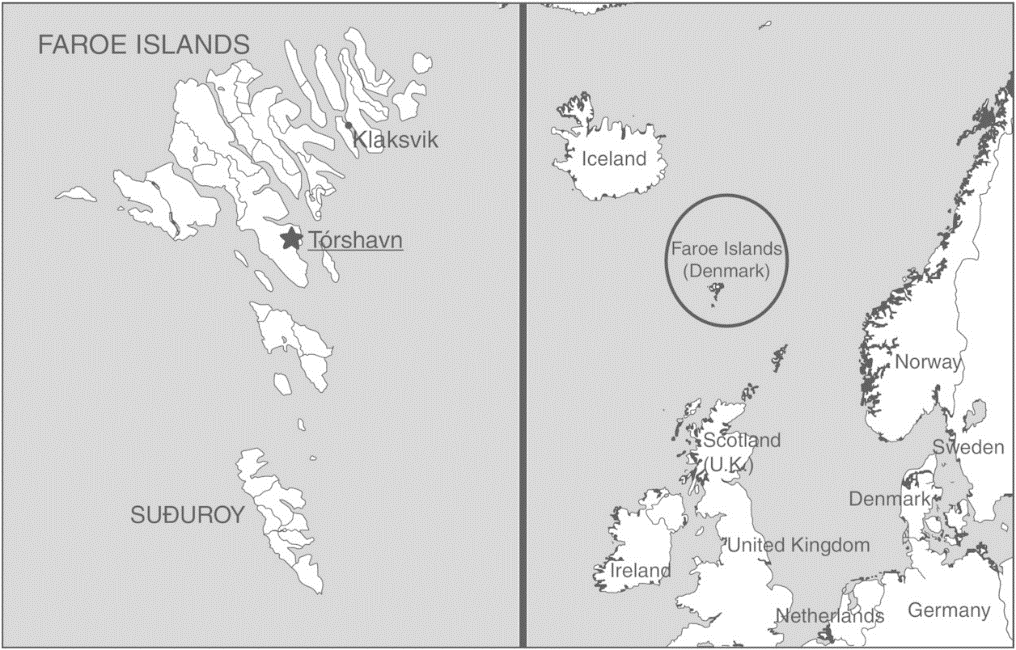
Figure 1 – Map of the Faroe Islands
The average demand in Suðuroy in 2020 was 4.0 MW, with a minimum of 1.8 MW and a maximum of 8.0 MW. The reason behind the great variation is a relatively large fish factory, which was in operation for around 2000 hours in 2020. A load curve for the demand in Suðuroy in 2020 can be found in Figure 2 plot (a). Plot (b) in Figure 2 shows the average hourly demand for the months March-July in 2020 and thus shows the daily and to some degree seasonally demand variations. January-February and August-December are not included in plot (b) as the previously mentioned factory was online during certain periods of these months, and the inclusion of these would not illustrate the daily and seasonal variations.
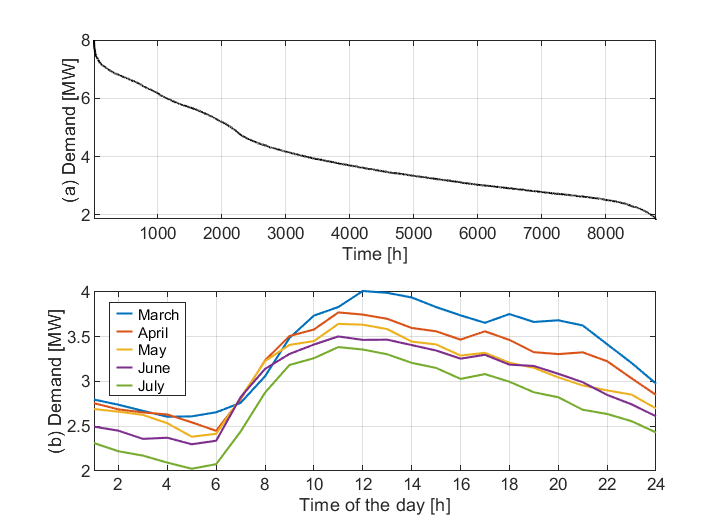
Figure 2 – (a) Load duration curve of demand in Suðuroy 2020. (b) Average hourly demand for months March-July in 2020
SEV, the local utility, is aiming for 100% renewable electricity generation by 2030. This requires expansions in renewable generation capacity, storage systems, energy management systems and state-of-the-art solutions to ensure a stable and reliable power system operation, as the share of traditional synchronous generators decreases.
Synchronous generators have the capability to provide the ancillary services needed to ensure a stable supply after a disturbance, i.e., active and reactive power provision for frequency and voltage control, respectively. However, these are becoming a smaller share of the total generation, as the synchronous generators are replaced with wind turbines and photovoltaics, which can result in a grid with decreased inertia, short circuit power (SCP) and active and reactive power provision. The integration of inverter-based generation therefore will have a detrimental impact on stability, if traditional procedures continue to be used in all power systems, but especially in smaller isolated power systems like the Faroe Islands [2]–[4]. The specific challenges for power systems depend on the type of generation, and these have been addressed in previous review studies [5]–[7]. To ensure the stability of a power system with a high penetration of inverter-based renewables (IBR), it is, therefore, necessary to simulate and analyse the systems. This study addresses frequency and voltage stability challenges associated with reaching 100% renewables in an isolated grid, using a model, that has been dynamically validated based on measurements from trip tests. This is not an ordinary engineering task.
A relevant state-of-the-art characteristic of the power system is the probability density function (PDF) of voltage and frequency for the island. Any future change in the system should lead to a PDF which is close to previous years if the distribution of the frequency should be maintained. This could be the benchmark if a change has improved or deteriorated the quality of the power supply. Figure 3 shows the probability density function based on frequency measurements with a resolution of 1 s in Suðuroy before (2018-2020) and after (2021) the wind farm was installed. It is quite clear that the wind farm has led to a larger variance in the frequency, as 2021 differs from 2018-2020 and no other significant changes have been made in the system.
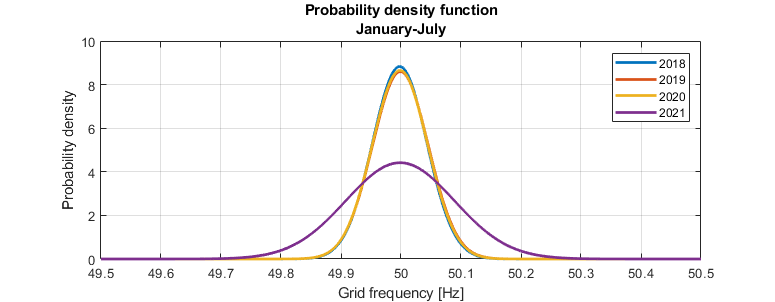
Figure 3 – Probability density function based on 10 Hz grid frequency measurements in Suðuroy from January to July 2018 to 2021
The power system stability in Suðuroy and the main grid approaching 100% renewables has been studied previously, but all of these studies are considered initial studies, as they have either had a narrow scope or have been done using power system models, which have not been validated [8]–[13]. The topics covered in previous publications include full system simulations [8]–[10] and providing ancillary services using batteries [11], heat pumps [12], synchronverters [13] and wind turbine controls [9]. Whilst studies on the power system stability in the Faroe Islands are limited, the potential investments in generation, storage and transmission system expansion towards 100% renewables in the Faroe Islands have been thoroughly investigated in multiple studies [14]–[20]. A detailed RoadMap for generation, storage and transmission can be found in [20]. The RoadMap contains project-specific investments, which specify e.g. power plant sizes, locations and investment year, which are based on an economic optimisation and consider a demand increase from 369 GWh in 2020 to 633 GWh in 2030, due to an increase in the normal electricity usage and electrification of the heating and transport sectors. This RoadMap is used as a basis for expansions towards 2030, see section 2.1.
In many study cases, only a part of a system is of interest, not the whole system. Including the whole system in computer simulations increases the calculation time and the complexity of the simulations, and therefore different network reduction methods have been developed to approximate the large system's static and dynamic behaviour over the past decades [21]. As the distributed generation has increased, newer approaches have been developed, which consider the distributed generation as well as synchronous generation [22]. While most reduction methods require the full system model to be computed, recent research also proposes methods using wide-area measurements to compute dynamic equivalents [23]. Simulation software also have built-in models for network equivalents. For example, DIgSILENT's PowerFactory provides a model component called External Grid.ElmXnet [24].
This paper addresses an uncommon task, the transition of a small isolated system towards 100% renewables. The study focuses on the voltage and frequency stability of the island Suðuroy, and how these are affected by 1) a sudden drop in wind power production, 2) an outage of a synchronous generator and 3) a load rejection. The events are analysed for the following expansion stages of the system: 2020, 2023, 2026 and 2030. Thus, the impact on the system stability of replacing thermal synchronous generators with renewables towards 2030 is addressed. The analysis of 2023 and 2026, shows that analysing the start (2020) and end (2030) dates can result in missing problems in-between. The study is based on an existing system, which is under development to reach a cleaner energy production, and it uses validated dynamic models and an actual expansion plan. It is based on a scientific engineering approach to overcome the uncertainties and challenges in the actual expansion of the Faroese power system, in contrast to the mainly theoretical approach of most such studies. Suðuroy will be connected to the main grid in 2026 via a single link [20], and a common method to analyse the stability of Suðuroy post connection would be to simplify the main grid at the end of the cable connection, to reduce the computational time and the complexity of the system. This study shows that reducing the main grid leads to some implications, e.g. capturing frequency triggered technologies which contribute to frequency stability accurately. This is done by comparing the simulation results using a detailed model of the main grid and two different approximations. The results, therefore, contribute to the discussion on whether present-day equivalents are sufficient to represent a grid with high levels of inverter-based technologies, or if detailed models are needed. Based on the approximations used in this analysis, the dynamic response is inaccurate, so a detailed model is needed, or an approximated model, which considers frequency triggered technologies. The main contributions of this study are the results showing the implications of using approximated models in power systems with a high share of inverter-based technologies, as well as the aspect of this being a study on the challenges in an actual isolated system aiming for 100% renewables.
The power system of Suðuroy is presented in section 2, while the investigation approach is described in section 3. The results of the study are presented and discussed in section 4 and concluded in section 5.
2. The Existing and Future Power System
The power system in Suðuroy is a hybrid power system, which is under continuous development. Figure 4 shows a single line diagram of the power system in Suðuroy with respective capacities and introduces abbreviations for the different components. VG G1-VG G4 are synchronous thermal generators, which are rated at 13.4 MW in total, the hydro turbines with synchronous generators, BO G1 and BO G2, are rated at 3 MW in total, the wind farm PO has 7 wind turbines rated at 6.3 MW in total and finally, there is a PV power plant of 260 kW. Installing a battery system of 7.5 MW/7.5 MWh (IH BS) and a synchronous condenser of 8 MVA (IH SC) is in progress as well. These are intended to provide ancillary services like active and reactive power reserves, inertia, and SCP to the system. The voltage levels in Suðuroy are 20 kV, 10 kV and for distribution 0.4 kV. The TG and IH and the substation/diesel power plant VG have a rated voltage of 20 kV. The rated voltage at the hydropower plant BO is 10 kV. The demand in Suðuroy has been described in the introduction.
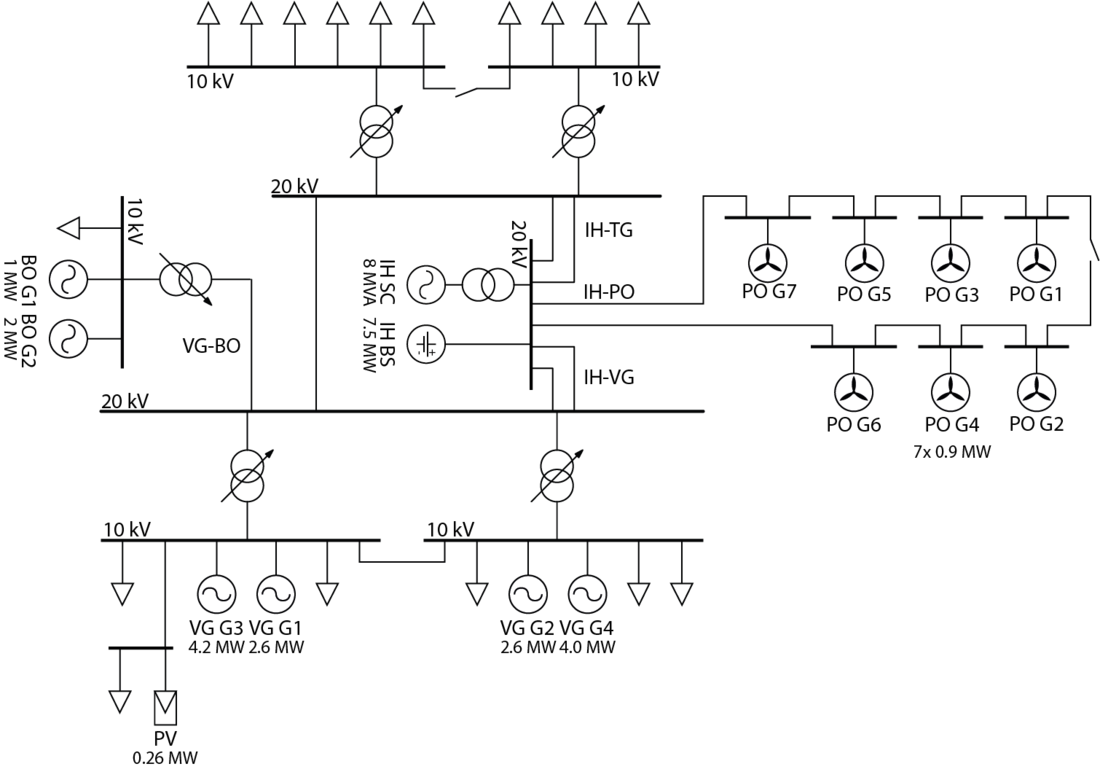
Figure 4 – Single line diagram of the power system in Suðuroy. BO is a hydropower plant, PO is a wind power plant, VG is a thermal power plant, while IH and TG are substations. “G” stands for generator, “SC” for synchronous condenser and “BS” for the battery system
Each synchronous generator has a governor and an automatic voltage regulator (AVR). Under normal operation, the frequency must be within 49.5 Hz and 50.5 Hz, and these limits are kept with droop primary control and manual secondary control. The installed wind turbines are the Enercon E44/900 kW model, which is a type 4 - full converter turbine. They have active and reactive power control capabilities and the option of inertia emulation. However, ever since the wind turbines were inaugurated in February 2021, they have been controlled using only active and reactive power setpoints from the dispatch centre. The PV plant is not controlled, due to its relatively small size. It, therefore, produces power according to the resource potential at any given moment with a power factor of 1.
2.1. Future Expansions According to RoadMap
The expansion steps in Suðuroy according to the RoadMap [20] are shown in Figure 5. There are expansions in wind power, PV power, a cable to the main grid and a second battery system (BESS) to balance the energy production on an hourly basis, i.e. this BESS is not intended for ancillary services as such, but more in terms of energy storage to lower the power exchange between Suðuroy and the main grid and the attributable losses. The focus of this study is the power system on Suðuroy, but according to the RoadMap, Suðuroy will be connected to the main grid through a 60 kV subsea cable in 2026. The cable will be connected to 20 kV at substation TG through a 60/20 kV transformer. Thus, the power composition in the main grid is relevant to this study from 2026 and forward. The main grid supplies 11 out of 18 islands. The generation capacity currently consists of 86 MW of heavy fuel oil and diesel power (synchronous), 2 MW of biogas (synchronous), 37 MW of hydropower (synchronous) and 18 MW of wind power (16 MW of type 4 and 2 MW of type 2 wind turbines). The future expansions in the main grid by 2026 and 2030 according to the RoadMap are tabulated in Table 1. These expansions consist of wind power, photovoltaics and a pumped storage system with synchronous turbines and pumps. Further details with regard to plant sizes and locations can be found in [20]. SEV also has preliminary plans with regards to investments of BESS and synchronous condensers (SC) in the main grid to provide active and reactive power reserves, inertia, and SCP to the system, just like the BESS and SC in Suðuroy. These plans include 3x16 MVA SC, 1x6 MVA SC and a BESS capacity of 30 MW in total, of which the first 12 MW BESS and 16 MVA SC are already procured. These components have been included in the simulations with the main grid.
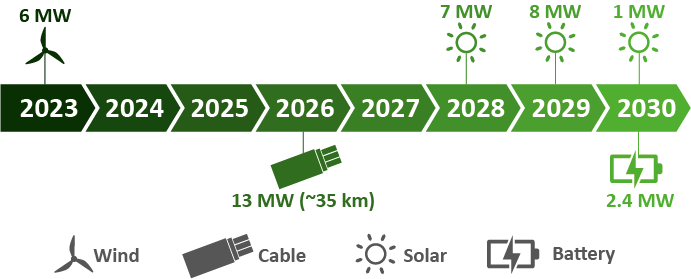
Figure 5 – Expansions in Suðuroy according to RoadMap [20]
| By 2026 | By 2030 |
|---|---|
72 MW WP | 66 MW WP |
35 MW HP | 39 MW HP |
41 MW PP | 38 MW PP |
| 40 MW PV |
3. Investigation Approach
The future short term voltage and frequency stability of Suðuroy to large disturbances [25] and the impact of the main grid representation have been analysed using RMS simulations in DIgSILENT's PowerFactory. Three different events are investigated under one operation scenario, see section 3.2., in the study cases of 2020, 2023, 2026 and 2030. Different representations of the main grid and some wind turbine capabilities have also been investigated. Additionally, the required BESS and SC sizes in the future to maintain the frequency and voltage stability in Suðuroy at the same levels as today have been addressed.
3.1. Modelling
The grid model uses a load flow and dynamically validated model. The load flow model has been validated by defining load, generation, tap changers and circuit breakers according to historic operation scenarios, and then simulated currents and busbar voltages have been compared to measurements. The governors and automatic voltage regulators (AVRs) have been parameterized and validated by tripping generators, measuring the dynamic response, and replicating the measurements in the simulation. Since models and parameters for multiple of these controllers were unavailable, standard models that fit with the actual regulators have been used. These were selected mainly based on [26], but also based on information in the available datasheets. These standard models have then been parameterized by minimizing the difference between simulated and measured primary responses from the controllers. The wind power plants are modelled with models from Enercon with site-specific parameters. The configuration of these models has been validated with the manufacturer. The future PV plants are modelled with IEC 61400-27-1 WT 4B 2.0 MW 50 Hz models with adjusted rated power. This model is commonly used for PV modelling in the industry. The synchronous condensers are modelled based on a model of the synchronous condenser in Suðuroy, delivered by ABB. The main grid already has a BESS which contributes to frequency regulation during disturbances, and this model (Enercon) has been used for the BESS in Suðuroy and expansions in the main grid. The main grid has been modelled with a full-size detailed model and using two reduced models, both utilizing the "External Grid.ElmXnet" component in PowerFactory. The "External Grid.ElmXnet" used in RMS simulations is basically a synchronous generator, neglecting saturation and leakage reactances. The SCP of the system to be reduced must be defined, and the default acceleration time constant is infinite. The transient and subtransient time constants and the synchronous and transient reactances can be defined, but in this study, default values have been used. In approximation 1 the external grid has been defined based on the SCP. This means that the inertia in approximation 1 is infinite. The difference between approximation 1 and 2, is that the inertia of the main grid is specified in approximation 2. The inertia in the main grid has been calculated based on the units online during the simulation. An overview of the models used can be found in Table 2.
| Components | Model |
|---|---|
Synchronous generation | Standard governor and AVR models, which have been parameterised and validated according to measurements. |
Wind power | Wind turbine models and farm control unit models from the Enercon. Parameterised with actual parameters and validated in cooperation with Enercon. |
Existing PV | Modelled as a negative load with set production. |
Future PV | IEC 61400-27-1 WT 4B 2.0 MW 50 Hz model, which is commonly used for PV in industry. |
Synchronous condenser | Model and parameters from the manufacturer ABB |
Battery system (ancillary) | Modelled using an Enercon model for the battery system in the main grid, which has similar capabilities. The model has been parameterised with the actual parameters in the main grid. |
Battery system (2030) | Modelled as a load which charges with positive values and discharges with negative values. |
Main grid detailed model | Full system model using models as described above. |
Main grid approximation 1 | "External grid" component in PowerFactory, considering only the short circuit power. |
Main grid approximation 2 | "External grid" component in PowerFactory, considering the short circuit power and inertia. |
3.2. Operation Scenario
The previously discussed RoadMap [20] has been obtained based on an economic optimisation in the open-source model Balmorel [27]. Balmorel optimises the hourly dispatch as well, thus the generation and load settings for the investigated events have been extracted from the optimisation for the years investigated (2020, 2023, 2026 and 2030). The operation scenario, i.e., the specific hour investigated, has been selected based on hourly input data (2017) and output (2020, 2023, 2026 and 2030) data in the RoadMap study. First, the demand, wind speed and irradiation data (2017 input) were sorted based on the following criteria:
- High load, i.e., ≥4.5 MW
- Wind speeds at the wind farm in Suðuroy are equal to or above average, i.e., 9.5 m/s
- Irradiation in Suðuroy equal to or above average (night hours excluded), i.e., 201 W/m2
41 hours of the input data from 2017 fit all requirements. To choose one of these 41 hours, the optimised dispatch (2020, 2023, 2026 and 2030) according to the output data in [20] was used to sort the hours, with the following criteria:
- IBR shares should be equal to or less than 60% in 2020 and 80% in 2023. No criteria for IBR shares in 2026 and 2030, due to the system being connected to the main grid.
- The diesel power plant should supply at least 20% in 2020, to ensure that the diesel engines are loaded above the minimum.
- The shares of PV should be equal to or lower than 25%. Higher shares than this will not be common due to the northern latitude, cloudy climate, and installed capacity.
- Imports from the main grid should not supply over 40% of the demand in Suðuroy so that the analysis includes a significant amount of local production.
Only one of the 41 hours fits all criteria, and that is 12:00 on the 28th of March based on the input data. The production and import shares according to the optimised dispatch [20] are tabulated in Table 3. To be able to compare different years, it is important that the production composition is similar. The wind and PV dispatch according to Balmorel have been left unchanged, but the synchronous generation has been adjusted, so the hydro turbines in Suðuroy produce a total of 1.8 MW every investigated year. In 2020 the 1.8 MW are extracted from the thermal generation, while in 2026 and 2030, the generation is moved from hydro turbines in the main grid to Suðuroy, thus, the import is decreased as well. The thermal generation in 2020 and 2023 is produced by VG G1 and VG G2.
The production in the main grid in 2026 and 2030 according to Balmorel consists of 3 hydropower plants, the biogas plant, wind power plants and PV (2030 only). Excess wind power is also being pumped during the investigated operation scenario, this pumping power has been divided between 3 and 4 pumps in 2026 and 2030, respectively.
| 2020 | 2023 | 2026 | 2030 | |
|---|---|---|---|---|
Diesel | 42% | 15% | 0% | - |
Hydro | 0% | 15% | 0% | 0% |
Wind | 58% | 70% | 66% | 60% |
Import | - | - | 35% | 18% |
PV | - | - | - | 23% |
The loads, tap changers, circuit breakers etc. for the simulations in PowerFactory, have been set based on SCADA measurements from 12:00 on the 28th of March 2017 (the input data year) has been used. The loads have been scaled up to reflect the projected demand in 2020, 2023, 2026 and 2030. This is done to ensure a realistic load division between different substations. In cases where the voltage has been too high or low in future scenarios, the tap changers have been modified accordingly.
3.3. Events and Study Cases
Three events are investigated in this study, as listed following this paragraph. The first one is an outage of one of the hydro turbines, the second is a sudden loss of wind power production and finally a load rejection where a fish factory is disconnected. These three events have all been selected based on events which are considered alarming. The events are analysed for the study cases of 2020, 2023, 2026 and 2030. Additional simulations have been conducted to analyse the impact of the main grid representation and the contribution from the wind turbines' inertia emulation.
- BO G1 tripping: In the future BO G1 and BO G2 will be the only synchronous generators in Suðuroy, therefore tripping one of these is interesting to investigate. In percentage of the total generation, this trip corresponds to 24% in 2020, 15% in 2023, 2% in 2026 (18% of production in Suðuroy) and 2% in 2030 (14% of production in Suðuroy).
- Additional simulations (2020 w/o BESS): With and without inertia emulation from the wind turbines in Suðuroy.
- Sudden loss of wind power: Wind speeds often change suddenly, which can lead to a sudden loss of wind power. Therefore, this scenario where the wind power changes from 0.7 to 0.0 p.u. in 17 seconds has been investigated. In percentage of the total generation, this reduction corresponds to 58% in 2020, 70% in 2023, 10% in 2026 (82% of production in Suðuroy) and 8% in 2030 (63% of production in Suðuroy).
- Additional simulations (2026): The main grid is represented by approximations 1 and 2
- Load rejection: This load rejection corresponds to the disconnection of a fish factory. As it is 18% of the total demand in Suðuroy, this load rejection can lead to power system instabilities.
3.4. Sizing Additional BESS and SC
The results of some of the scenarios showed a need for additional ancillary services, and there are many methods to provide ancillary services. An SC can provide inertia, SCP, and reactive power regulation to the system, while a BESS can provide active power regulation to support the frequency. To maintain the stability level in this study, it was decided to increase the SC and BESS capacities. The design criteria for sizing BESS and SC for future scenarios was that the responses should not be worse than in the base case, i.e., 2020. The validity of this design criterion set can be discussed, but this simple approach gives a good indication of the required size to maintain the dynamic stability at the same level as in the present system. The BESS has been increased by one BESS size at a time (2.3 MW) until the issues have been resolved. The SC was increased with 2 MVA intervals.
When a larger BESS or SC is needed in 2023 for one event, this additional capacity has been included in other 2023 events and all events in 2026 and 2030.
4. Results and Discussion
The dynamic frequency and voltage responses to the study case, i.e., outage of one of the hydro turbines, are shown in Figure 6 for 2020, 2023, 2026 and 2030. The frequency in the base case, i.e., 2020, drops quite significantly but stabilises at 49.8 Hz, which is when the batteries react to the sudden frequency deviation. The frequency response in 2023 is close to identical to the base case because the only change between the two scenarios is an increase in the demand, which is covered by additional wind power production. The thermal generation is also lower, but the same units are online. Thus, the inertia of the system is the same and so is the production from the hydro turbine. The rate of change of frequency (ROCOF) decreases from 370 mHz/s to 35-40 mHz/s when Suðuroy is connected to the main grid, which was expected as the magnitude of the ROCOF is inversely proportional to system inertia, which increases when the two systems are interconnected. In 2026 the thermal generators in Suðuroy are not in operation, and the inertia provided by local apparatus in Suðuroy is, therefore, lower. This shows that the inertia of the hydro turbines, pumps and synchronous condensers in the main grid contribute quite significantly to stabilising the grid in Suðuroy in 2026, which is why a correct representation of the external grid is significant to obtain accurate results. The frequency nadir in all years is around 49.8, due to the battery system, but the time of the nadir varies from year to year due to the ROCOF. The difference between 2026 and 2030 is very limited. The ROCOF is slightly higher in 2030, and the frequency reaches 49.8 Hz, which triggers the BESS to react. The threshold has been set according to the current configuration of the BESS in the main grid. The voltage (VG 20 kV in Figure 4) is not initialised at the same magnitude for the investigated years, but overall, the disturbance in the voltage is relatively small and does not worsen from the base case to 2030. The behaviour is different depending on if the main grid is connected or not, i.e. different patterns are seen in the voltage for 2020/2023 and 2026/2030. No additional ancillary services need to be installed, to ensure grid stability in Suðuroy after an outage of BO G1 with this specific operation scenario and configuration, as the frequency and voltage responses are considered acceptable.
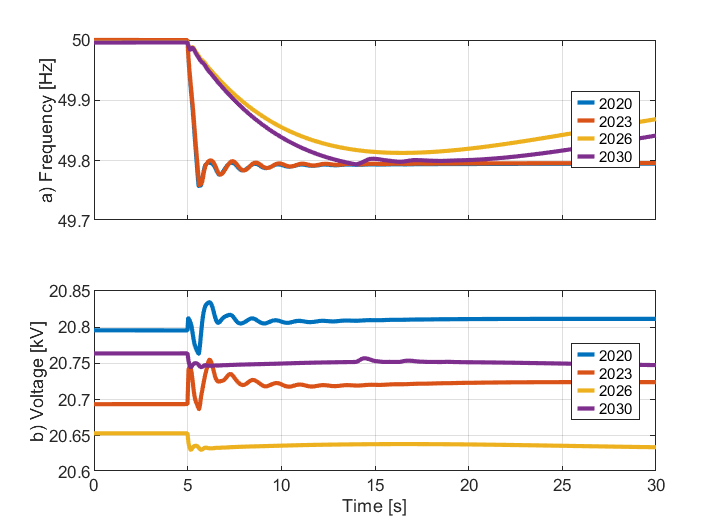
Figure 6 – Frequency and voltage response to the outage of BO G1 during different years
A sudden drop in wind power production will also have a negative impact on the frequency and voltage stability, see Figure 7. In 2020 the grid is stabilised after the event at 49.7 Hz, but there are some issues with the frequency and voltage in 2023 when the frequency hits 49.6 Hz. An investigation of the data shows that the two frequency drops and voltage peaks after 15 seconds are caused by the wind turbine controllers, as these issues are not seen with the wind turbines’ dynamic controllers deactivated. Tuning the wind turbines' controllers could resolve this, but in this study, the controllers are parameterized according to the actual settings at the existing wind farm. If an additional BESS package (2.3 MW) is installed, the frequency can stay above 49.6 Hz, and a response very similar to the base is obtained, see "2023-1" on the figure. Similarly, to the first study case, there are no issues with the frequency in 2026 and 2030 due to the ancillary services received from the main grid. The voltage drop is however larger in 2026 and 2030 than in previous years, due to the import from the main grid, but the drop is not large enough to lead to additional investments in ancillary services. These results, therefore, show that in order to ensure frequency stabilisation after the event of sudden wind power production loss in Suðuroy, additional active power regulation capabilities, e.g. a larger size of BESS, are required. Additionally, the results show the importance of investigating the system step by step, and not only the current state and final state, e.g., 2020 and 2030, as expansions in between might lead to some instabilities, even though the final system configuration does not.
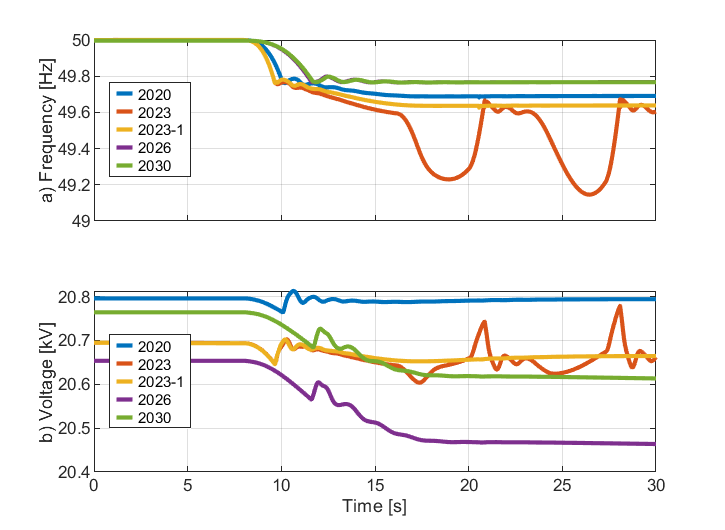
Figure 7 – Frequency and voltage response to wind power production in Suðuroy drop from 0.7 p.u. to 0.0 p.u. within 17 seconds during different years
The final event investigated in this study is the load rejection, see Figure 8. In the simulations representing 2020, the system has a high ROCOF but stabilises at 50.2 Hz, which is when the battery starts charging. In 2023 the demand has increased, and all loads have been increased proportionally, meaning that the power deficit is higher in 2023 than in 2020. The simulation results show that this higher load rejection leads to oscillations in both the frequency and the voltage. This issue can be avoided e.g., by increasing the SC from 8 MVA to 12 MVA. The "2023-2" lines in the figure show frequency and voltage responses like 2020, and have been obtained from simulations with the additional BESS package from event two and a 12 MVA SC. The main grid again contributes enough to the stability in Suðuroy in 2026 and 2030, to avoid any additional investments in ancillary services in Suðuroy based on the system configuration in this study.
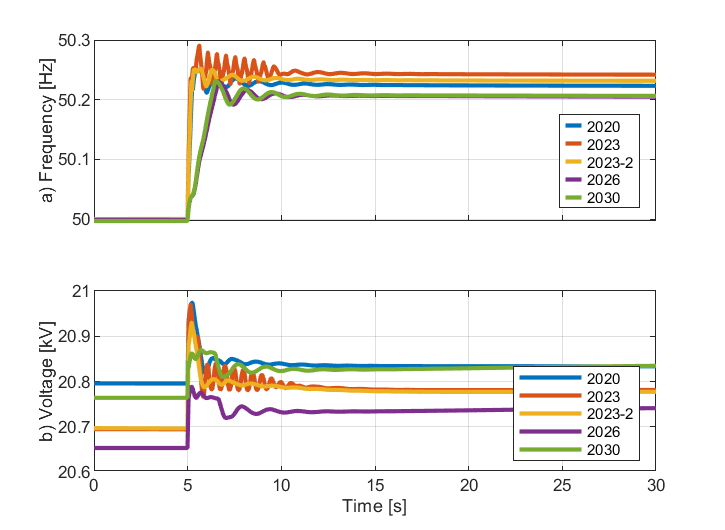
Figure 8 – Frequency and voltage response to the load rejection during different years
Overall, it can be said that to ensure the stability in Suðuroy before the cable connection to the main grid, it will be necessary to make changes to the system, e.g., investing in 4 MVA additional synchronous condenser and 2.3 MW additional battery power. The frequency and voltage stability on Suðuroy will benefit from the connection to the main grid.
4.1. Representation of the Main Grid
The main grid has in previously shown simulations been represented by a detailed model, since the simulated frequency and voltage with approximated models did not accurately replicate the detailed model. Figure 9 shows simulation results using different methods to represent the main grid during the second event, a sudden drop in wind power production, in 2026. In approximation 1 - considering SCP but infinite inertia - the frequency is at 50 Hz during the whole simulation, while the detailed model shows a frequency drop. The voltage response using approximation 1, described in Table 2, is quite similar to the detailed model. Using approximation 2, the frequency response is closer to the detailed modelled, while the voltage response deviates more. The voltage drop is lower using approximation 2 because the power flow from the main grid is lower. The significant amount of power imported from the main grid is the cause of the high voltage drop in the detailed model and approximation 1. In fact, up to 12 seconds, the frequency response is close to identical to the detailed model. Plot c) on Figure 9 explains the reason behind the differences from 12 seconds and forward. In the detailed model both the BESS in Suðuroy and the BESS in the main grid are injecting active power at 12 s to stabilise the frequency in Suðuroy, but the active power regulation contribution from the BESS in the main grid cannot be captured by the approximation, thus this approximation is quite accurate regarding the frequency response as long as the frequency remains within 49.8 and 50.2 Hz, but can not be used as an accurate representation, for events which will trigger the BESS or other technologies which are frequency triggered. This indicates that when inverter-based sources, e.g., BESS, are used to contribute to frequency and voltage regulation, using the approximated models shown here is not sufficient. The inverter-based sources like e.g., BESS have to be included in the approximation, e.g. using triggered behaviours, or a detailed model has to be used. This finding is not only valid for the Faroese power system or isolated power systems, but for all systems that include frequency triggered technologies, and are being approximated to simplify simulations and reduce computational time.
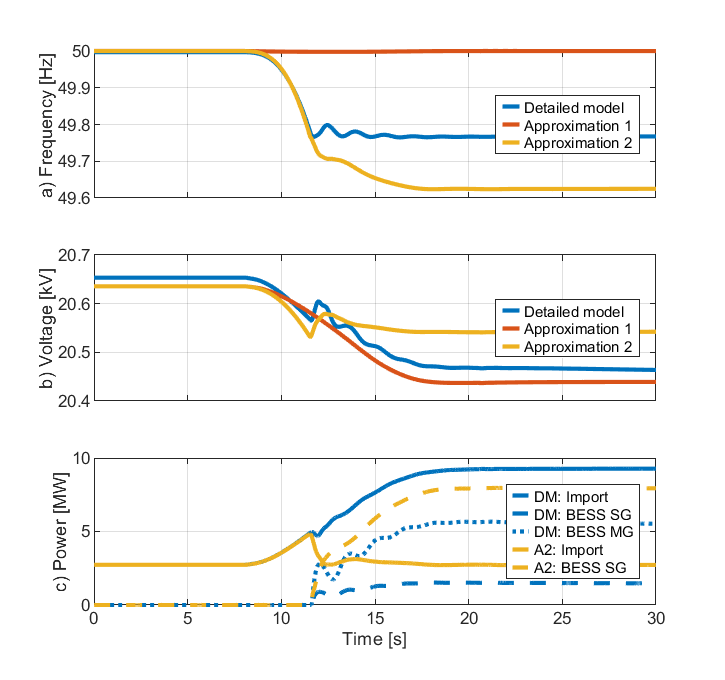
Figure 9 – Comparison of the dynamic response in Suðuroy using different modelling approaches of the main grid. Plot a) shows the frequency response and plot b) the voltage at VG 20 kV. Plot c) shows the import from the main grid (MG) to the Suðuroy grid (SG) and the power output from BESS using the detailed model (DM) and approximation 2 (A2) of the main grid. The specific scenario is a sudden loss of wind power in 2026
4.2. Inertia Emulation from Wind Turbines
The final simulation results included in this paper show the impact of activating inertia emulation (IE) from the wind turbines in Suðuroy. These simulations have been conducted without the BESS in Suðuroy because the BESS reacts as the frequency reaches 49.8 Hz, and the default IE settings are set to react at 49.5 Hz, which means that with the BESS online, the IE would not be activated, aside from events that can not be saved by the BESS, which are very unlikely on Suðuroy, as the BESS is similar in size to high load and larger than the existing wind farm. However, the frequency and voltage response to the outage of BO G1 in the base case, without the BESS and with IE, is shown in Figure 10. The initial frequency and voltage responses are similar to 2020 simulations in Figure 6, and the ROCOF is the same, but since the batteries are deactivated, the frequency nadir reaches 49.4 Hz and 49.3 Hz with and without IE activated, compared to 49.8 with the battery activated. The grid frequency would benefit from activating IE, as the frequency nadir is higher, and the overshoot is decreased. The voltage is also impacted by this, as the overshoot increases, but the voltage deviations are relatively small.
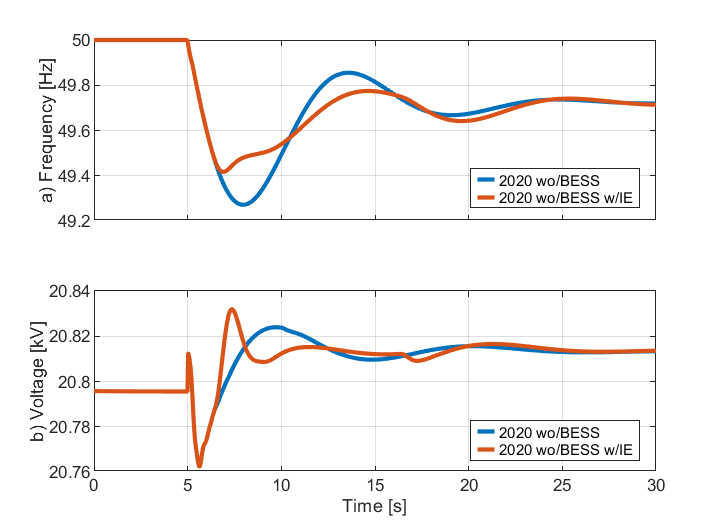
Figure 10 – Comparison of the frequency and voltage responses with and without inertia emulation from the wind turbines in Suðuroy. The specific scenario is a sudden outage of BO G1 in the base case without the BESS
4.3. Discussion
Obtaining stability after the events investigated in this study will require additional investments in ancillary services already in 2023. In 2026, when the grid of Suðuroy is connected to the significantly larger main grid, stabilising the grid is not as challenging as in the isolated grid. The reason is that the severity of the events is proportionally decreased, as they are relatively small compared to the size and strength of the main grid. Aside from assessing the stability, the results also show some interesting findings concerning expansions and network representation.
In study case 2 it was shown that maintaining a stable frequency becomes an issue in 2023, but this issue disappears when the Suðuroy is connected to the main grid. It is therefore important to simulate and analyse all expansion steps in the transition towards 100% renewables, and not only the initial and final stage of the system. Expansions in photovoltaic power are conducted in Suðuroy in 2028 and 2029, according to the RoadMap. These years should therefore also be investigated, and since the main grid has a significant impact on the stability in Suðuroy when interconnected, these steps should also be investigated.
Representing a network with an approximated model for dynamic simulations accurately has been shown to be challenging, as neither of the two approximations showed an accurate representation of a detailed model. The main reason is that there is a BESS located in the main grid, which is frequency triggered, i.e., it reacts to frequency changes when the frequency reaches 49.8 Hz or 50.2 Hz. If an approximated model is used to represent the main grid, it must be expanded with triggered frequency control, to represent the BESS or other frequency triggered technologies. Without this, the approximated models simply will not show an accurate dynamic response, and this is not a site-specific issue, i.e., it is not only an issue for the Faroese power system, but all power systems with frequency triggered technologies. The significance of this inaccuracy does however also depend on the power injected (proportional to the system) and the location.
5. Conclusion
This study has shown the impact different disturbances have on the isolated power system of Suðuroy. For the events, operation scenarios and cases studied, it can be concluded that additional ancillary services will be needed to maintain the voltage and frequency stability in 2023 at the same level as today, e.g., an additional investment of 4 MVA SC and 2.3 MW BESS. When the system is connected to the main grid, the analysed disturbances are relatively smaller, and no further expansions of BESS and SC in Suðuroy are required according to the simulation results in this study. However, the preliminary plans of installing 3x16 MVA and 1x6 MVA SC and 30 MW BESS on the main grid have been included in the investigation, and as shown the BESS in the main grid has a high impact on the frequency regulation in Suðuroy, and the inertia has also been shown to be significantly higher (lower ROCOF) in the whole system (2026/2030), than in Suðuroy in 2020/2023.
Analysing parts of systems, without including a detailed model of the whole system, will not lead to accurate results as the share of inverter-based technologies increases. In this paper, simulations have shown that as soon as the BESS contributes to frequency regulation, a typical approximation model deviates significantly from a detailed model. As synchronous generators are removed from the grid, the BESS capacity, and other alternative methods to provide ancillary services will increase, which makes it challenging to use traditional approximation models.
There are many options with the inverter-based generation, and this paper has shown that inertia emulation from the wind turbines can improve the frequency response, but the benefit is limited when BESS are present in systems. The contribution from the IE can however be increased if the thresholds of IE and BESS are well coordinated.
5.1. Future Works
To get a better understanding of the future frequency and voltage stability and needed future expansions in ancillary services, more operation scenarios should be investigated, as in this study only one operation scenario has been investigated. Other events, e.g., short circuits, should also be investigated. The grid of Suðuroy should also be investigated whilst assuming an outage of the subsea cable from 2026 and forward, which would mean that the ancillary services must be provided locally and not from the main grid.
This study focuses on Suðuroy, which is around 10 times smaller than the main grid. Thus, when connected to the main grid, the severity of large disturbances (relative to the Suðuroy grid), decreases significantly. When connected to the main grid, the grid on Suðuroy will notice much larger disturbances (on the main grid), and the impact of these on Suðuroy should be investigated.
References
- M. G. Schug, A. Gottlieb, and J. DeLoache, ‘“Equal Children Play Best”: Raising Independent Children in a Nordic Welfare State’, in A World of Babies, Cambridge: Cambridge University Press, 2016, pp. 261–292.
- D. Weisser and R. S. Garcia, ‘Instantaneous wind energy penetration in isolated electricity grids: Concepts and review’, Renew. Energy, vol. 30, no. 8, pp. 1299–1308, 2005, doi: 10.1016/j.renene.2004.10.002.
- O. Erdinc, N. G. Paterakis, and J. P. S. Catalaõ, ‘Overview of insular power systems under increasing penetration of renewable energy sources: Opportunities and challenges’, Renew. Sustain. Energy Rev., vol. 52, pp. 333–346, 2015, doi: 10.1016/j.rser.2015.07.104.
- Y. Tan, L. Meegahapola, and K. M. Muttaqi, ‘A review of technical challenges in planning and operation of remote area power supply systems’, Renew. Sustain. Energy Rev., vol. 38, pp. 876–889, 2014, doi: 10.1016/j.rser.2014.07.034.
- T. R. Ayodele, A. A. Jimoh, J. L. Munda, and J. T. Agee, ‘Challenges of Grid Integration of Wind Power on Power System Grid Integrity: A Review’, Int. J. Renew. ENERGY Res., vol. 2, no. 4, 2012.
- R. Shah, N. Mithulananthan, R. C. Bansal, and V. K. Ramachandaramurthy, ‘A review of key power system stability challenges for large-scale PV integration’, Renew. Sustain. Energy Rev., vol. 41, pp. 1423–1436, 2015, doi: 10.1016/j.rser.2014.09.027.
- G. Pepermans, J. Driesen, D. Haeseldonckx, R. Belmans, and W. D’haeseleer, ‘Distributed generation: Definition, benefits and issues’, Energy Policy, vol. 33, no. 6, pp. 787–798, 2005, doi: 10.1016/j.enpol.2003.10.004.
- Dansk Energi, ‘Teknisk notat - Stabilitet og udbygning af elnettet’. Dansk Energi, Copenhagen, Denmark, 2017.
- H. M. Tróndheim, J. R. Pillai, T. Nielsen, C. L. Bak, and B. A. Niclasen, ‘Frequency Regulation in an Isolated Grid with a High Penetration of Renewables - the Faroe Islands’, in CIGRE e-Session 2020, 2020.
- H. M. Tróndheim et al., ‘Frequency and Voltage Analysis of the Hybrid Power System in Suðuroy, Faroe Islands’, in Proceedings of Virtual 5th International Hybrid Power Systems Workshop, 2021.
- H. M. Tróndheim, ‘A Battery System Utilized for Ancillary Services - the Faroe Islands’. 2018.
- H. M. Tróndheim, ‘Aggregation and Control of Flexible Thermal Demand for Wind Power Based Power System Analysis’, Aalborg, Denmark, 2018.
- S. Østerfelt and J. Hansen, ‘Transient stabilitet i elnet drevet af vedvaren- de energikilder’, 2021.
- H. M. Tróndheim, T. Nielsen, B. A. Niclasen, C. L. Bak, and F. F. Da Silva, ‘The Least-Cost Path to a 100 % Renewable Electricity Sector in the Faroe Islands’, in Proceedings of 4th International Hybrid Power Systems Workshop, 2019.
- H. M. Tróndheim, B. A. Niclasen, T. Nielsen, C. L. Bak, and F. F. Da Silva, ‘Introduction to the Energy Mixture in an Isolated Grid with 100% Renewable Electricity - the Faroe Islands’, in Proceedings of CIGRE Symposium Aalborg 2019, 2019, pp. 1–12.
- Norconsult AS, ‘100% fornybar kraft, Pumpekraft, vind og sol’, Sandvika, Norway, 2018.
- Ea Energy Analyse, ‘Balancing a 100% renewable electricity system - Least cost path for the Faroe Islands’, Copenhagen, Denmark, 2018.
- D. Al Katsaprakakis, B. Thomsen, I. Dakanali, and K. Tzirakis, ‘Faroe Islands: Towards 100% R.E.S. penetration’, Renew. Energy, vol. 135, no. 2019, pp. 473–484, 2019, doi: 10.1016/j.renene.2018.12.042.
- A. M. Skeibrok, M. Eriksen, and J. Stav, ‘Optimized hybrid microgrid system integrated with renewable energy sources’. 2019.
- H. M. Tróndheim, B. A. Niclasen, T. Nielsen, F. F. Da Silva, and C. L. Bak, ‘100% Sustainable Electricity in the Faroe Islands: Expansion Planning Through Economic Optimization’, IEEE Open Access J. Power Energy, vol. 8, pp. 23–34, 2021, doi: 10.1109/OAJPE.2021.3051917.
- L. Wang, M. Klein, S. Yirga, and P. Kundur, ‘Dynamic reduction of large power sytems for stability studies’, IEEE Trans. Power Syst., vol. 12, no. 2, pp. 889–895, 1997.
- A. Ishchenko, A. Jokic, J. M. A. Myrzik, and W. L. Kling, ‘Dynamic reduction of distribution networks with dispersed generation’, in 2005 International Conference on Future Power Systems, 2005, pp. 7 pp. – 7, doi: 10.1109/FPS.2005.204320.
- N. Tong et al., ‘Dynamic Equivalence of Large-Scale Power Systems Based on Boundary Measurements’, in 2020 American Control Conference (ACC), 2020, pp. 3164–3169, doi: 10.23919/ACC45564.2020.9147425.
- DIgSILENT, PowerFactory 2020 User Manual. 2020.
- P. Kundur et al., ‘Definition and Classification of Power System Stability’, IEEE Trans. Power Syst., vol. 19, no. 3, pp. 1387–1401, 2004, doi: 10.1109/tpwrs.2004.825981.
- IEEE, ‘IEEE Recommended Practice for Excitation System Models for Power System Stability Studies’, IEEE Std 421.5-2016 (Revision IEEE Std 421.5-2005), pp. 1–207, 2016, doi: 10.1109/IEEESTD.2016.7553421.
- H. Ravn, ‘The Balmorel Model Structure’, vol. 02, no. 2.12 Alpha, p. 96, 2005.