A Dynamic Adjustment Method of Voltage Reference Value and Dead Band Width for Advanced Voltage Control in Power Systems
Authors
K. HIDEO - Yokohama National University & Central Research Institute of Electric Power Industry, Japan
T. TAKAO - Yokohama National University, Japan

Summary
range in power systems. The voltage in an Extra High Voltage (EHV) system has been supported by using voltage controllers (Synchronous Generator (SG), Shunt Reactor (Shunt), Static Condenser (SC), On Load Tap Changer (OLTC), etc.). The introduction of Distributed Energy Resources (DER) is currently increasing rapidly, and the number of conventional SGs in service that have supported voltage in power systems decreased. As the number of SGs decreases, the short circuit capacity of a substation (S/S) nearby these SGs decreases, and the voltage is more likely to fluctuate due to the increased voltage sensitivity to power flow. In power systems with more DER integration, DER output changes may cause further voltage fluctuation. So, it is necessary to prepare for the risk of voltage fluctuation at the location where the voltage maintenance capacity has been reduced, defined as "weak location" in this paper.
This paper proposes a centralized voltage control that realizes two measures to enhance the voltage maintenance capability for the conventional voltage controllers. The first measure is to dynamically set the voltage schedule value (Vsched) for the Optimal Power Flow (OPF), which makes the voltage reference value (Vref) for each voltage controller. Specifically, the proposed method forecasts the voltage at S/S of the weak location based on the past voltage profile and the forecasted load and DER output. Vsched is set to recover the voltage to the center of the operating range based on the droop characteristics for the forecasted voltage. The OPF controller receives Vsched and calculates Vref by considering the objective function that minimizes the deviation from Vsched. In this way, the proposed method will achieve both the conventional economic operation and effective voltage maintenance.
The second measure is to dynamically set the voltage controller's dead band (DB) width at the S/S of the weak location. Generally, the voltage at the S/S is managed by considering the fixed DB width (Vref ± DB). There are various reasons, such as the discrete control values of SC and OLTC and to avoid unnecessary operation for voltage fluctuations during normal operation. On the other hand, as the S/S becomes more digitalized, properly setting the DB width in real-time is expected to make the voltage distribution closer to Vref. It is useful to prepare for both voltages rise and drop. This paper proposes to update the DB width based on the forecasted stepsize of the voltage control when Shunt/SC or OLTC operate.
The effect of the proposed controller in combination with the OPF controller and voltage controller at the S/S is verified by numerical voltage simulation using the developed simulation software for the IEE Japan 10-machine system modeling an EHV system.
Keywords
Voltage Control - Voltage Fluctuation - Sensitivity - Optimal Power Flow - Dead Band1. Introduction
In the EHV system with higher voltage classes, voltage management has been performed using voltage control devices such as SG, Shunt/SC, and OLTC to maintain the voltage in normal conditions. These voltage control methods are classified into Primary Voltage Regulation (PVR), which actually controls the device according to the voltage conditions at the monitoring points, and Secondary and Tertiary Voltage Regulation (SVR and TVR), which set Vref and state value of these controllers. The PVR and SVR are controlled in a hierarchical structure to achieve efficient voltage operation in Ref [1],[2],[3]. The introduction of DER is currently increasing rapidly, and the number of conventional SGs in service that has supported voltage in power systems will decrease. In the future, it will be necessary to realize more flexible voltage management, considering that the voltage maintenance function of SGs will be reduced.
Fig.1 shows the issues on the voltage aspect under normal conditions, assuming supply and demand situations in the future. With the increasing introduction of DER, there will be a change in the operation of SGs in EHV systems, and the number of SGs in service will decrease. As a result, the short circuit capacity of the EHV system will be locally lower, and the reactive power supplied by the SG will be reduced. Therefore, more efficient voltage control will be required for existing generation and transmission facilities. Specifically, an effective strategy is to make an optimal voltage profile while considering the DER output and the system conditions or to increase the reactive power resources for voltage control (Task 1).
On the other hand, DER connects to the Sub-Transmission (ST) system with lower voltage classes than the EHV system. As the installed capacity of DER increases, power flow fluctuations and reactive power losses increase. As a result, voltage fluctuation and voltage levels will change. Under the ST system, it is considered that new resources such as DER and the battery can be utilized for voltage control (Task 2). Since these system conditions occur together and mutually affect each condition, it is necessary to coordinate voltage management for the whole system (Task 3).
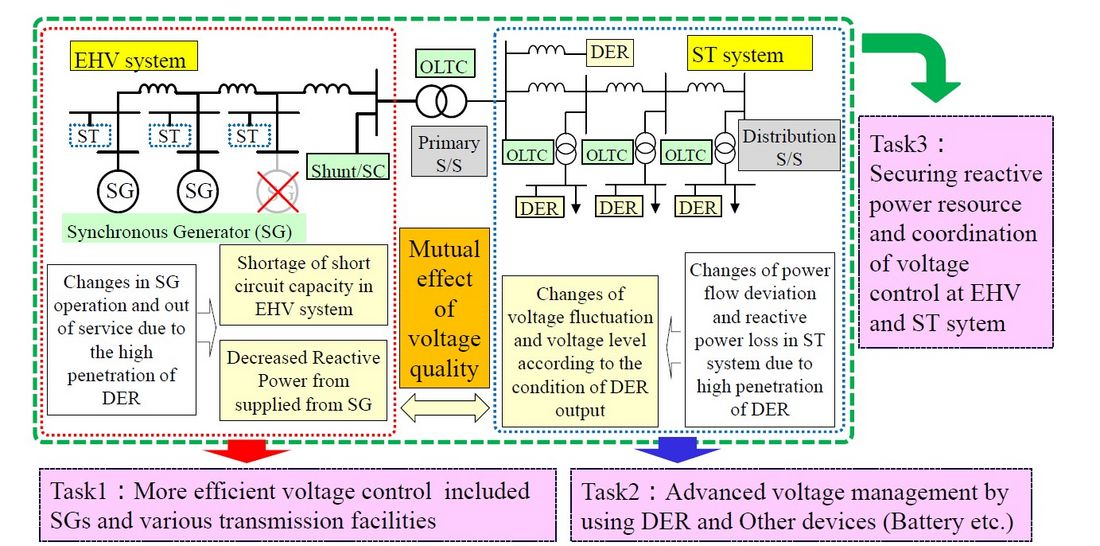
Figure 1 - The Voltage management issues at normal condition in Ref [4]
This paper focuses on Task 1 and proposes an advanced voltage control method to support the voltage maintenance function for the EHV system. The proposed control method aims to achieve the following three functions.
- The function evaluates the voltage maintenance capability at each S/S based on voltage sensitivity. In this way, a weak location will be selected from the EHV system
- The function sets the voltage schedule value (Vsched) to enhance the voltage maintenance for the weak location identified above. In the optimal power flow (OPF), the voltage reference value (Vref) is generated dynamically. In the weak locations, Vref is set considering the auxiliary signal of Vsched generated externally. In this way, Vref is generated with both economic operation and voltage maintenance.
- The function enhances the voltage maintenance capability by dynamically adjusting the dead band (DB) for the weak location. This function analyzes the voltage change during the operation of the PVR at each S/S and assigns the amount of voltage change as the DB width so that the voltage can easily track Vref when the voltage exceeds the control range.
The effect of the proposed controller in combination with the OPF controller and PVR at the S/S is verified by numerical voltage simulation.
2. Proposal
2.1. Overview of the proposed voltage control system
Fig.2 shows the proposed voltage control. In the proposed system, SGs, SCs, and OLTCs are treated as devices of PVR (No.5). These devices control the terminal voltage, SC capacity, and tap position depending on the monitoring voltage condition.
The proposed SVR consists of one monitoring and three control systems. A conventional SVR system is assumed to be a centralized voltage controller (No.4) using the OPF technique. This controller generates Vref for the PVR. The proposed monitoring system observes the strength and weakness of each S/S based on the voltage maintenance capability (No.1). Two voltage supporting controls are applied for the weak location in the proposed control system. One control (No.2) is to generate Vsched for the weak location sequentially. The policy for generating Vsched is to keep the voltage within the operational range. Vsched is generated based on the droop characteristic for the forecasted voltage. The other (No.3) is to sequentially generate the DB width of PVR for the weak location. The policy for setting the DB is to realize Vref by operating the PVR devices immediately when the voltage at the monitoring point exceeds the control range (Vref ± DB). The following sections explain the details of each controller.
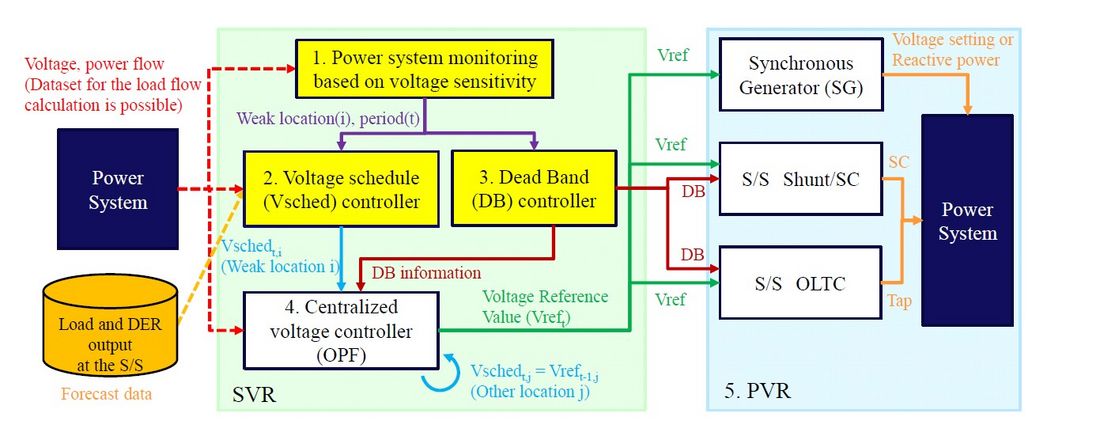
Figure 2 - Overview of the proposed voltage control system
2.2. Monitoring of the weak location based on voltage sensitivity
The short circuit capacity decreases in the nearby S/S when the SG is out of service. As a result, the voltage sensitivity to power flow increases, and the voltage is more likely to fluctuate. In this proposal, the weak location is selected based on the voltage sensitivity of the primary node of the S/S. The voltage sensitivity can be calculated based on the Jacobian matrix as shown in the following equations (1), (2) in Ref [5]. The voltage sensitivity is converted into the voltage change value when SC in S/S will operate by a unit capacity and compared with the threshold of voltage change.
(1)
(2)
where,
Δ?, Δ?:deviation vector of active and reactive power injected to the node
Δ?, Δ?:deviation vector of angle and magnitude of the voltage of the node
: Jacobian matrices for the active and reactive power of the node
??/??:voltage sensitivity matrix
2.3. Making the voltage schedule value (Vsched)
This section explains how to set up Vsched for the weak location. Fig. 3 shows the proposed control logic. This control aims to generate the auxiliary schedule values sequentially to enhance voltage maintenance in S/S with large voltage fluctuations. In OPF, classified as SVR, Vref is generated based on the overall strategy. So it is difficult to generate Vref with enhanced voltage maintenance capability only at specific locations. Therefore, this controller generates Vsched at the only location where the voltage maintenance wants to enhance outside the OPF. The OPF also minimizes the amount of voltage deviation from Vsched. This way, both overall economic operation and local voltage maintenance will be achieved.
The proposed method forecasts the voltage based on two estimation factors. One is estimating the current voltage based on the voltage in the past. This part detects the continuous voltage rise and drop by applying a moving average to the measured data during the OPF cycle. The other is to estimate the future voltage change. This part forecasts the sudden voltage change based on the active power deviation between the current demand and the forecasted demand in the S/S and the voltage sensitivity for active power. This controller estimates the forecasted voltage (Vforecasted) for the next OPF control cycle by adding these two factors together.
Vsched is generated by considering the droop characteristics for Vforcasted with the center value of the voltage operating range as a reference. If Vforecasted is higher (lower) than the median, Vsched is set lower (higher) so as to keep the voltage at the center of the operating range.
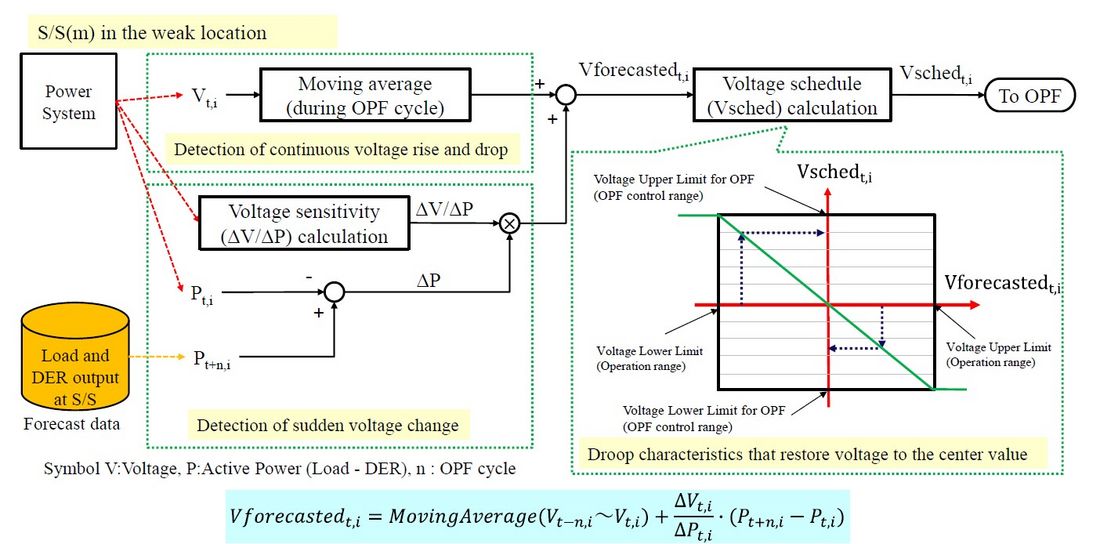
Figure 3 - The logic of voltage schedule (Vsched) controller
2.4. Making the dead band (DB) width
This section explains how to set up the DB for the weak location. The voltage of PVR is managed based on the following equation (3). Although OPF sets Vref for PVR, the voltage in the S/S is controlled by considering the DB to Vref. So, when the voltage fluctuation occurs in the high-level or low-level voltage conditions, the control delay occurs according to the margin of DB, and the voltage may exceed the operating range. The proposed control aims to improve the tracking performance for Vref by adjusting the DB at the weak location.
(3)
Fig. 4 shows the proposed control logic. This controller estimates the maximum value of the voltage change (ΔVcalc) at the monitoring point when the PVR at the weak location operates by a unit amount (unit capacity (ΔSC) of SC, unit tap ratio (Δtap) of OLTC) based on the load flow calculation. The DB setting part sets ΔVcalc as the one side of DB width. The voltage sensitivity method can estimate the voltage change instead of the load flow calculation. However, the voltage sensitivity, a linear indicator, may not be accurate enough because the voltage fluctuation is also large at the weak location. Therefore, the estimation method by load flow calculation is applied in the proposed controller.
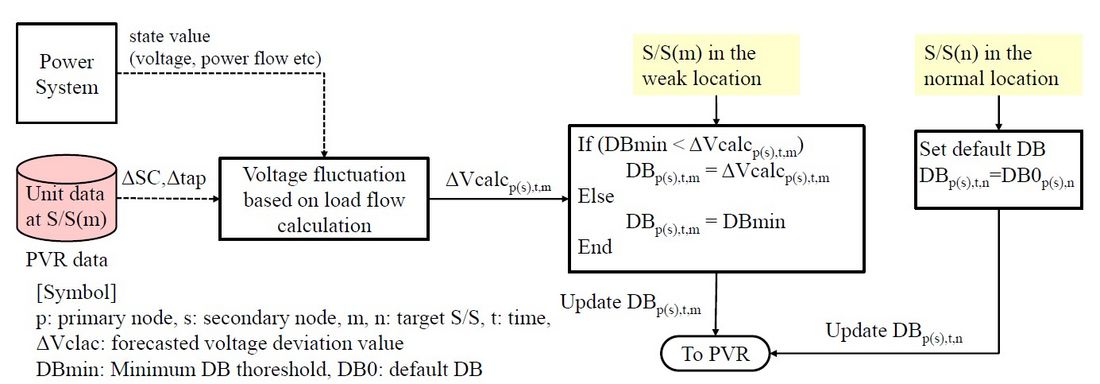
Figure 4 - The logic of dead band (DB) controller
2.5. OPF controller
This section explains the part of centralized control that is classified as SVR. The SVR has the role of setting the reference value or a state value for the PVR based on the network information in a wide area. This study assumes a control system to command Vref for the PVR using the OPF technique. Sequential linear programming (SLP) is applied to solve the OPF considering the computation time. Discrete variables are sequentially discretized for the OPF results of continuous variables. The objective function of the proposed control is expressed as a multi-objective function as shown in equation (4) to achieve three strategies.
The first term of the objective function is to minimize the active power loss of the transmission line in order to optimize the voltage and power flow conditions of the whole EHV system.
The second term is to minimize the voltage deviation from Vsched to reduce the variation of Vref generated in each control cycle. Here, in the weak location, Vsched is generated outside the OPF, and the OPF receives Vsched as an input condition. In other locations, Vref determined by OPF at the previous cycle is set as Vsched at the next control cycle. This way, in the weak location, Vref is generated according to Vsched with enhanced voltage maintenance.
The third term expresses the voltage penalty. Since the voltage management considering the DB width is performed in PVR, it is necessary to coordinate the OPF control range of Vref with this voltage operation range. Therefore, both voltage constraints are realized by considering the voltage deviation from the control range that OPF can set as a penalty term in the objective function. Fig. 5 shows the relationship between these constraints. The upper and lower limits are taken into account as constraints for voltage, reactive power of SG, SC capacity, tap position, and the amount of variable updates with SLP per step.
(4)
where
Plosst,i : active power loss of transmission line at time t and location i
Vt,i : node voltage at time t and location i (decision variable)
??: the number of transmission lines, ??: the number of the monitoring nodes
?1, ?2, ?3: weight factor
Voltage penaltyt,i : the amount of deviation from the OPF control range (see Fig. 5)
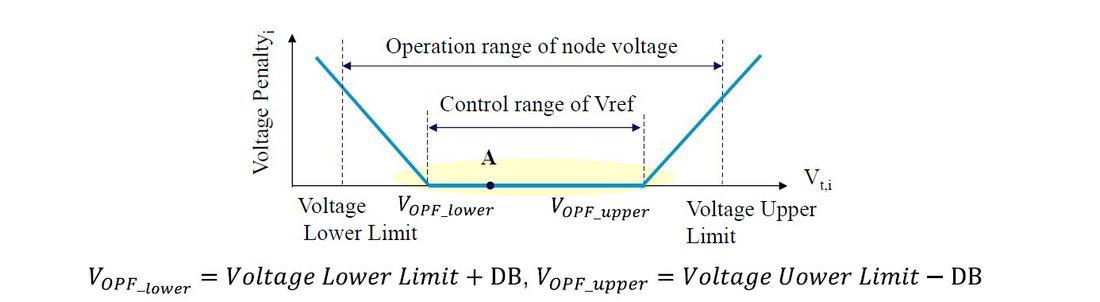
Figure 5 - Relationship between OPF control range and voltage operation range
2.6. Voltage controller in the S/S
This section explains the voltage controller of the S/S classified as PVR. Fig. 6 (a) shows an example of the control block for SC. This controller will switch on/off SC capacity when the integral voltage deviation over the DB exceeds a certain integral threshold setpoint. In the proposed control, the DB is updated based on the setpoint value from the DB controller, and Vref is updated based on the reference value from the OPF controller. In addition, the coordinated control of Shunt/SC and OLTC based on the dual input of primary and secondary node voltages of S/S is also applied. In this control, the DB and Vref of the primary and secondary nodes are updated (see Fig. 6 (b)).
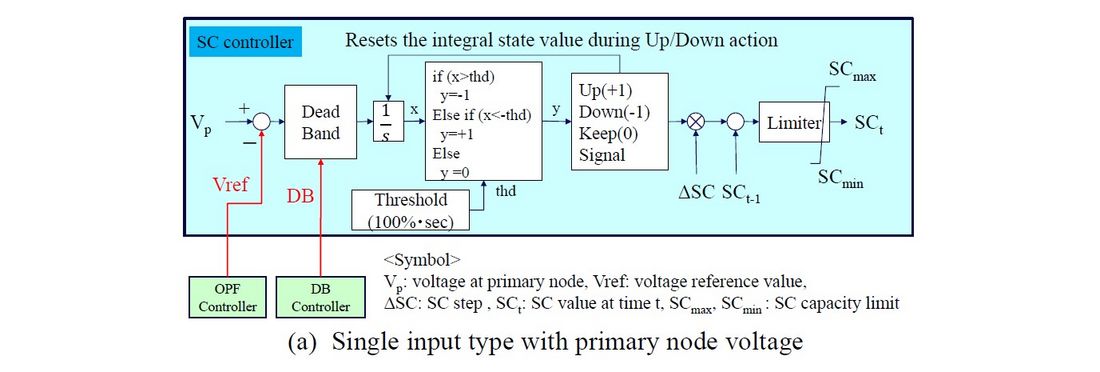
Figure 6 - The logic of voltage controller in the S/S
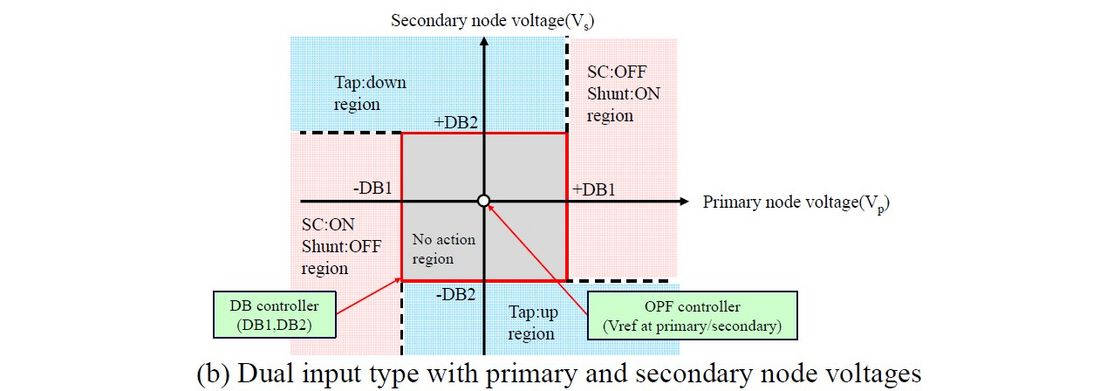
Figure 6 - The logic of voltage controller in the S/S
3. Numerical simulation
3.1. Simulation conditions
The simulation conditions are shown below. The normal voltage operation is the subject of this study, and only models of static characteristics of the power system are considered. So the proposed method is verified by a time-based simulation using the load flow calculation. Fig. 7 shows the network model. This network data simulates an EHV system with 10 machines and 27 buses, which modifies the network model in Ref [5], [6]. The EHV system consists of SGs, transmission lines, transformers, loads, and DERs. Here, the dispersed loads and DERs are aggregated and connected to the secondary side of S/S.
The following results are based on per unit method where the base capacity is 1,000 MVA.
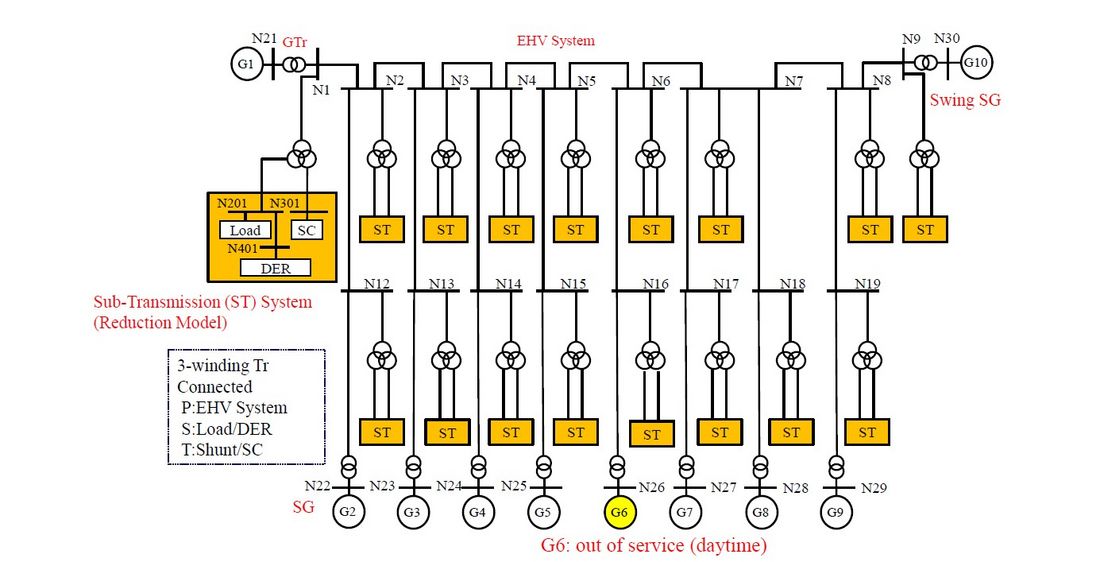
Figure 7 - EHV network model (IEE Japan West10-machine O/V system) in Ref [4],[6]
The simulation conditions are shown in Table. Ⅰ. It is assumed that the SG will be out of service when the DER installed capacity increases. The maximum DER output is assumed to be 25 % of the load. Also, the SG of G6 (the center of Fig. 7) is assumed to be out of service during the daytime. The SGs in service maintain the supply and demand balance by using the AGC function in a 5 minute cycle. Since this study focuses on the static characteristics, the PVR is calculated in a 30 second cycle, and the SVR is calculated in a 15 minute cycle. The control cycle of the SVR was assumed to be longer, considering the time required for the request of system information, calculation, command, and the control cycle for generating the forecasting data. Other details of the controller are explained in the previous section.
| Network | EHV system: WEST10-machine O/V revised of IEE Japan Calculation period: 24 hours, Calculation cycle: 30 second |
| Demand (Load, DER) and Supply condition | |
| Load | Maximum load: 100% (76.8 GW), Minimum load: 64 % Power Factor: 0.98 (consumption, lead) Voltage characteristics of active and reactive power: constant power |
| DER (Photovoltaic) | Capacity: 40 % of near load (25 % of load at maximum output) Output setting based on the solar radiation data for each location Power Factor: 0.98 (consumption, lead) |
| SG | G6 is out of service from 5:00 to 14:00 (daytime) Fuel cost G8 < G1-G7, G9 Dispatch: Automatic Generation Control (5 minute cycle) |
| each SVR controller (15 minute cycle), each SG, PVR controller (30 second cycle) | |
| SG | AVR/AQR with capability curve of active and reactive power |
| PVR in the S/S | N1-N8: Dual input model (SC and OLTC coordinated control) N12-N19: Single input model (SC and OLTC separated control) Default DB value (DB0) is 2 % (Both of SC and OLTC) |
| OPF controller | Sequential LP method (Solver: Google OR-Tools) Control type: the voltage reference value (15 minute cycle) Control points: terminal at SG, primary and secondary node at S/S |
3.2. Results
The simulation results with the proposed control are shown below.
3.2.1 The selection of the weak location
This section confirms the selection of the weak location. Fig. 8 shows the active power output of SG. Since the fuel cost function is the same except for G8, the active power output waveform shows the same result except for G8, and G6 which is out of service. Fig. 9 shows the voltage fluctuation index based on the voltage sensitivity of the primary node of the S/S. Here, there is a correlation between the period when G6 is out of service and the period when voltage fluctuation increases. In particular, it can be recognized that N16 and N6 nodes nearby G6 show a large voltage fluctuation index.
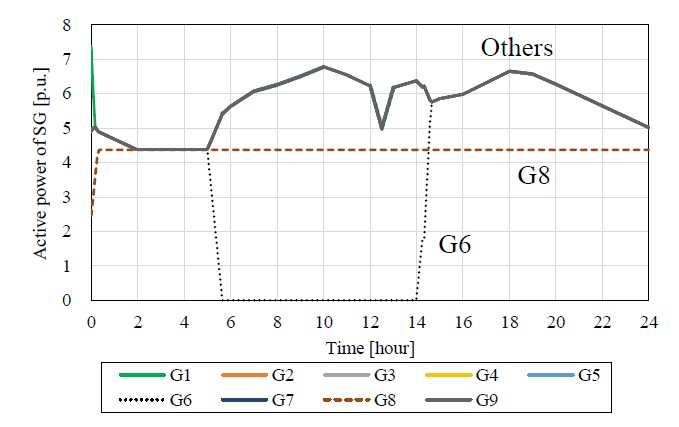
Figure 8 - Active power output of SGs
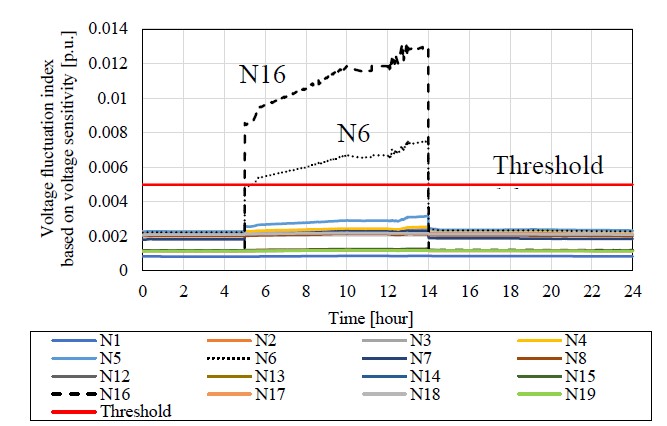
Figure 9 - Voltage fluctuation index
3.2.2. Voltage simulation results
Fig. 10 shows the voltage simulation results with the proposed control. Each figure shows the following results for each node.
- Voltage (proposal): Voltage result with all voltage controllers
- Voltage (conventional): Voltage result with only OPF and PVR (for comparison)
- Vref: Voltage reference value from OPF controller (proposal)
- Vref + DB, Vref - DB: Regions where PVR does not work (proposal)
- Voltage Upper Limit, Voltage Lower Limit: Voltage operation ranges (common)
The following results were obtained for normal and weak locations.
a) the normal locations (N5, N205)
- These nodes are not subject to the proposed control (Vsched controller and DB controller) because their voltage fluctuation indices are small. Therefore, there is no difference in the voltage results between the conventional and proposed cases.
- In the N5 node, Vref + DB is equivalent to the Voltage Upper Limit after 8:00 am since Vref is set to a higher value in normal locations to reduce the active power loss.
b) the weak locations (N6, N206, N16, N216)
- It can be confirmed that the voltage fluctuation increases when SG is out of service (5:00 to 14:00).
- Compared with the conventional case, the voltage stayed around the center of operation range when the proposed control was applied. As a result, it is possible to avoid continuous low or high voltage beyond the Lower or Upper Limit.
- In particular, the N16 node is the location where the voltage fluctuation increases as SG is out of service. Vref was set low around 12:00 to prepare for sudden voltage increase, while Vref was set high around 13:00 to prepare for voltage drop. Consequently, the proposed method could successfully avoid voltage deviations. In particular, Vsched setting using the demand forecast value significantly affects the control performance for sudden voltage changes.
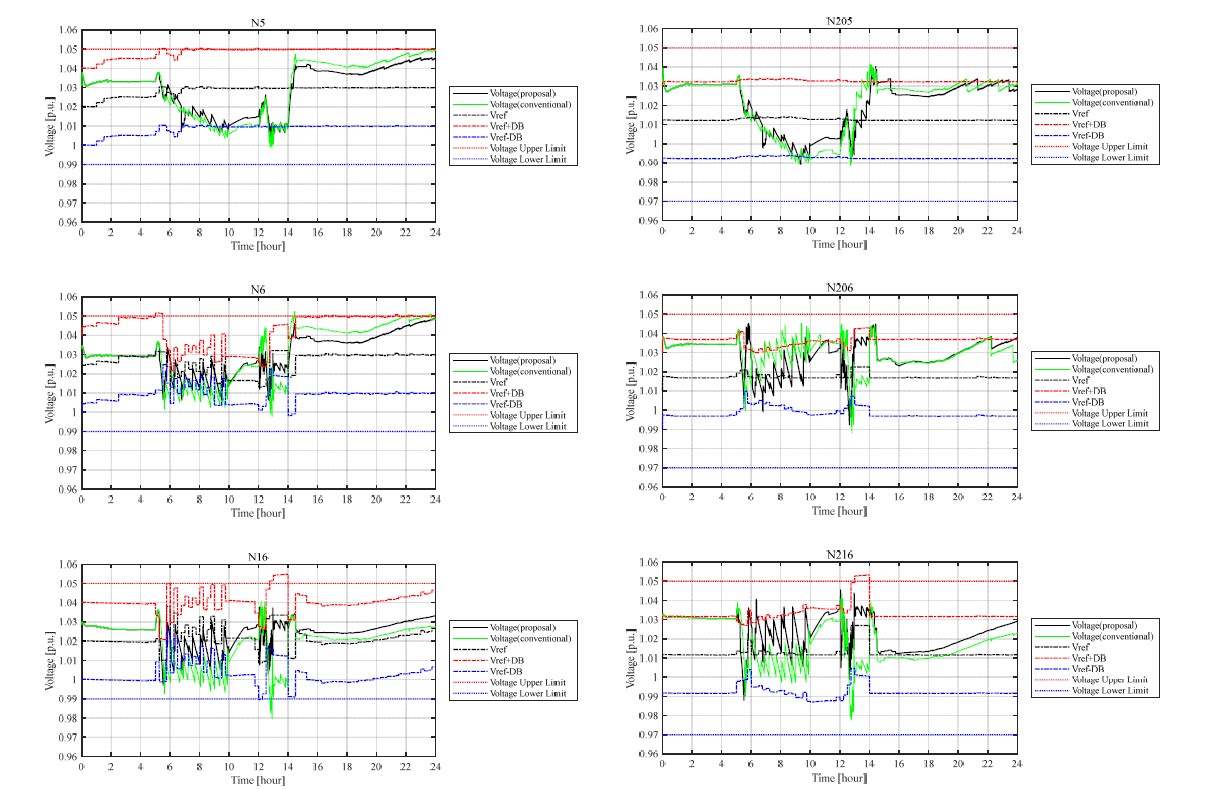
Figure 10 - Voltage waveform (primary and secondary node), Vref and DB at each nodes
(the normal locations: N5, N205 and the weak locations: N6, N16, N206, N216)
3.2.3. The impact of DER output on control effect
Finally, the impact of DER output on the control performance was examined. Fig. 11 shows the statistical results of voltage at the primary node of the S/S at the weak location. Fig. 11 (a) and (b) show the conventional and proposed methods, respectively. The x-axis represents locations and the maximum percentage of DER output to load. The y-axes show the maximum and minimum values, the mean value, and the standard deviation of voltage during the daytime (5:00 to 14:00). Each service conditions of the SG are as follows.
- DER 0 % case: All SGs are in service (output adjustment only)
- DER 25 % (Fig. 10 case), DER 50 % case: G6 is out of service
- DER 75 % case: G3, G6, G8 are out of service
The result shows that, with the conventional method (a), the standard deviation of voltage increases as the DER output increases. In contrast, with the proposed method (b), the increase of the standard deviation of voltage is reduced compared to the conventional method. Moreover, the maximum and minimum values of the voltage are also within the operational range. It can be verified that the occurrence frequency of voltage deviations has been reduced.
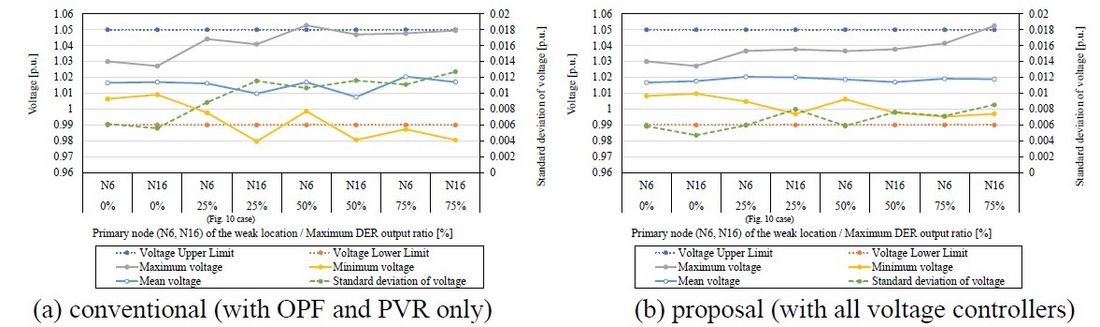
Figure 11 - Voltage statistics at weak location according to DER output at daytime
4. Conclusion and future plan
In this paper, to improve the voltage controllability in the EHV system under normal conditions, the dynamic adjustment method of the voltage schedule value (Vsched), the voltage reference value (Vref), and the dead band (DB) of the S/S are proposed, and these control effects are verified through numerical simulations.
There are two issues to be solved in the future. One is the coordination of operations between S/Ss. The voltage control sensitivity could be increased with the proposed DB control when the DB width is reduced for better voltage control performance. However, if the number of weak locations increases, the possibility of simultaneous operations at multiple locations is likely to occur, and the instantaneous voltage fluctuation may increase. To avoid this problem, it is necessary to coordinate PVR operation between neighboring S/Ss in a weak location.
The other issue is to secure reactive power resources for voltage control. All of the proposals in this paper are methods to utilize the existing voltage controllers efficiently, and new voltage control equipment such as reactive power control by DERs was not considered. Namely, the voltage control by those new resources with voltage maintenance functions (synchronous condenser and inverter devices with voltage maintenance functions) should be used to mitigate voltage fluctuation in power systems with a reduced number of SGs.
References
- S.Corsi, M.Pozzi, and G.D.Olio "The Coordinated Automatic Voltage Control of the Italian Transmission Grid Part I: Reasons of the Choice and Overview of the Consolidated Hierarchical System" (IEEE Trans on Power Systems, Vol.19, 2004, No.4, pages 1723-1732)
- P.Lagonotte, J.C.Sabonnadiere, J.Y.Leost, and J.P.Paul "Structural Analysis of the Electrical System: Application to Secondary Voltage Control in France." (IEEE Trans on Power Systems, Vol.4, 1989, No.2, pages 479-486)
- Q.Guo, H.Sun, J.Tong, M.Zhang, B.Wang, and B.Zhang "Study of System-wide Automatic Voltage Control on PJM System" (IEEE PES General Meeting, 2010, pages 1-6)
- K.Hideo, T.Takao "A Dynamic Adjustment Method of Dead Band Width for Advanced Voltage Control in Power Systems" (IEEJ Trans on Power Energy, Vol.142, 2022, No.3) (in Japanese)
- P. Kundur "Power System Stability and Control" (McGraw-Hill,1994)
- Technical Committee of IEEJ in charge of the standardization of power system models "IEEJ power system standard models" (The Institute of Electrical Engineers of Japan, 2001) (in Japanese)