Development of advanced AI technologies for condition diagnosis of high voltage switchgear in substations
Authors
A. YAMAGUCHI, K. UENO - Toshiba Corporation, Japan
K. UCHIDA, E. MATSUMOTO, T. SAIDA - Toshiba Energy Systems & Solutions Corporation, Japan

Summary
Recently, electric power companies around the world have started to apply various IoT technologies for efficient maintenance and operation of their facilities. In particular, for substation equipment such as switchgear, the need to shift to efficient and reliable maintenance and operations is urgent due to the critical role of substations, the large equipment volumes they contain, and the aging of substation equipment. An important example is the ongoing introduction of equipment diagnostic technology that involves condition monitoring with various sensors installed in substations. Such diagnostics require a method that can detect abnormal symptoms with high accuracy at an early stage and then provide interpretability of the diagnosis results. In this study, we propose an AI diagnostic method based on One-Class Learning Time-Series Shapelets (OCLTS), which is capable of learning only from normal data and presenting the basis of an anomaly, and apply it to substation equipment diagnostics.
In the training step of the AI-based diagnostics, the method inputs waveform or time-series data such as the travel curve of a circuit breaker contact movement, only under normal conditions, and identifies shapelets, which are typical patterns of sub-waveforms that make up the input time-series data, to represent normal states. In the equipment diagnostic step, an anomaly score of diagnosed time-series data is calculated based on the degree of deviation from the normal conditions. OCLTS is suitable for application to high-voltage equipment diagnostics in substations. First, because substation equipment is generally highly reliable and it is often difficult to collect abnormal data during training, OCLTS is learned only from normal data. Second, OCLTS can discover the abnormal sub-waveforms and identify the deviations from the normal sub-waveforms (shapelets), which cause the anomaly score to increase. As a result, OCLTS provides interpretability of the abnormalities and facilitates the effective investigation of their cause.
In this study, we improve OCLTS for initiating high-voltage substation equipment diagnostics. OCLTS can detect small abnormal symptoms at an early stage, although it is difficult to detect them with traditional diagnostic techniques using design-based FMEA methods. To expand its applicability, we further improve OCLTS so that it is applicable even if time-series data under normal conditions include the inrush current of a spring-operated mechanism and fluctuates during operations. This AI-based diagnostic method is particularly suitable for use in numerous existing and aging equipment, where the need for equipment diagnostics is relatively high. It can be effective in realizing efficient and reliable maintenance and operations in the future.
Keywords
Monitoring and diagnosis - AI - Machine learning - Interpretability - Anomaly detection - Time series1. Introduction
In recent years, with the widespread use of IoT, electric power companies have begun to install various sensors to monitor equipment for the efficient maintenance and operation of infrastructure facilities related to power transmission and distribution [1, 2]. In particular, there is an urgent need to shift to efficient and reliable maintenance and operation of substation equipment, such as switchgear, in view of its important role, the large amount of equipment, and the aging of this equipment.
One of the most important applications is equipment diagnostic technology that detects symptoms of abnormalities in substation equipment at an early stage and with high accuracy. In substation equipment including GIS, features such as opening/closing time, speed, and operating time are extracted from waveform or time-series data (e.g., travel curve data), and equipment diagnostics are performed through threshold judgment and trend analysis. However, the recent application of image processing and AI technology has made it possible to evaluate changes and fluctuations in the measurement of the waveform itself, which is thought to contain more information about the equipment, and this can be applied to more advanced equipment diagnostics. In particular, for older equipment, the number of which is expected to increase every year, there is a need to establish equipment diagnostic technology that can detect anomalies with high sensitivity and at an early stage before critical failures occur so that it can be effectively used in subsequent maintenance operations, facility maintenance, and renewal plans. Therefore, the application of artificial intelligence (AI) technology to this field is highly expected.
In this paper, we introduce a newly developed AI diagnostic method that can identify the basis of an abnormality when diagnosing anomalies, by using only normal data as input, along with application examples. In addition, we show that this method can have high affinity and effectiveness in diagnosing older equipment.
2. Background and motivation
In this section, we clarify the challenges of using AI technology for equipment diagnostics. Then, we describe a shapelet method, which is an existing AI technology that overcomes the issue of interpretability. In this study, we use time-series data such as travel curves and motor current observed from sensors attached to switchgear for the purpose of diagnosing equipment.
2.1. Challenges to AI-based Condition Diagnosis
When applying AI technology to switchgear diagnostics, there are challenges to be addressed, such as (1) interpretability of the diagnostic results and (2) the rarity of anomaly data, in addition to simply improving the accuracy. Challenge (1) is the need to explain the basis for AI diagnosis of anomalies. Challenges (2) means that, in general, it is rare for highly reliable switchgear to measure anomalies, making it difficult to collect abnormal data suitable for the AI training process.
In recent years, AI technologies such as deep learning have achieved high accuracy in various fields, including image processing, natural language processing, and time series analysis. However, it is difficult to solve all these problems with conventional AI technologies. For example, deep learning is a black-box model that generates a large number of features that are difficult for humans to understand, making it difficult to directly overcome Challenge (1).
2.2. AI Technologies Based on Learning Shapelets
In this study, we adopted an AI technology known as the shapelet method [3] for switchgear diagnostics. Shapelet methods can automatically discover typical patterns of sub-waveforms (shapelets) that classify time-series instances as normal and abnormal [3, 4]. They are known as AI technologies that not only have interpretability but also high accuracy, and they have been actively studied in the academic fields of data mining and machine learning in recent years (e.g., see [5] and the references therein). This advantage is suitable for diagnostics of old switchgear, which is difficult to learn using abnormal data because of its high reliability even at great age.
However, when applying shapelet methods to switchgear diagnostics, Challenge (2) (rarity of anomaly data) cannot be addressed because the conventional shapelet methods require a collection of abnormal data at the training stage. To address this challenge, we previously developed an AI technique, One-Class Learning Time-Series Shapelets (OCLTS), that learns shapelets from only normal data [6][7]. As shown in Fig. 1, OCLTS takes as input only time-series instances of normal conditions, and learns shapelets, which are typical patterns of sub-waveforms constituting the time-series instances, under normal conditions beforehand. Dozens of normal time-series instances are usually sufficient as training data, and shapelets can be learned according to the length and number of shapelets given by the user. In addition, a one-class classifier can also be jointly learned to represent a multi-dimensional normal region. At the diagnostic stage, the deviation level from the one-class classifier is output as an anomaly score, and a time-series instance with a large deviation from shapelets can be judged as an anomaly with a high anomaly score.
In the existing AI diagnostic methods that provide interpretable diagnostic results by automatically discovering shapelets, both abnormal and normal time-series instances are required for training, but OCLTS can be trained using only normal time-series instances. Moreover, when detecting anomalies, OCLTS can identify the sub-waveforms that deviate from the normal and representative sub-waveforms (shapelets) and cause the anomaly score to increase. Therefore, with such high interpretability for anomaly detection, it can be expected that the investigation of the cause of anomalies can be effectively advanced in conjunction with methods such as FMEA, based on the change aspect to the unusual state (change in a breaker opening/closing speed and its travel curve).
Because time-series data such as motor current (including inrush current) of a spring-operated mechanism has a certain waveform variation depending on the operating conditions at the time of each operation, as well as the sudden change in time even under normal conditions, it is difficult for the original OCLTS to distinguish between normal and abnormal. In this study, we further improve the OCLTS to be able to handle such normal data with large fluctuations.
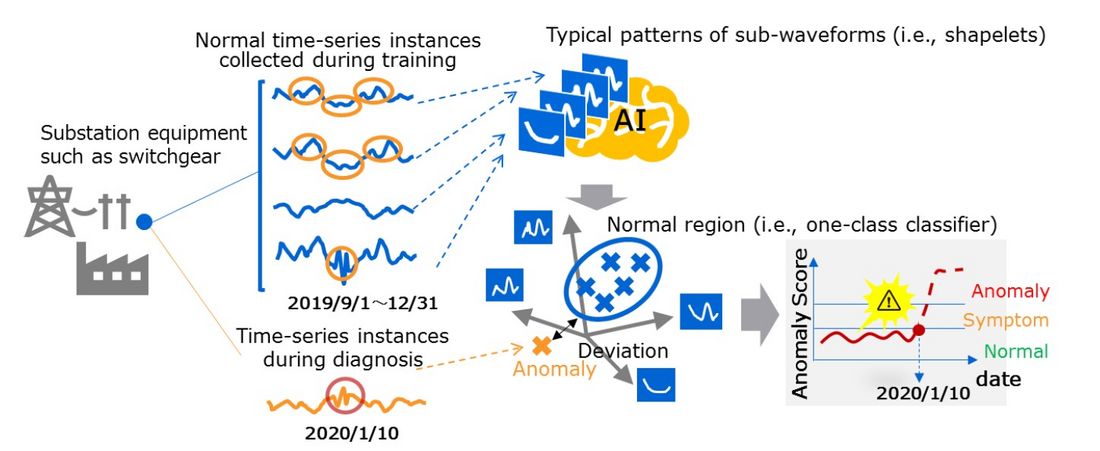
Figure 1 - Overview of OCLTS
3. Condition diagnosis by original OCLTS
3.1. Original OCLTS
Figure 2 shows the mechanism of OCLTS, which learns shapelets using only normal time-series instances as input without using abnormal data. In OCLTS, shapelets are a set of typical patterns of sub-waveforms that make up the time-series instances included in the training data. When performing diagnostics of equipment, the OCLTS classifies normal and abnormal based on the deviation of the waveform from the shapelets that can be considered as normal and representative sub-waveforms. The number of shapelets corresponds to the dimension of the feature vector. In the example shown in Fig. 2(A), OCLTS discovers an upward-curving sub-waveform and a horizontal sub-waveform, which constitute the normal time-series instances, as two shapelets, and maps the instances as feature vectors in the two-dimensional feature space. An OCLTS feature vector represents the waveform deviations from the shapelets. In the training process, OCLTS learns feature vectors as the level of difference between shapelets and a normal time-series instance. When diagnosing the orange time-series instance shown in Fig. 2(A), the horizontal sub-waveform around the red circle deviates to a level not seen in the training data. Thus, this feature vector is an outlier against the normal region and is identified as an anomaly.
As shown in Fig. 2(B), the optimization procedure is performed by minimizing the following three major terms through the shapelet-based feature vectors. The first minimizes the classification error of the training data. The second minimizes the approximation error so that the shapelets closely approximate the normal time-series instances. The third minimizes the regularization term of the one-class classifier so that it can correctly classify unknown instances (i.e., to improve the generalization performance). Here, a one-class classifier is an AI model trained using only normal data for anomaly detection, and the model intuitively represents a normal region of the feature space.
Figure 2(C) shows the algorithm for solving the optimization problem formulated in Fig. 2(B). Similar to deep learning, a learning algorithm known as stochastic gradient descent (SGD) is used to output locally optimized shapelets and one-class classifiers.
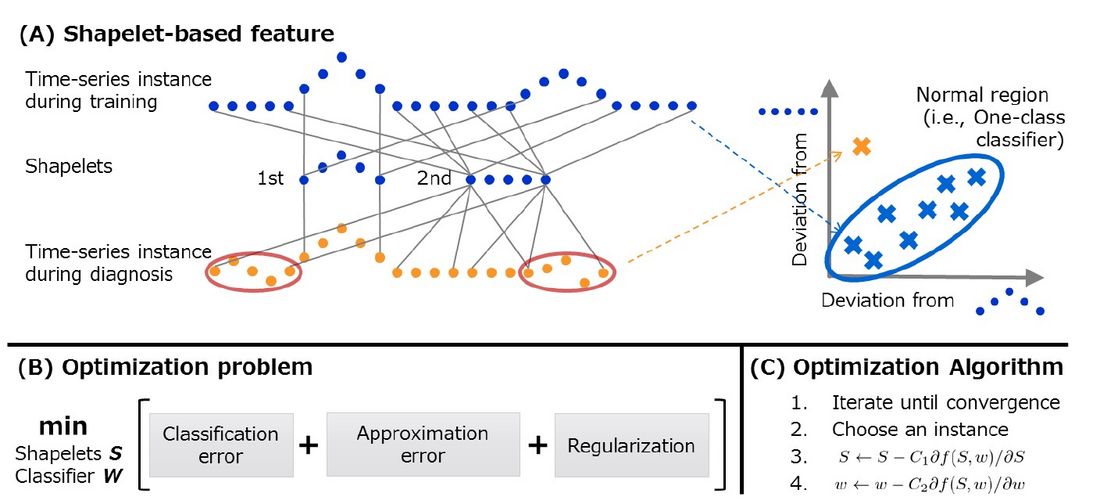
Figure 2 - Learning mechanism of OCLTS
3.2. Condition Diagnosis with Travel Curve Data
Figure 3 shows the results of applying OCLTS to GCB equipment diagnostics. We used the open-circuit travel curve of the GCB and collected 100 normal time-series instances to train the OCLTS, and then the OCLTS diagnosed the following 100 normal time-series instances and the 30 time-series instances in which symptoms of equipment failure begin to appear. Figure 3(A) (left, centre, and right) shows the normal time-series instances, the time-series instances where abnormal symptoms start to appear, and all of these time-series instances, respectively. It is difficult to find the difference visually from the entire waveforms, and also difficult to distinguish clearly by the traditional and manual features based on expert knowledge.
When a time-series instance to be diagnosed is input, the OCLTS outputs a numerical value (anomaly score) that indicates the degree of abnormality. In Fig. 3(B), the horizontal axis represents the number of open-circuit operations and the vertical axis represents the anomaly scores of the open-circuit operation time-series instances. The anomaly scores increase significantly when abnormal symptoms begin to appear, thus indicating that the OCLTS can precisely detect even the subtle abnormal symptoms of the GCB.
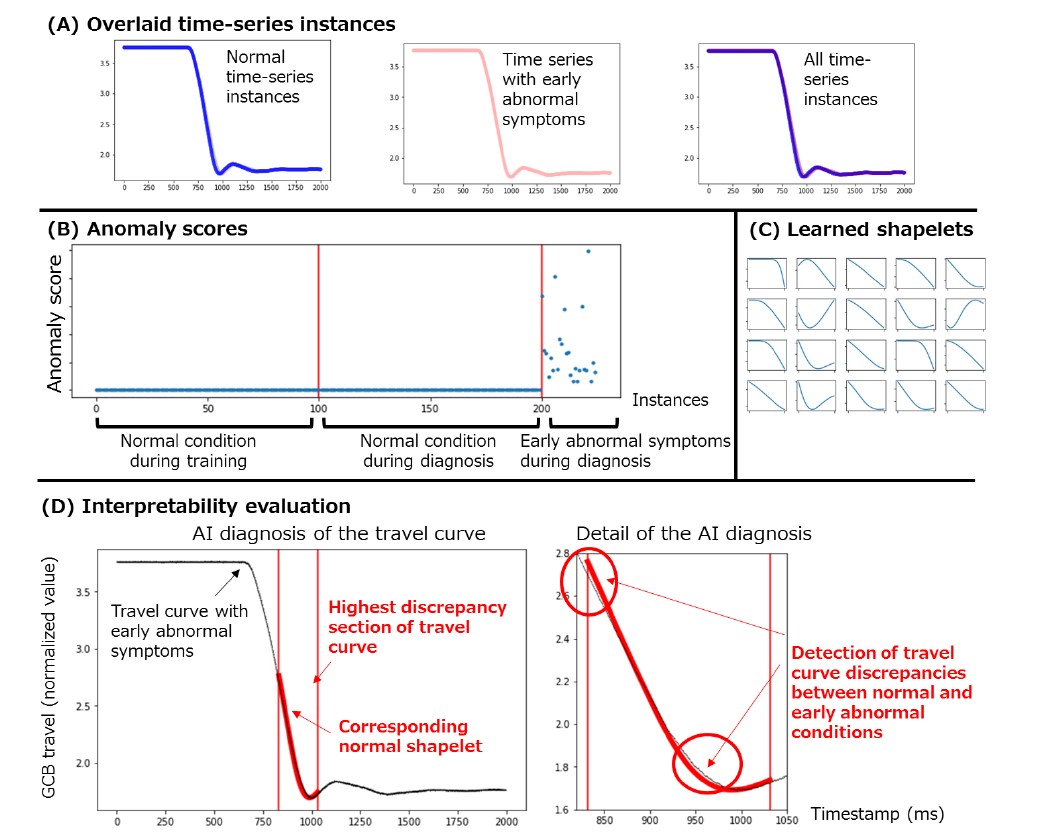
Figure 3 - Condition diagnosis on travel curve data
Figure 3(C) shows the results of the shapelets learned with the number of shapelets set to 20 and their length set to 10% of the time-series length. In Figure 3(D), the time-series instance with the maximum anomaly score after the start of anomaly symptoms is drawn with a black line. In Figure 3(D) (left), the waveform with the largest deviation from the shapelets is surrounded by the red line. The thick curve is the corresponding shapelet learned by OCLTS from the normal time-series instances. Figure 3(D) (right) enlarges the area surrounded by the red line. By zooming in, we can see that the slope of the travel curve becomes slightly slower when abnormal symptoms begin to appear. This is consistent with expert knowledge that the opening/closing operation becomes sluggish due to a defective component in the equipment. This indicates that the OCLTS can correctly detect even a slight waveform deformation, which is so slight that an expert cannot tell the difference even by visually checking the entire waveform to be diagnosed. Therefore, these results confirm that OCLTS can detect an anomaly in the GCB at an early stage with high sensitivity.
4. Condition diagnosis by improved OCLTS
We describe the improved OCLTS to enable the diagnosis of waveforms with large fluctuations, which is different from the travel curve of a circuit breaker, and evaluate the effectiveness of the improved OCLTS by applying it to the motor current data.
4.1. Improved OCLTS
As shown in Section 3, the original OCLTS provides highly accurate diagnostic results when normal waveforms such as the travel curve of the GCB have slight fluctuations. However, in actual equipment diagnostics, it is also necessary to diagnose time-series data such as the inrush current of a spring-operated mechanism, which normally fluctuates depending on the conditions at the start of motor operation. To expand this technology to various equipment diagnostics, it is necessary to be able to correctly classify normal and abnormal time-series instances for such difficult waveforms. Therefore, as shown in Fig. 4, we improve the OCLTS in two main ways to make it robust to such data fluctuations.
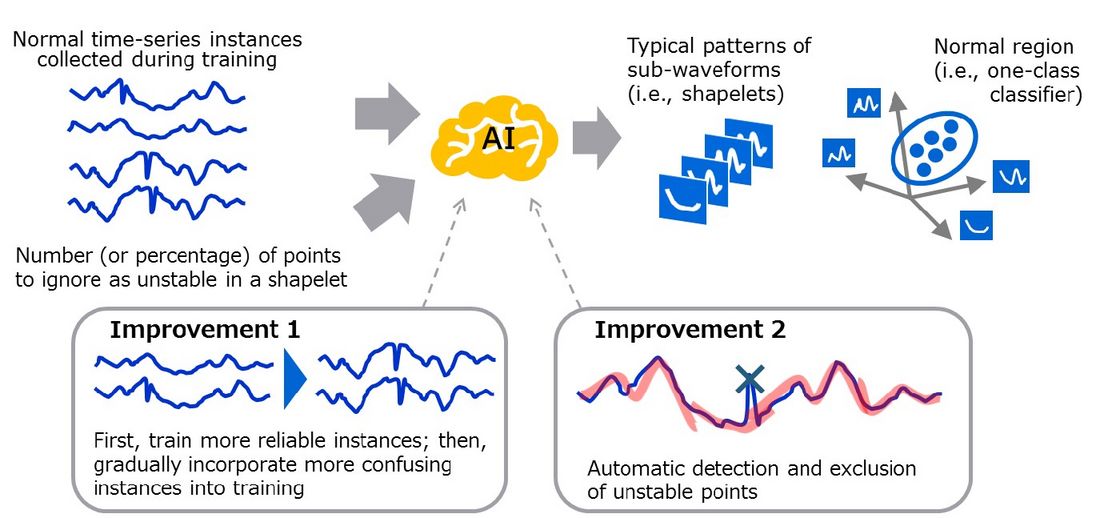
Figure 4 - Overview of improved OCLTS
The first improvement is to make the OCLTS robust to unreliable training data. Even if the equipment is normal, the time-series data measured by the sensor may not be considered normal due to large fluctuations. In the original OCLTS, shapelets and one-class classifiers are optimized by choosing training instances uniformly at random based on SGD algorithms, resulting in performance degradation when unreliable training instances are chosen. To mitigate the negative effects of such unreliable training instances, a learning algorithm known as self-paced learning (SPL) has been proposed. Similar to the learning process in humans and animals, SPL first selects and learns easy and reliable training instances, and then gradually includes difficult and unreliable training instances while automatically and dynamically calculating the reliability of the training data. Just as we applied SPL to the shapelet method [3] in a previous study [8], we apply SPL to OCLTS in this study.
The second improvement is to make the OCLTS robust to large fluctuations in waveforms under normal conditions. When the training time-series data contains fluctuations, the shapelets of the original OCLTS are affected by the fluctuations, resulting in large deviations from the normal waveform. As a result, the deviation from the abnormal waveform is relatively small, and the difference in the anomaly scores between normal and abnormal instances becomes unclear, decreasing the performance of anomaly detection. To solve this problem, the improved OCLTS robustly measures the approximation error between a time-series instance and a shapelet. When the user specifies the number or percentage of points considered to be unstable in a shapelet, the OCLTS automatically and dynamically identifies the most deviated unstable points in a shapelet and calculates the approximation error while ignoring these points. As a result, the features based on the shapelets are less affected by the deviations, and the learned shapelets and classifiers become more robust to large fluctuations.
4.2. Condition Diagnosis on Motor Current Data by Improved OCLTS
We used the improved OCLTS described in Section 4.1 to evaluate the equipment diagnostics using the motor current data of a spring-operated mechanism. Figure 5(A) (left and right) shows normal waveforms and simulated abnormal waveforms, respectively. The motor current data include a sudden spike-like waveform called “inrush,” which occurs even when the motor starts under normal operation. When the outline of the waveform is important for discriminating between normal and abnormal, this spike waveform that changes with each operation does not contribute to the discrimination between them. In addition, compared with the travel curve data in Fig. 3(A), the normal fluctuations in the horizontal axis are also large. The number of normal time-series instances and simulated abnormal time-series instances was 50 each. We used 20 of the normal instances as training data, and tested the diagnostic performance with the remaining 80 instances.
We compared the original and improved versions of OCLTS. In all cases, the length of the shapelets was set to 2% of the time-series length and the number of shapelets was set to 60. In the improved OCLTS, we changed the number of shapelet points n considered as unstable to 0, 8, 16, 32, and 64. Especially, n = 0 corresponds to the case where only the first improvement is performed without the second improvement. We evaluated the anomaly detection performance by the difference score. The difference score is defined as the average difference between the anomaly scores in abnormal and normal conditions, and a higher value means a better anomaly detection performance.
Figure 5(B) shows the anomaly scores for the compared methods. The horizontal axis represents the number of operations and the vertical axis represents the anomaly scores. Unless the number of points n, which are considered as unstable points added by the improved OCLTS, is extremely large, the improved OCLTS has a higher difference score and better anomaly detection performance than the original OCLTS. We also found that the performance was significantly improved when both the first and second improvements were applied. In particular, when n=32, the difference score was 38 times higher than that of the original OCLTS. In the original OCLTS, there were some instances whose anomaly scores increased even though they were normal. However, the improved OCLTS has no such incorrect anomaly scores when n=8, 16, and 32. In the rest of this section, we will evaluate the improved OCLTS with n=32, which has the best difference score.
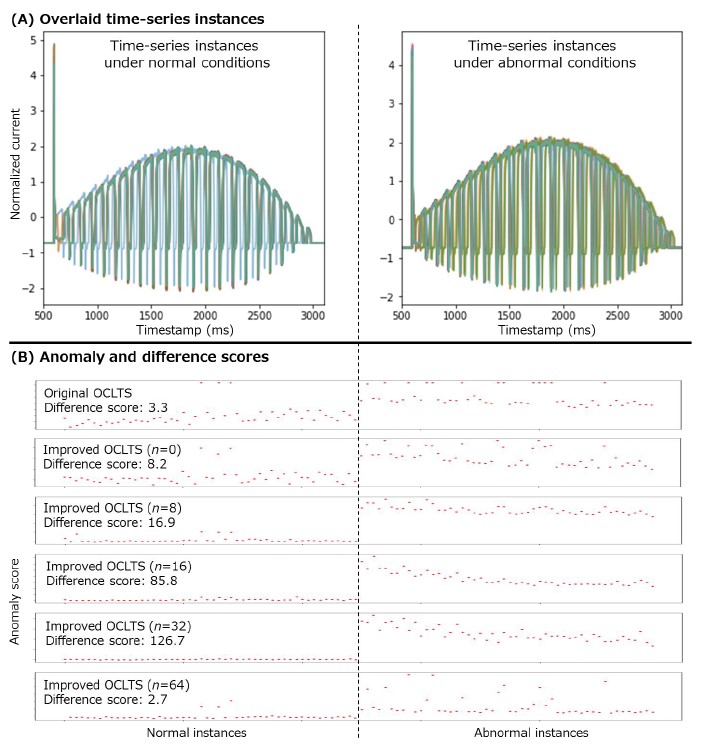
Figure 5 - Condition diagnosis with motor current data
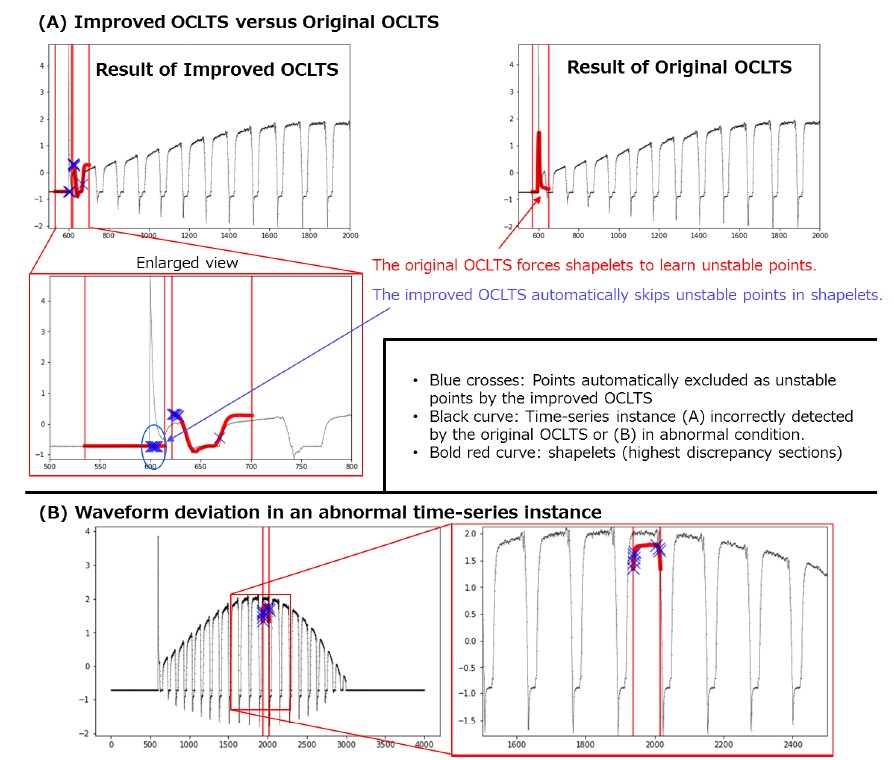
Figure 6 - Interpretability evaluation using motor current data
In Fig. 6(A), we compare the shapelets learned by the improved and original OCLTS on the normal time-series data, where the anomaly scores of the original OCLTS increased. The black curve is the time-series instance, and the red curves are the shapelets with the largest deviations from the normal waveform. The shapelet points that are ignored as unstable points in the improved OCLTS are marked with blue “x”s. As expected, the improved OCLTS automatically and successfully ignored the sudden peak waveforms as unstable points, and therefore the shapelets fit the outline of the time-series instance and were not affected by the unstable points. In contrast, the original OCLTS learns the shapelets to fit the sudden peak waveforms, which causes the shapelets to be misshapen. This causes the anomaly scores of the original OCLTS to increase even in normal time-series instances.
In Fig. 6(B), we show the waveform distortion in the time-series instance with the largest anomaly score in the improved OCLTS. The most deviated parts from the shapelets learned in the normal case are surrounded in red and enlarged. We can see that the height of the waveform becomes higher in the abnormal case. This difference discovered by the improved OCLTS is consistent with the features that experts pay attention to in this simulated anomaly. Therefore, the experimental results in this section confirm the effectiveness of the improved OCLTS.
5. Conclusion
In this study, we clarified the important issues in applying AI diagnostic technology to switchgear, such as the interpretability of AI and the rarity of anomaly data, and introduced AI technology to solve these issues. In particular, we applied this AI technology to two time-series datasets obtained from switchgear (travel curve data with little fluctuation at each operation, and motor current data with larger fluctuation even during each normal operation) and confirmed the effectiveness of the diagnosis.
These advantages of equipment diagnostics performed by AI technology are suitable for application to older equipment with high maintenance needs and will be effective in realizing efficient and advanced maintenance and operation of switchgear in the future. To this end, we will continue to study the application of AI technology and deepen our investigation of practical aspects, such as appropriate parameter settings for AI diagnostics.
References
- K. Uchida et al.: GIS On-line monitoring solution using real-time data collected form GIS mounted sensors, CIGRE, 2020.
- Y. Matsushita et al.: Practical use of monitoring / diagnostic systems to realize more efficient maintenance, stable electric power supply and optimized refurbishment, CIGRE, 2014.
- J. Grabocka et al.: Learning Time-Series Shapelets, ACM SIGKDD, 2014.
- L. Ye et al.: Time Series Shapelets: A New Primitive for Data Mining, ACM SIGKDD, 2009.
- A. Yamaguchi et al.: Evolvable Time-series Shapelets, IEEE ICDE, 2022.
- A. Yamaguchi et al.: One-Class Learning Time-Series Shapelets, IEEE Big Data, 2018.
- A. Yamaguchi et al.: OCLTS: One-Class Learning Time-Series Shapelets, IJDAT, 2019.
- A. Yamaguchi et al.: RLTS: Robust Learning Time-series Shapelets, ECML PKDD, 2020.