Hybrid HVDC Transmission System Using Grid Forming Con-verters to Supply Energy to Rural Areas
Authors
M. RAZA, M. WALEED RAZA, A.HUSSAIN - Dpt. of Electrical Engineering, Bahria University, Karachi, Pakistan
R. MOHAN LAL - School of Science and Engineering, University of Dundee, Scotland

Summary
The demand for electricity access in rural areas is on the rise in view of population growth as a necessity. Since villages are located at long distances from the national grid, they require new network infrastructure as an alternative to existing AC overhead lines. As a viable solution, this paper proposes the design of an HVDC network for electrification of rural areas connecting with the national grid over long DC cables. First, HVDC transmission joining two rural areas is modeled with voltage source converter at the receiving end and diode rectifiers. Secondly, vector control method is proposed for designing the controller and its performance to reach steady state is analyzed following load disturbances in the network. The results are validated through simulation using power system software ’DigSilent PowerFactory’ to observe dynamics and steady state characteristics. The satisfactory performance to achieve steady state following the load changes shows that multi-terminal dc transmission has great potential to be deployed for transmission of high power over long distance. Moreover, a DC line fault and AC fault are also simulated and simulations are used to validate the performance of the system.
Keywords
Diode rectifier - frequency control - isolated grid - MTDC System - voltage source converter - voltage control1. Introduction
Pakistan electrical transmission system consists of 500 kV and 220 kV overhead lines. These overhead lines supply power to the distribution network at the level of 132 kV and 66 kV. The overall transmission and distribution network length is approximately 51,709 km. Where, the length of 500 kV transmission lines is 5,187 km, and the length of 220 kV lines is 9,687 km. Pakistan is a large country and has a large population thus has high power demand [1]. The peak power demand of the country was 26,741 MW in 2017-18 and it is expected to increase up to 39,163 MW by 2027-28. The access to electricity in rural areas is also required as a necessity to improve quality of lives of the villagers. However, expansion in currently existing AC overhead lines has two issues. First, Pakistan is a vast country with difficult terrain, thus it poses complication in enhancing the current network system to connect remote villages from the national grid [2]. Secondly, deployment of AC overhead lines causes high reactive power flow and limits transmission of required active power with increasing line length. To comprehend these limitations, a concept of the INELFE project of France and Spain in which the 320 kV DC cables were laid in a difficult terrain can be adopted [3]. In that project, electrical interconnection is 64.5 km long with 33.5 km in France and 31 km in Spain. A tunnel is used to transmit 2000 MW of power due to the complexity of the route. Such a network can be developed in the rural area of Pakistan Balochistan region to supply the electricity.
As an alternative to HVAC, HVDC transmission offer advantages over AC transmission in several aspects as a means to supply electricity to remote areas [4] – [7]. As a technical point of view, the amount of active power remains relatively constant with distance and has lower cable losses, while power transmission capability in HVAC reduces with increase in line length. Economically, investment costs for building new HVDC transmission lines could be less than the AC counterpart beyond some critical distance [8], [9]. Further, the significant improvement in power and voltage rating in voltage source converter (VSC) technology enables its application for HVDC transmission to remote small-scale and offshore generation sites [10], [11]. In contrast to thyristor-based line commutated converter (LCC), VSC-HVDC offers control active and reactive power independently, and thus acts similar to a synchronous generator in the network [12], [13]. The VSC-HVDC system has the ability to energize an isolated or remote grid [14].
An HVDC transmission system typically consists of two converters connected through a DC cable. For long distance, the power converters can be connected either as monopolar configuration or bipolar configuration. The bipolar configuration has the advantage of reliability, i.e. power can be delivered via single cable independently if the other cable is out of service [8]. A simple HVDC transmission system that connects only two networks is commonly known as a point-to-point connection. In this case, only a single remote village can be supplied energy from a national grid, however, to connect multiple remote villages, multi-terminal (MTDC) HVDC system is preferred [15]. This formation reduces the number of long-distance cable connections from the national grid. In a multi-terminal configuration, the converter power rating installed at the national grid substation must be equal to the sum of all the remote village power demand. Unlike a point-to-point configuration, where both converter rating should be same and equal to maximum demand of villages [16], the converter in a MTDC configuration at the remote village side can be of lower power rating. Since the power delivered from the national grid side is unidirectional, the use of a diode-based HVDC link is of particular interest and offers advantages, namely, lower conduction losses, higher reliability, lower installation costs, since gate drivers are not used [17] – [19]. The comparison of diode rectifier with other technologies used for power conversion is shown in Table 1.
| Converter | Pros | Cons |
|---|---|---|
| LCC |
|
|
| VSC |
|
|
| MMC |
|
|
| DR |
|
|
In the bipolar configuration of the HVDC line the power is transferred to the other end by using two conductors one is positive and the other negative. This configuration is converted to the monopolar link in case of a fault and the system on the other end receives 50% power. This is only valid for the network which are connected to the grid on the other end. In case there is only a passive load connected at the receiving end then load management will be needed in order to supply 50% of power to the load.
A DC side fault with a VSC converter having half bridge submodules reverts to a diode rectifier when the IGBTs are immediately blocked by the protection. The diodes are sized to withstand the temporary overcurrent until the AC side circuit breakers are opened. A cable fault is considered a permanent fault and the AC circuit breakers do not reclose. If the DC line fault is detected as being on an overhead DC line, the circuit breakers can reclose after about 250 milliseconds to allow the arc path to deionize. So, the diode rectifier can be designed similarly. Also, DC circuit breakers are not cheap, even for medium DC voltage operation. This paper considers DC cable fault and AC fault on the receiving end. The system is analyzed in the fault scenarios and the system performance is observed using simulations.
Considering a future expansion scenario to remote villages and the need to transmit power of less than 100 MW to multiple villages, the use of multi terminal configuration with VSC is a natural choice. MTDC configuration would allow gradual expansion of the distribution network and increase in transmitted power capacity, while the choice of diode technology for unidirectional power provides reliability and economic benefit. In this paper, MTDC based-VSC system with diode-based rectifier is modeled and analyzed. The national grid converter is modeled as diode rectifier and the remote villages side converter is based on VSC. The VSCs are operating as grid forming converter and its control system is designed in the dq0 rotating frame. The system performance is analyzed using dynamic simulation with the power system software ’DigSilent PowerFactory’. The rest of the paper is organized as follows: section-II explains the modeling of multi-terminal HVDC trans- mission system, the system simulation and analysis are done in section-III, section-IV and V discuss the performance of the system during DC cable fault and AC fault respectively, and section-VI concludes the article.
2. Multi-Terminal HVDC Transmission System Modeling
In the multi-terminal HVDC transmission system, more than one converter is connected using DC cable as shown in Figure 1. There is no reactive power flow in the DC network thus the cable power transfer capability depends solely on active power. In a multi-terminal HVDC system, at least one converter must control the DC voltage to operate the DC network. The converter controlling the DC voltage acts as a slack source which balances the mismatch in power. Other converters can be operated in power control mode to dispatch the power as desired.

Figure 1 - Multi-terminal HVDC transmission system supplying two remote areas
2.1. Voltage Source Converter Control System
The configuration of a voltage source converter system is shown in Figure 2. It consists of switching valves based on IGBTs or MOSFETs, coupling reactor, shunt filter, and a transformer. A coupling reactor is required to control the active and reactive power flow independently and to limit the short circuit current. A shunt filter is also necessary if the converter has two or three level topologies. Together with a series reactor, a shunt filter removes the harmonics from the converter output voltage. A conventional two winding transformer is typically installed in the converter substation to match the point of common coupling (PCC) voltages.
The fundamental principle of active and reactive power flow control is based on (1). According to the equation, active power (P) can be controlled with the difference of PCC and VSC bus voltage angle, and reactive power (Q) is controlled by controlling the difference of voltage magnitude of PCC and VSC bus. Here, l is the inductance of series reactor and ω is the network frequency. It is considered that the series resistance (r) is very small and negligible.
(1)
Voltage source converter can be operated in grid-connected mode or grid-forming mode. In grid connected mode, the converter is synchronized with the grid frequency, and it supports four operational control modes i.e., active power control (p), reactive power control (q), DC voltage control (udc), and AC voltage control (uac). The reference frequency and voltage are controlled by the main grid and the converter is synchronized with it using a phase-locked-loop (PLL) system. In grid-forming mode, the converter controls the network frequency and AC voltage to energize the isolated network. In this mode the converter cannot control the DC voltage; rather it balances the mismatch power in the AC network. This operational mode is suitable to energize the rural network using an HVDC transmission system.
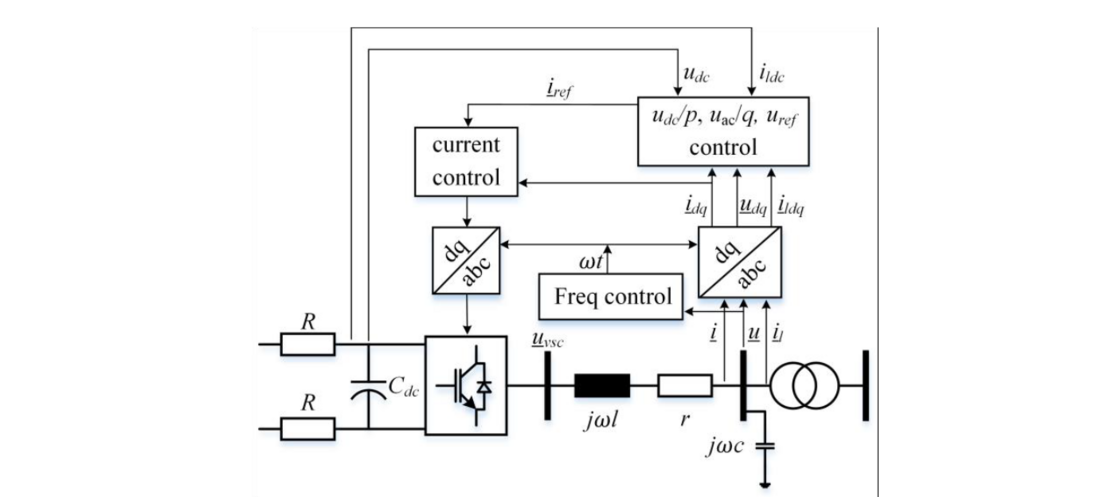
Figure 2 - Voltage source converter control system
As shown in Figure 2, the control system is designed in balanced voltage synchronous rotating frame (dq0), commonly known as vector control method. In vector control method, the time variant three phase AC signal is transformed into time invariant signals so that the control system can be designed in the complex plane. For the balanced system, d-component corresponds to the real part, and q-component of the signal corresponds to the imaginary part, whereas the third component is always zero. Thus, the AC network can be represented by phasor quantities. The VSC converter control system has two main control loops connected in cascaded i.e. primary control and secondary control. Primary control is mainly a current control loop which has fast response time. Secondary control is either the power or voltage control loop and has slow response time compared to primary control. From a modeling point of view, the voltage source converter can be modeled as a controlled voltage source behind the series impedance. The dq-component of the reference voltage signal is generated by the inner current controller which can then be transformed into ABC-system using Clarke transform and the Park transform to generate the switching pattern of the IGBTs or MOSFETs.
Inner Current Control: The dynamic behavior of current flowing through the series reactor can be expressed using (2) and (3). The system equation shows that the current d- and q- components are coupled together and it is a multi-input-multi-output system. This means that the change in current d-component reference command will affect the current q-component that will flow through the series reactor. The decoupling scheme as demonstrated in Figure 3 can be applied to independently control both current components. Consequently, active and reactive power flow through the VSC can be controlled independently of each other.
(2)
Here, uc_d and uc_q are the control signals generated by the inner current controller. ω is the network frequency. ud and uq are the dq-components of controlling bus voltage which is typically capacitor bus as shown in Figure 2. id and iq are the current components flowing through the reactor. uvsc_d and uvsc_q are the generated voltages at the converter busbar.
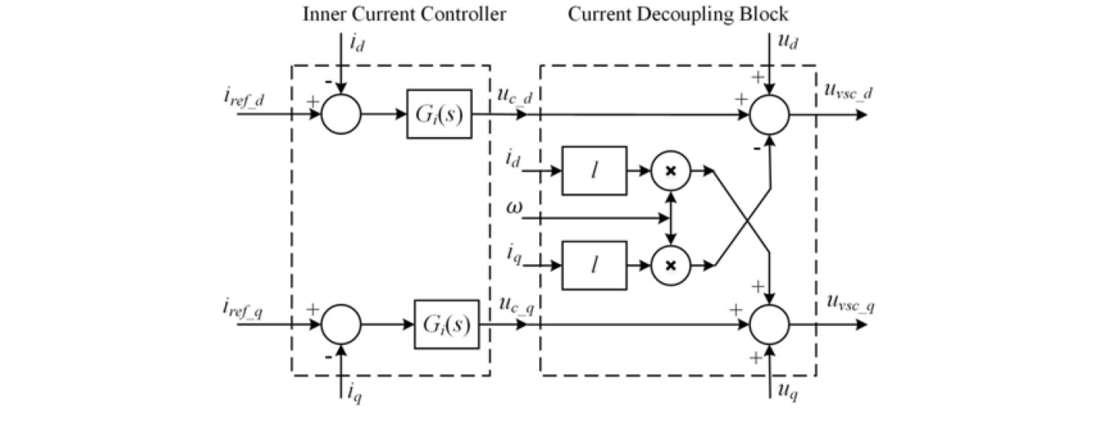
Figure 3 - VSC Inner Current Controller with Decoupling Scheme
Proportional-plus-integral (PI) controller is selected to achieve the zero steady state error for tracking the reference current command. The closed loop control analysis can be performed using (3) as demonstrated in Figure 4. The controller gain can be calculated using (4) by applying internal model control (IMC) method.
(4)
Here, r is the resistance of series reactor, l is the inductance of the reactor, τi is the required time constant of the current control loop. kp and ki are proportional and integral gains respectively.

Figure 4 - Closed Loop Control Block Diagram for Inner Current Controller Gain Selection
Voltage and Frequency Control: The converter at the remote village is required to operate in grid forming mode. In grid forming mode, the reference current command for primary control loop is generated by secondary controller which controls the voltage at the shunt filter busbar. The dynamic behavior of the voltage across the filter capacitor can be expressed by (5) and (6). It can be observed from (5) that the voltage d- and q- components are coupled with each other. Decoupling scheme can be applied as shown in Figure 5 to control the voltage dq-component independently.
(5)
(6)
Here, ic_d and ic_q are the outer voltage controller output signals, il_d and il_q are the load currents, c is the capacitance of the filter, and iref_d and iref_q are the reference command signals for the inner current controller.
The outer voltage controller controls the voltage at a predefined value and imposes the frequency on the network. The set-point value of the voltage uref and the frequency ωref are defined as (7). Here, uref and ωref are 1.0 p.u.
(7)
The closed loop control block diagram of the outer voltage controller is shown in Figure 6. The system model for closed loop analysis is defined using (6). The output voltage is influenced by two inputs i.e., the load current and the voltage set-point, thus it acts as a multi-input-single output system. The load current in the system acts as the disturbance. The objective of the control loop is to reject all the disturbance and track the voltage reference set-point (uref (s)). For zero steady-state error, a PI control scheme is selected. The closed loop transfer function of the system can be defined as (8).
(8)
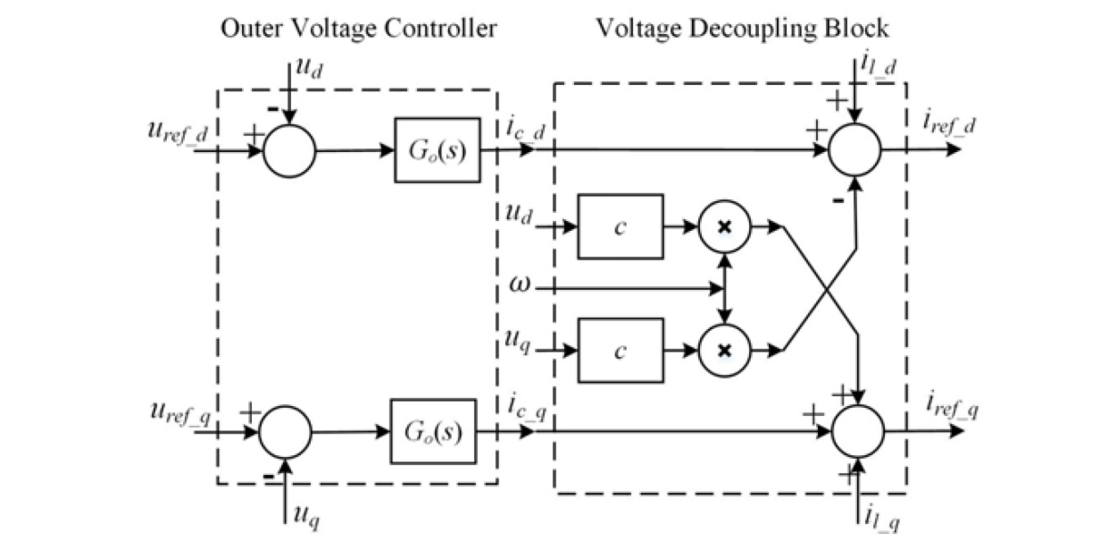
Figure 5 - Reference voltage control system including voltage dq-component decoupling scheme
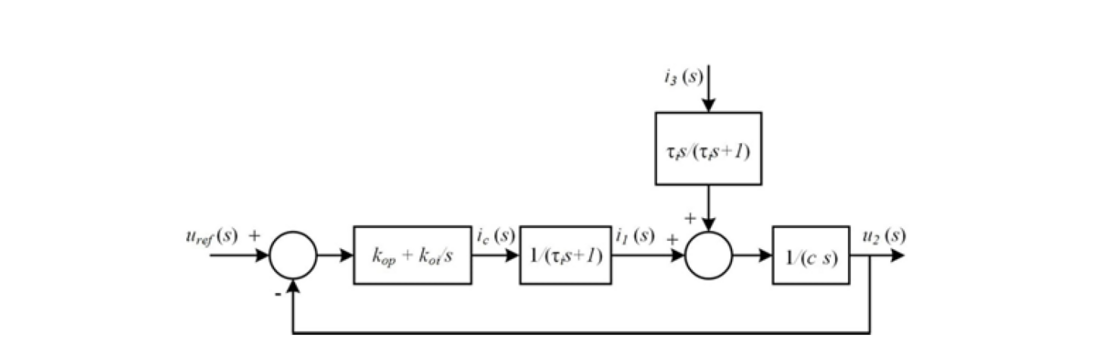
Figure 6 - Closed Loop Control Block Diagram for Inner Current Controller Gain Selection
The stability of the system depends upon the roots of the characteristic equation. By applying Routh Hurwitz criterion, system stability condition has been found as (9).
(9)
Using ITAE standard form of 3rd degree polynomial equation for zero-displacement error, the minimum gain for optimum performance is found as (10).
(10)
2.2. Diode Rectifier for HVDC Transmission Line
The AC to DC current conversion that takes place in the HVDC transmission is the most fundamental process at its transmitting side i.e. grid side. The application of simple diode-based rectifiers instead of controlled rectifiers in HVDC station for remote station is not new and has been adopted in the past for certain systems. The diode rectifier is receiving a lot of interest due to its advantages over the VSC. The advantages include lower losses, higher reliability, and lower installation costs [20]. The application of diode rectifier is getting prominent for offshore wind farm to replace the VSC in order to reduce the weight, size and the cost of the converter [21]. Furthermore, the economic advantage can be substantial e.g. replacing VSC offshore substation with diode rectifier may reduce the overall cost up to 30% [22]. In comparison to thyristor rectifier based HVDC transmission system, diode rectifier based HVDC connection provides higher efficiency and reliability and has smaller installation costs [20].
The basic module of the HVDC converter is a three phase, full wave rectifier as shown in Figure 7 [20]. Power diodes instead of IGBTS, or MOSFETs, are connected together to form a full wave rectifier that converts AC voltage into pulsating DC voltage. The dynamic modeling of such a converter is necessary for system design and analysis. Usually time-varying models are known that account for the converter’s switching behavior. In order to apply classic linear control theory for system stability analysis assessment, time-invariant average models are used. The average model or RMS simulation do not focus on the switching level variation hence ripple voltage of diode rectifier DC capacitor cannot be simulated, however, DC voltage dynamic response with respect to power change can be analysis using following equations.
(11)
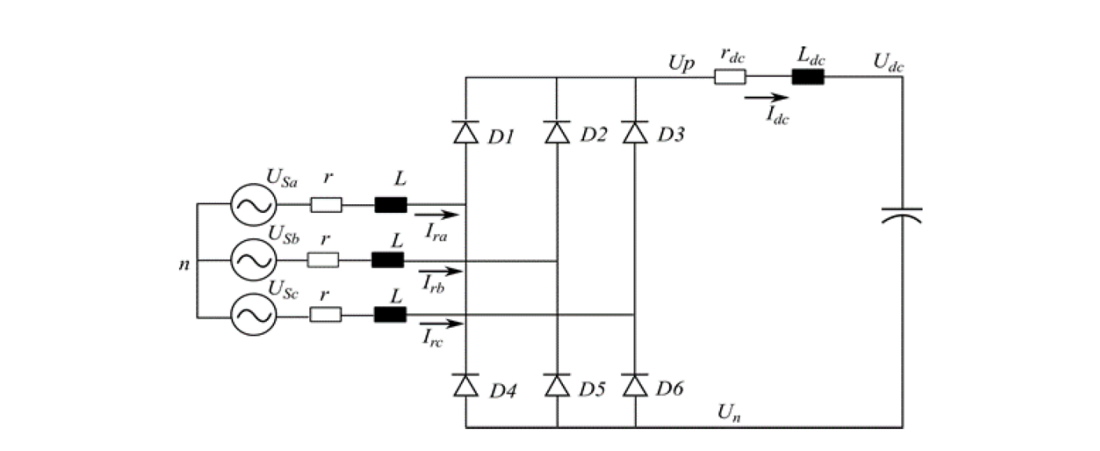
Figure 7 - Six Pulse Diode Based Rectifier
The power system representing the transmission side is modeled as balanced three phase voltage sources, USa, USb and USc with input AC side elements represented by leakage resistance r and inductances L respectively. Similarly, the DC current dynamics are related to AC currents in each phase and can be written as (12).
(12)
2.3. Diode-based HVDC Transmission Line Startup
In the proposed transmission line structure, the prime source of energy is national grid which will energized the complete network. Initially, all loads at remote location connected with the VSC are disconnected and unenergized. The main grid feed power to cover the losses and rectification process starts. The average DC voltage at the rectifier terminal depends on the peak AC phase voltage and can be calculated using (13).
(13)
A DC capacitor is required to keep the DC voltage dynamics within the stable operating range which is calculated using (14).
(14)
Here, Udc (min) is the minimum allowable DC voltage at the diode rectifier terminal to prevent the low voltage at VSC substation, Prt is the rated active power of the rectifier, Udc is rated DC voltages and Usa is the peak phase voltage level. Often a transformer with tap setting is needed to achieve the desired DC voltage level. Once the rated DC voltage is reaches, VSCs at the remote stations are activated consequently respective AC network are energized and normal power flow will continue.
3. System Simulation and Analysis
Multi-terminal HVDC system is suitable at various locations in Pakistan such as in Sibi region of Balochistan. Sibi has a national transmission system substation of 220 kV which can supply the power to remote regions such as Kahan, Mawand, Naharkot, Barkhan, Pir Koh, Dera Bugti etc. A MTDC transmission system can be established between Sibi, Barkhan, and Dera Bugti as illustrated in Figure 8, and from there power can be distributed to other remote villages as well. The DC network will work as the radial network in which first power is supplied through a common DC cable of 102 km length and then extended through two different DC cables of length 73 km to Barkhan and 53 km to Dera Bugti.
The single line diagram to validate the proposed design methodology of supplying electricity to two remote areas using diode based multi-terminal HVDC transmission system is shown in Figure 9. The system including the grid forming converters is modelled and simulated in DigSilent Power factory and the results are shown in subsequent sections. Voltage source converters are supplying energy to two independent grids, whereas a diode-based rectifier is modeled at the national grid side. In the network, the DC voltage is controlled by the diode rectifier which acts as the slack source in the DC network. In this regard, the maximum power rating of the diode rectifier should be equal and greater than the sum of total power consumed at the Barkhan and Dera Bugti region. The maximum demand at Barkhan and Dera Bugti is considered as 55 MW and 45 MW, respectively, for the system analysis forecasting the future growth and need for supplying nearby villages. Thus, the power rating of diode rectifier is 120 MW to fulfill energy demand and compensate the losses. The network parameters are given in Table 2. The network is modeled in the Power System Analysis software named ’PowerFactory’, for RMS simulation. System stability is tested by applying a dynamic load at 11 kV busbar of both VSC substations.
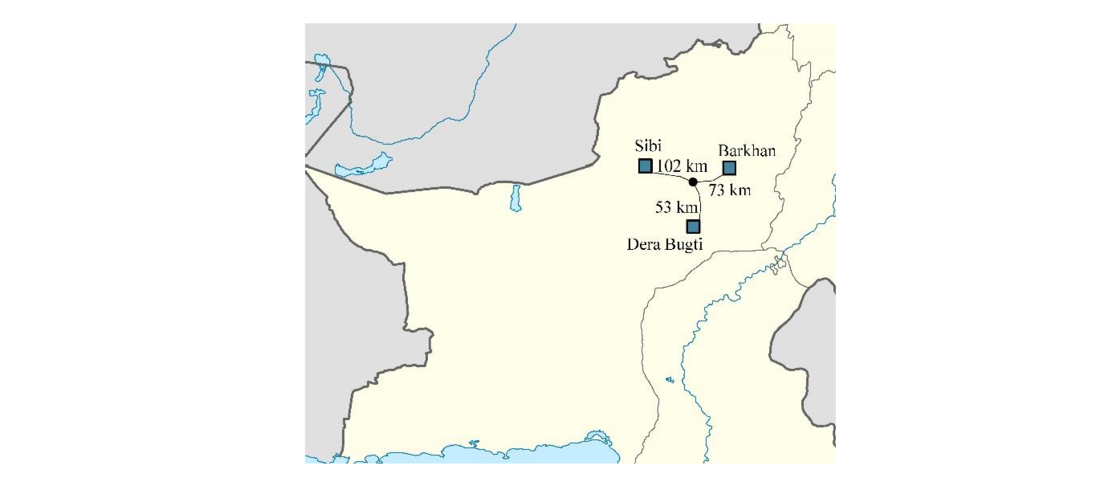
Figure 8 - Application of Multi-Terminal HVDC System in Pakistan
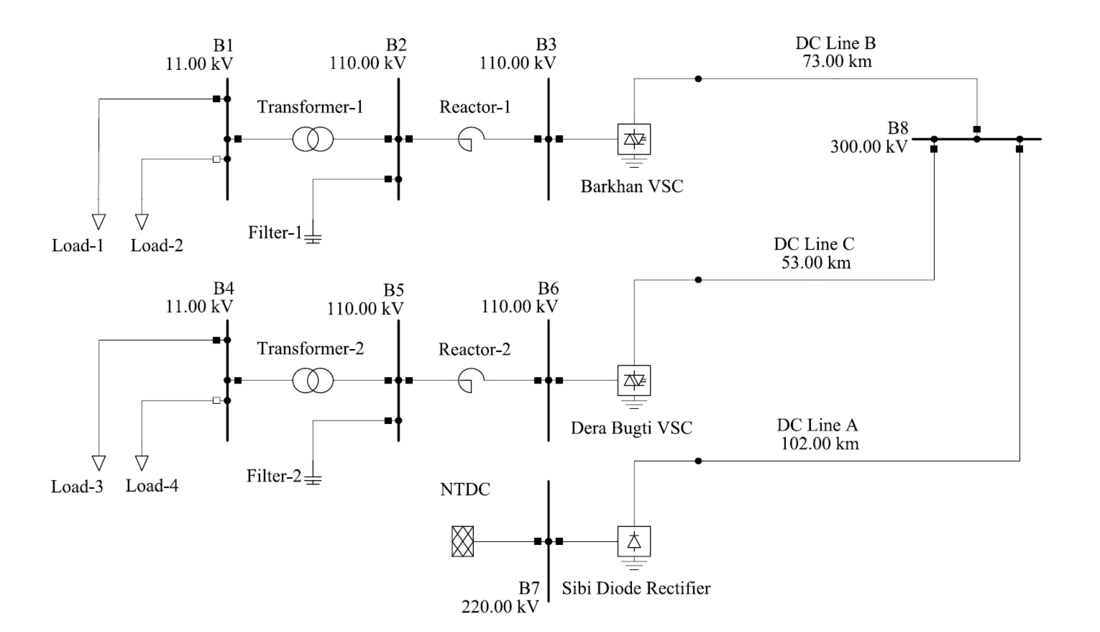
Figure 9 - Case study: System Model of Diode Based Multi-Terminal HVDC System
3.1. Dynamic Load Analysis
Initially, 2.5 MW and 0.25 MVar inductive load is supplied by Barkhan VSC to fulfill ’Load-1’ demand whereas Dera Bugti VSC supplies 5.0 MW and 0.5 MVar inductive power to fulfill ’Load-3’ demand. The control system stability can be verified by applying a disturbance on the system and the system should achieve a new steady-state value after the transient.
The sudden change in the demand acts as the disturbance on the network which will affect the DC voltages, AC voltage and network frequency. Limits in the variation of the network voltage and frequency both in transient and steady state are defined in the grid codes. Typically, the grid code defines the stable frequency range between 49.8 Hz to 50.2 Hz, and the voltage tolerance in the medium voltage distribution network in steady state is ±10%. The dynamic simulation is performed up to 40 sec in which ’Load-2’ is connected to the Barkhan VSC at 10 sec having value 50 MW active power and 10 MVar inductive reactive power, and ’Load-4’ is connected to the Dera Bugti VSC at 30 sec having value of 40 MW active power and 15 MVar inductive reactive power.
| DC Cable | |
| Rated DC Voltage (udc) | 300 kV |
| Cable Resistance | 0.5 Ω/km |
| VSC-Substations | |
| Rated AC Voltage (uac) | 110 kV |
| Series Reactance | 3.5 Ω |
| Shunt Filter | 1.3 uF |
| Transformer Rated Power (Srt) | 70 MVA |
| Transformer Rated Voltage (HV/LV) | 110/11 kV |
| Diode-Substation | |
| Rated Power (Srt) | 150 MVA |
| No Load Losses | 0.5 kW |
| Commutation Reactance | 5 Ω |
| Filter Capacitor | 136 uF |
| National Grid | |
| Rated AC Voltage (uac) | 220 kV |
| Short-circuit Power (Sk) | 1000 MVA |
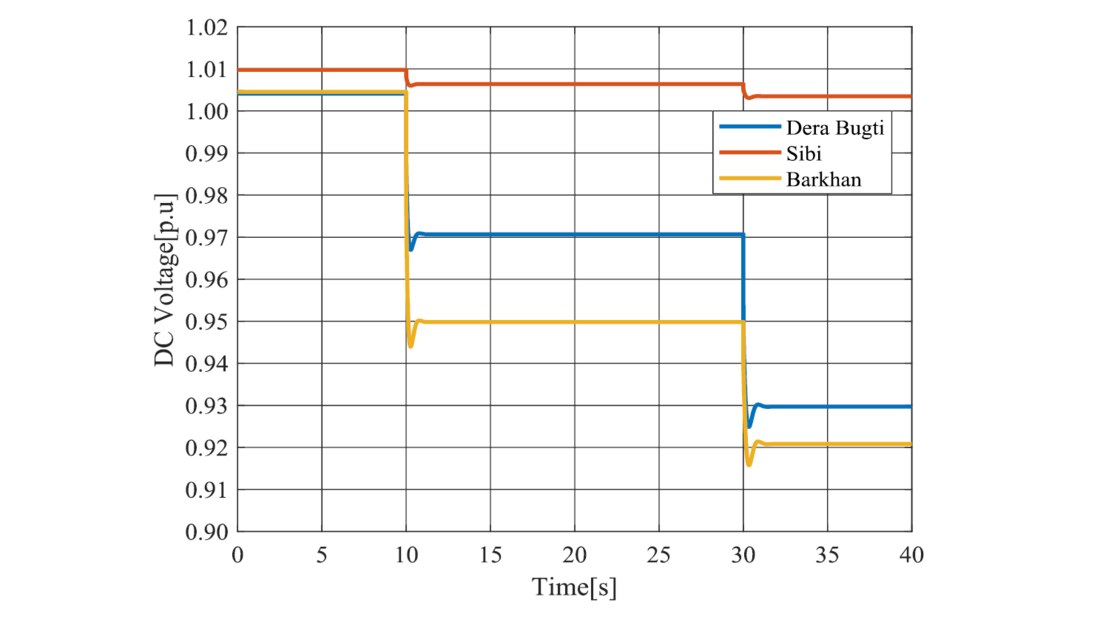
Figure 10 - DC Voltage Response to Dynamic Load Change
The DC voltage response of the network is shown in Figure 10. The voltage at Sibi substation is set higher than the rated voltage i.e. 1.01 p.u to compensate for the voltage drop over the DC cable. Before 10 sec, the active power flow is low, thus there is low voltage drop at the Dera Bugti and Barkhan substation. At 10 sec, load is changed at Barkhan substation, which causes voltage drop due to the increase in DC current. The DC voltage is affected at both substation busbars due to drop at bus ’B8’ which is linked to both stations. The voltage at ’B8’ is 0.9722 p.u. Further, the voltage drop increases at Barkhan as compared to Dera Bugti as there is not additional load current flow toward Dera Bugti. The response of active power is shown in Figure 11. Here, ’VSC-1’ is referring to Barkhan VSC and ’VSC-2’ to Dera Bugti VSC. From the active power response, it can be observed that the national transmission system (NTDC) is supplying active power of 60 MW including losses after 10 sec. The active power losses include the losses in the diode rectifier, both voltage source converter losses, and losses in the DC cables. After connecting the ’Load-4’ at 30 sec, 106 MW active power is supplied over the HVDC transmission system to fulfill both Barkhan and Dera Bugti regions.
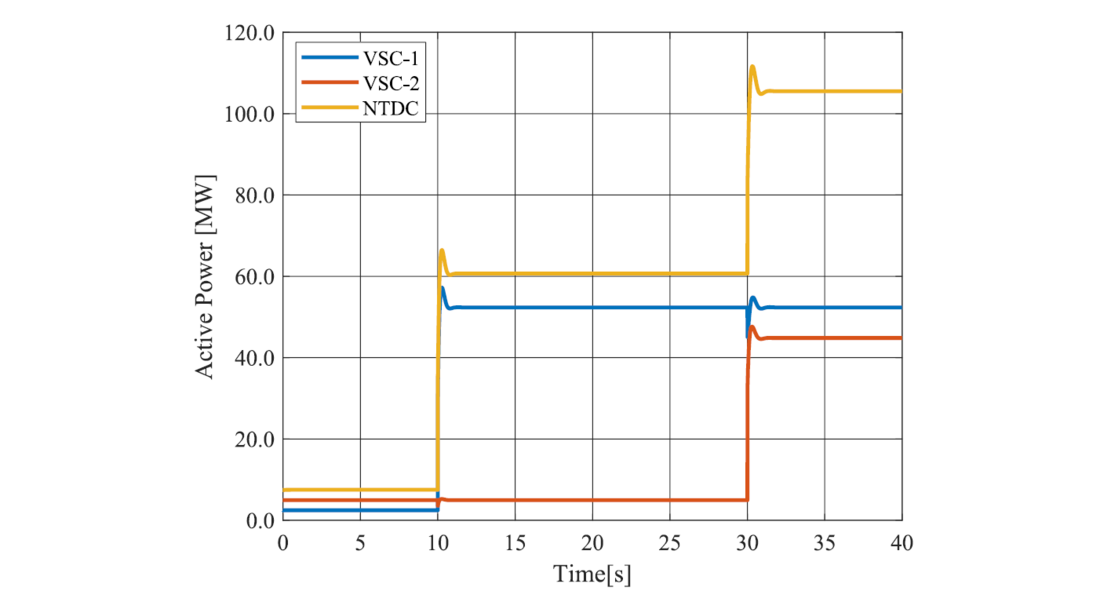
Figure 11 - Active Power Response to Dynamic Load Change
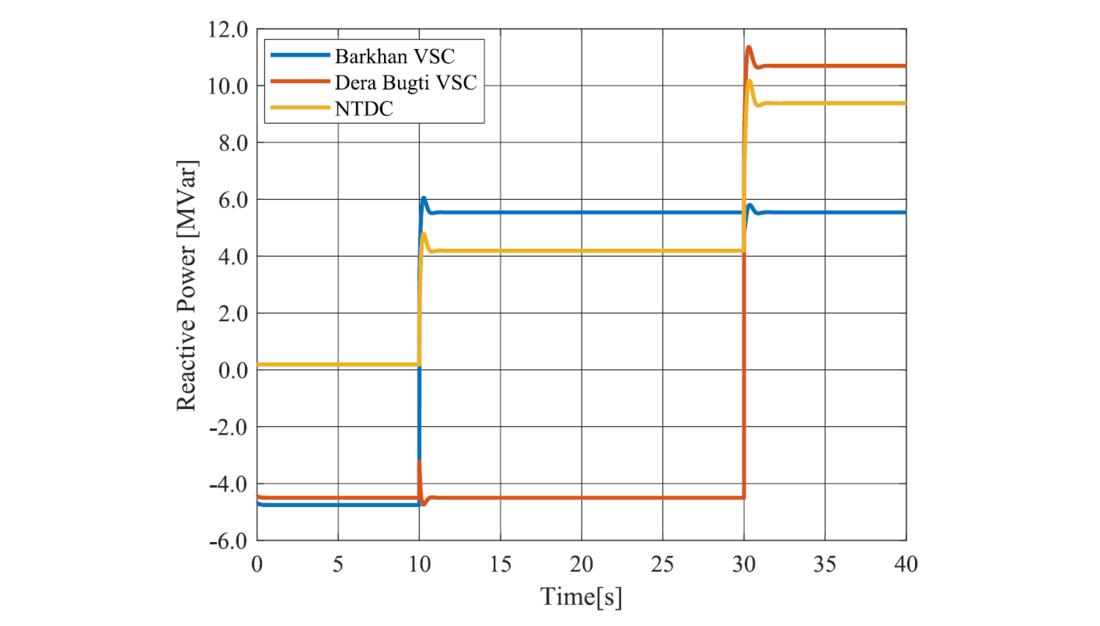
Figure 12 - Reactive Power Response to Dynamic Load Change
Although both regions (Barkhan and Dera Bugti) are not connected in this case study, there is an impact of change in load in one region on another due to impact on DC voltage. This impact is obvious as the ability of the converter to generate the AC signal directly depends on the DC voltage. The transient appears in voltage and active power, however, the signals achieved steady state in approximately 1.0 sec which show that the system is stable and robust.
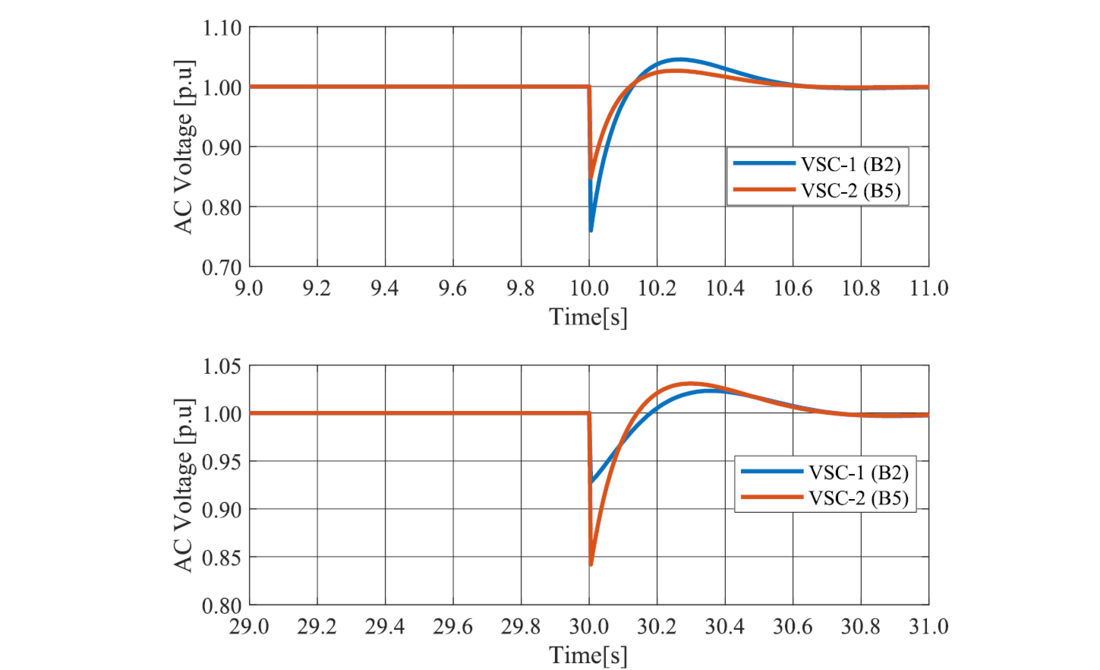
Figure 13 - AC Voltage Response of Dynamic Load Change
Similarly, the reactive power response is shown in Figure 12. Each VSC substations have a 5 MVar capacitive filter. Usually, consumer reactive power demand is inductive. Initially, consumer reactive power demand is low thus the capacitive power is observed mainly by the VSCs. Generator oriented sign convention is applied in the simulation result analysis i.e., negative sign means inductive reactive power. At 10 sec, inductive reactive power demand at Barkhan region is increased, which is fulfilled by both the capacitor filter and VSC. Now, the VSC feeds 5.54 MVar capacitive reactive power into the network. In contrast to diode or thyristor-based rectifier, only VSC has an ability to provide both capacitive and inductive reactive power. This can be observed from Figure 12, that NTDC feeds capacitive reactive power to the diode rectifier at all times. The reactive power demand of the diode rectifier depends on the amount of active power flow. At 106 MW, the diode rectifier required 9.0 MVar of reactive power.
The AC voltage response at the instant of load change is shown in Figure 13. The transient AC voltage at Barkhan substation ’B2’ drop to 0.76 p.u and the maximum voltage reaches to 1.04 p.u. These transients appear for a short period of time and the voltage reaches its steady-state value of 1.0 p.u within 0.6 sec. Again, it can be observed that the voltage at ’B5’ is affected even though no load demand has been changed in the Dera Bugti region. The voltage variation at ’B5’ is lower than at ’B2’. Similarly, the voltage at ’B5’ drops to 0.85 p.u at the instant of load change at 30 sec. The system response is stable and achieved its steady-state value within 0.8 sec.
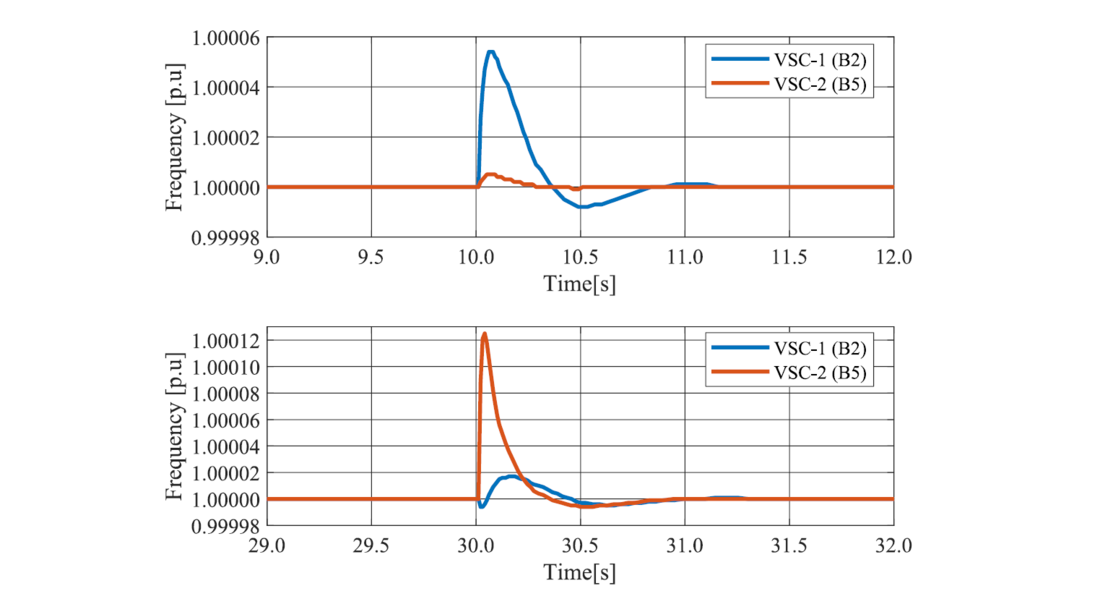
Figure 14 - Frequency Response to Dynamic Load Change
The frequency response of the network is shown in Figure 14. Network frequency must not exceed the limit defined in the grid code. During the transient period, the Barkhan region network frequency increased to 50.0025 Hz and the Dera Bugti region network frequency increased up to 50.006 Hz. The response shows that the change in the network frequency is minimal and fulfills the grid code requirement. Furthermore, the VSC frequency control system is robust and maintains the rated frequency within 1.0 sec and ensures system stability.
3.2. DC Cable Fault Analysis
Avoiding faults in any power system is very difficult task. In this regard, the model shown in Figure 9 is simulated with a solid DC fault at DC line A and the performance of the system is assessed.
The fault is applied at t =0.8 s and it is cleared after 50ms. The DC voltage of the diode rectifier drops to zero as can be observed in Figure 15 (d). The active and reactive power of both VSCs supplying the load to Dera Bugti and Barkhan can be seen to drop to zero in Figure 15 (a) and (b), because the DC voltages is zero and the inverters cannot generate any output AC voltages. The three-phase response of AC voltage at Barkhan VSC bus (B3) is shown in Figure 15 (c). In this case, all the loads connected with the VSCs substation gets load shedding. Once the fault is removed, the system would restore itself and reach its steady state values. Temporary DC cable faults are very rare however such simulation is performed to analyze network dynamics and stability as well as to visualize the startup response of the network with initial state. It can be observed from t = 0.85s onward that the system response is stable and the startup of the whole system is successful within the permissible operating values. The DC voltage is established within 200ms and the initial transient in the AC output voltage is settled within 500ms.
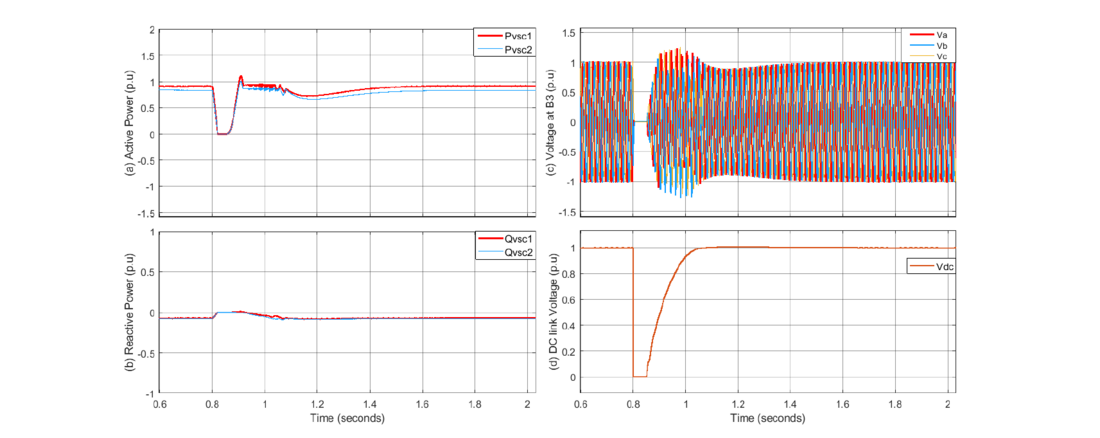
Figure 15 - Waveforms during DC fault (a) Active power of VSCs (b) Reactive power of VSCs (c) AC Voltage at Barkhan Converter Bus (d) DC voltage of Diode Recitfier
The results of a permanent pole to pole DC fault is shown in Figure 16. The location of the fault is same. It can be observed that the DC current increases drastically and the AC breaker at the grid’s sides are opened to intercept the fault current. The primary source of fault current is the national grid feeding through the diode. Diode have the capability to withstand short period high surge current. In this analysis, it is assumed that no DC breakers are installed and the AC breaker is permanently opened after 100ms of the fault occurrence. Figure 16 (a) and (b) shows the active and reactive power of both VSCs and it can be observed that the power becomes zeros as soon as the fault occurs. AC circuit breakers are slow and the rate of change of DC current during fault is very high as shown in Figure 16 (c), consequently the DC current increases up to 25 p.u. After initial transient, DC fault current may reduce slightly due to effects of line and transformer inductance. Furthermore, both remote AC network (Barkhan and Dera Bugti substation) become unenergized since the DC voltage reduces to zero as shown in Figure 16 (d).
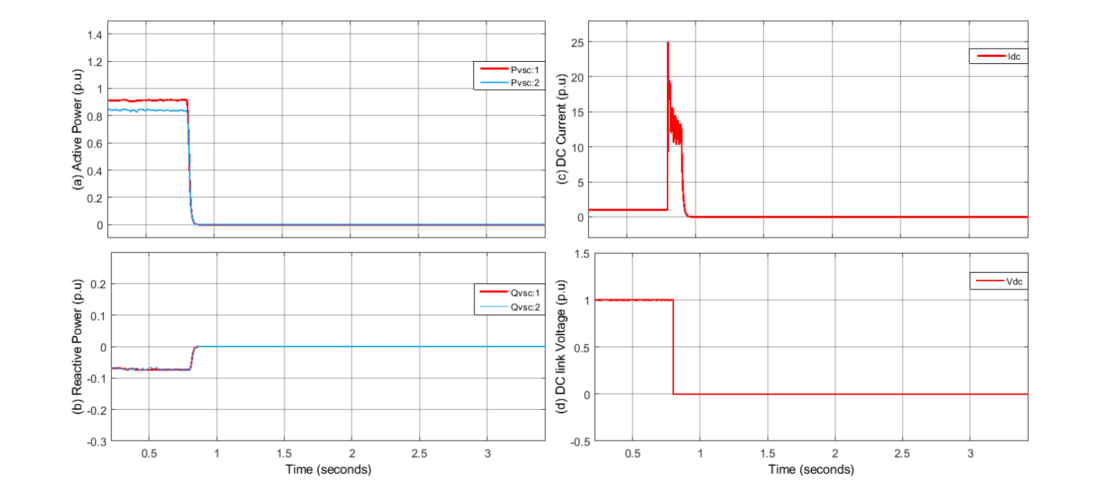
Figure 16 - Permanent DC fault system response (a) active power of VSCs (b) reactive power of VSCs (c) DC current (d) DC voltage at diode rectifer terminal
With bipolar transmission line configuration, if a fault occurs on one pole, 50% of the power can still be supplied through the healthy pole with an earth return. However, loads need to be cut off up to half of the rated power and load management scheme is required to balance the power.
3.3. AC Fault Analysis
In this case a single-phase line to ground fault is simulated at phase b near the load at Barkhan at busbar B1. The fault occurs at t = 1 s and is removed after 100 ms. As can be observed from Figure 17 that the voltage and other parameters are in the permissible range. The active power of Barkhan VSC is distorted a little during fault but remains stable and supplies load via healthy phases as shown in Figure 17 (a). The reactive power is increased to quickly provide the fault current during fault and is shown in Figure 17 (b). The frequency during fault remains between 49.5 Hz and 50.5 Hz which can be confirmed from Figure 17 (c). The three-phase voltage is shown in Figure 17 (d), from which we can observe the occurrence of fault at phase b of the line. From these results we can observe that no significant overvoltage occurs on the healthy phases and the overcurrent occurring due to the fault are not excessive.
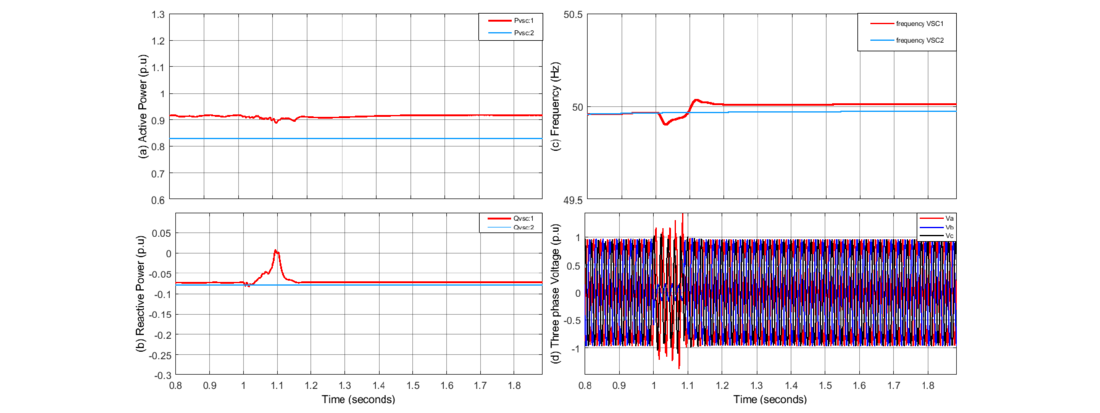
Figure 17 - Waveforms during AC fault (a) Active power of VSCs (b) Reactive power of VSCs (c) Frequency (d) Three phase Voltage
To control the overcurrent, adapted overcurrent limits are applied on the current reference signal. The control diagram for the current limit is shown in Figure 18. Control system limits the magnitude of the current during fault up to iup_limit value which is typically 1.3 p.u as per standards. This means that’s the maximum short circuit should not be more than 30% of the rated converter current. Furthermore, current q-component will be given priority over d-component to support the grid voltage during fault and recovery period.
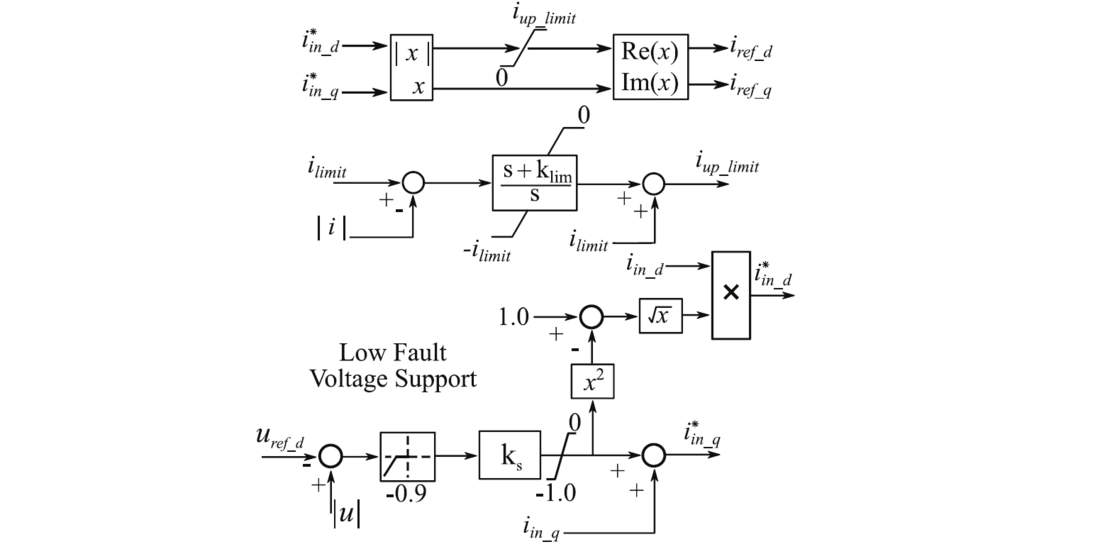
Figure 18 - Low fault voltage support during fault
4. Conclusion
Multi-terminal HVDC systems will be the future of the transmission network, transferring higher power over longer distance. However, much research is needed on the design of MTDC transmission topology considering both economy and operation. In this article, a diode based multi-terminal HVDC transmission system has been proposed. The study proposes that the voltage source converter is needed to supply the remote isolated network however a diode-based rectifier can be employed at the national grid side to reduce cost and to simplify operation. The development and control of a diode-based rectifier is cheaper compared to VSC. The simulation results show that the impact of a load change in one network will appear on the other due to the DC network, however, this impact can be minimized by applying an advanced robust controller. Moreover, the performance of the system is analyzed for DC cable fault and AC fault. It is observed that the system is robust and automatically resumes normal operation after the clearance of the fault.
References
- Z. Khalid and M. Iftikhar-ul husnain, “Restructuring of WAPDA: A Reality or a Myth,” The Pakistan Development Review, vol. 55, pp. 349– 360, dec 2016.
- O. Rauf, S. Wang, P. Yuan, and J. Tan, “An overview of energy status and development in Pakistan,” Renewable and Sustainable Energy Reviews, vol. 48, pp. 892–931, aug 2015.
- M. A. Abdel-Moamen, S. A. Shaaban and F. Jurado, "France-Spain HVDC transmission system with hybrid modular multilevel converter and alternate-arm converter," 2017 Innovations in Power and Advanced Computing Technologies (i-PACT), 2017, pp. 1-6, doi: 10.1109/IPACT.2017.8245001.
- M. Bahrman and B. Johnson, “The ABCs of HVDC transmission technologies,” IEEE Power and Energy Magazine, vol. 5, pp. 32–44, mar 2007.
- D. Van Hertem and M. Ghandhari, “Multi-terminal VSC HVDC for the European supergrid: Obstacles,” Renewable and Sustainable Energy Reviews, vol. 14, pp. 3156–3163, dec 2010.
- P. Rodriguez and K. Rouzbehi, “Multi-terminal DC grids: challenges and prospects,” Journal of Modern Power Systems and Clean Energy, vol. 5, pp. 515–523, jul 2017.
- R. Ryndzionek and Ł. Sienkiewicz, “Evolution of the HVDC Link Connecting Offshore Wind Farms to Onshore Power Systems,” Energies, vol. 13, p. 1914, apr 2020.
- Z. E. Al-Haiki and A. N. Shaikh-Nasser, “Power transmission to distant Offshore facilities,” in 2009 Record of Conference Papers - Industry Applications Society 56th Annual Petruleum and Chemical Industry Conference, pp. 1–5, IEEE, sep 2009.
- M. Barnes, D. Van Hertem, S. P. Teeuwsen, and M. Callavik, “HVDC Systems in Smart Grids,” Proceedings of the IEEE, vol. 105, pp. 2082– 2098, nov 2017.
- J. Glasdam, J. Hjerrild, L. H. Kocewiak, and C. L. Bak, “Review on multi-level voltage source converter based HVDC technologies for grid connection of large offshore wind farms,” in 2012 IEEE International Conference on Power System Technology (POWERCON), pp. 1–6, IEEE, oct 2012.
- L. Qun-Liu and C. Xia-Liu, “VSCs-HVDC may improve the Electrical Grid Architecture in future world,” Renewable and Sustainable Energy Reviews, vol. 62, pp. 1162–1170, sep 2016.
- N. Flourentzou, V. Agelidis, and G. Demetriades, “VSC-Based HVDC Power Transmission Systems: An Overview,” IEEE Transactions on Power Electronics, vol. 24, pp. 592–602, mar 2009.
- B. Shen, S. Wang, L. Fu, and J. Liang, “Design and Comparison of Feasible Control Systems for VSC-HVDC Transmission System,” in 2014 2nd International Conference on Artificial Intelligence, Modelling and Simulation, pp. 234–239, IEEE, nov 2014.
- M. A. Hannan, I. Hussin, P. J. Ker, M. M. Hoque, M. S. Hossain Lipu, A. Hussain, M. S. A. Rahman, C. W. M. Faizal, and F. Blaabjerg,“Advanced Control Strategies of VSC Based HVDC Transmission System: Issues and Potential Recommendations,” IEEE Access, vol. 6,pp. 78352–78369, 2018.
- R. Li, L. Yu, and L. Xu, “Operation of offshore wind farms connected with DRU-HVDC transmission systems with special consideration of faults,” Global Energy Interconnection, vol. 1, pp. 608–617, dec 2018.
- J. Zhu and C. Booth, “Future multi-terminal HVDC transmission systems using voltage source converters,” in 45th International Universities Power Engineering Conference UPEC2010, (Cardiff, Wales), IEEE, dec 2010.
- R. Blasco-Gimenez, S. AnıVillalba, J. Rodrıguez-D Derlee, S. Bernal-Perez, and F. Morant, “Diode-based HVdc link for the connection of large offshore wind farms,” IEEE Transactions on Energy Conversion, vol. 26, pp. 615–626, jun 2011.
- Chae, Kang, Song, and Kim, “Analysis of the Jeju Island Power System with an Offshore Wind Farm Applied to a Diode Rectifier HVDC,” Energies, vol. 12, p. 4515, nov 2019.
- D. Herrera, E. Galvan, and J. M. Carrasco, “Method for controlling voltage and frequency of the local offshore grid responsible for connecting large offshore commercial wind turbines with the rectifier diode based HVDC-link applied to an external controller,” IET Electric Power Applications, vol. 11, pp. 1509–1516, nov 2017.
- I. Flaten, G. Bergna-Diaz, S. Sanchez, and E. Tedeschi, “Control of HVDC systems based on diode rectifier for offshore wind farm applications,” Energy Procedia, vol. 137, pp. 406–413, oct 2017.
- Y. Chang and X. Cai, “Hybrid Topology of a Diode-Rectifier-Based HVDC System for Offshore Wind Farms,” IEEE J. Emerg. Sel. Top. Power Electron., vol. 7, no. 3, pp. 2116–2128, Sep. 2019.
- R. Li, L. Yu, and L. Xu, “Offshore AC Fault Protection of Diode Rectifier Unit-Based HVdc System for Wind Energy Transmission,” IEEE Trans. Ind. Electron., vol. 66, no. 7, pp. 5289–5299, Jul. 2019.