Impact chains’ analysis for making resilient the distribution system
Authors
G. PISANO, G. CELLI, F. PILO, G.G. SOMA - University of Cagliari, Italy

Summary
Climate changes are making extreme weather events capable to cause disasters and stop the delivery of vital services more frequent. The power system is an example of a critical infrastructure extremely vulnerable to such weather events. The distribution system feeds the final uses of energy and its disservices immediately impacts people and enterprises. Furthermore, the reliability indicators of power distribution are not as good as in the generation or in the transmission systems for reasons that span from the weakly meshed topological structure to the still limited use of automation, even though many countries are obtaining fast improvements with the use of advanced fault location, isolation and service restoration systems. In recent years, developing strategies for adapting the infrastructures to the risk of extreme events has become a hot research area to pursue. Still, most studies involve the transmission system only, but nowadays the distribution system cannot be disregarded.
The lack of design tools that may help managers consider the trade-off between resilience and cost in distribution systems needs to be covered. The paper proposes a framework for evaluating the resilience of a distribution network serving a given geographical area. Such a framework exploits the impact chains’ analysis that, starting from specific hazards (e.g., windstorms, earthquakes, etc.), assesses the exposure and vulnerability of the portion of the understudy network to evaluate the final risk. Making the distribution system stronger (i.e., hardening the network), more reliable (i.e., increasing the number of redundant paths), or smarter (i.e., by adopting non-network measures that exploit Smart Grid technologies) are the options analysed with suitable indicators. The test of the methodology on a case study demonstrates the applicability of the model in distribution planning.
Keywords
Resilience - Reliability - Distribution Networks1. Introduction
Climate change is increasing the occurrence of natural disasters. For these reasons, the resilience of power systems is on the top of policymakers’ and regulators’ agendas. A resilient power system is intended to handle low-probability, extremely high-risk events, including severe natural disasters.
Power systems have a design based on reliability principles, i.e., they were primarily planned to be able to supply all load points during normal operating conditions and limits as much as possible the effects of single network outages. In contrast, load recovery and support in the face of extreme disasters (multiple simultaneous outages) were not a primary focus of concern [1]. In recent years, research and supporting tools have been geared toward designing and operating modern power grids that are secure and reliable not only in normal operating conditions but also versus the known and predictable threats and resilient against extreme and unpredictable events [2]. Utilities must then plan development actions for a more resilient power system. Due to the higher redundancy, reserve availability and controllable generation in the transmission system, the distribution represents the weak link of a resilient power system. Indeed, historical data indicate that 90% of power outages involve the distribution system. Distribution networks are weakly meshed and radially operated with most of the connected generation not programmable. Therefore, electric distribution grid resilience has become a hot research area in the last few years. In this context, exploiting Smart Grid (SG) technologies is crucial to improving resilience and limiting network investments.
Even though a unique definition of resilience does not exist, it can be described as the ability of a system to anticipate, resist, adapt to, and recover from a disturbance. Reliability differs from resilience since it does not generally consider multiple instantaneous component failures, unexpected events, and system recovery performances. Therefore, a highly reliable power system is not necessarily resilient.
This paper proposes a framework for evaluating the resilience of a given distribution network and investigates the potential impact of different measures for improving system resilience. Besides the infrastructure reinforcement, such as undergrounding distribution lines or incrementing the network redundancy that makes the system stronger and bigger, non-network solutions that make the network smarter are simulated. Examples of smart measures are intentional islanding, the use of Distributed Energy Resources Management Systems (DERMS), and network reconfiguration through distribution automation.
To include the impact of such measures in a design tool and plan a more resilient electric distribution system, resilience has to be measured with a quantitative metric. The metric should at least consider both the distribution system robustness against the disturbance and the system rapidity to restore the pre-disturbance performance level. For this reason, the resilience area model can be applied to the electric distribution system to better assess the impact of specific resilience strategies (Figure 1). This metric allows resuming both the system properties of robustness, adaptation, and rapidity to recover in a single index.
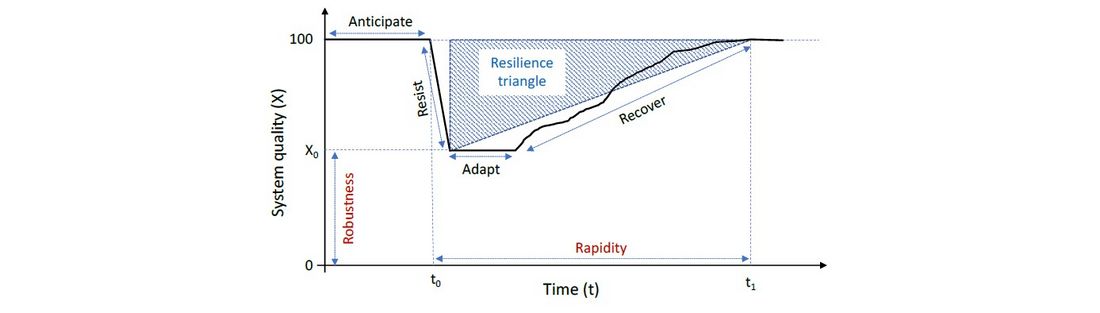
Figure 1 - The resilience area
The proposed methodology aims firstly at characterising the hazard, then at modelling the vulnerability of the system components with regards to specific threats, and finally at simulating the system response with the existing configuration when solutions for improving the system resilience are adopted. Due to the intrinsic uncertainties that characterise resilience studies, a probabilistic approach is unavoidable. For this reason, Monte Carlo simulations are performed to evaluate the vulnerability of the system components and to estimate the restoration time. The alternatives are compared using the resilience area as a quantitative metric of the benefits (i.e., the smaller the area, the more resilient the network) and the cost of implementing the alternative measures.
The proposed methodology is general enough to be suitable for many hazards. Still, the available information influences the results, i.e., the more specific data about the impact of the dangerous event on the system components and the more precise information about the possible event space-time evolution, the more reliable the results.
2. Metrics for measuring resilience
Many indicators have been proposed to evaluate the resilience of electric power systems and compare different solutions for improving their performance. Most of them are related to transmission systems but can also be adapted for distribution systems. Some indicators are the same used for reliability studies, like the Loss of Load Frequency (LOLF) and the Loss of Load Expectation (LOLE), that in [3] are calculated with a Sequential Monte Carlo that generates a large number of cases with different Times To Failure (TTFs) and Times To Repair (TTRs). For capturing the power system performance during the different phases, the scientific Literature proposes a set of indicators for the resilience metric, distinguished by the stage they refer to. The considered steps may be pre, during, and post-disaster, as in [4], or disturbance progress, post-disturbance degraded, and restorative phase, as in [5] and [6]. In [4] more than 15 metrics are used. Despite the analysis precision and extent, it is clear that the more the metrics, the more difficult comparing the alternatives. The multi-criteria optimisation is the technique to be used with a high number of metrics. In practical applications, the number of indicators is kept small to make resilience studies affordable by companies and DSOs. In Italy, for example, the biggest DSO calculates the outage risk (product of the probability by the impact) of each secondary substation in case of severe snowstorm events according to the Regulation that incentives the improvement of the distribution grid robustness. The resilience index adopted is the inverse of the risk index. The outage probability is the inverse of the return period, defined as the mean interval between successive recurrences of a climatic event of a defined magnitude. The impact is the number of low voltage (LV) users affected by the outage, which equals the number of customers supplied by the faulted secondary substation [7].
which equals the number of customers supplied by the faulted secondary substation [7]. One method widely used in Literature for quantifying resilience is the resilience triangle, as in [8], or its extension, the resilience trapezoid [5]. Such metrics have the advantage of considering, at the same time, the impact on the system quality and the recovery time, i.e., the rapidity of restoring the pre-contingency conditions. Indeed, by analysing the triangle or the trapezoid, further resilience indexes related to how fast the disaster evolves, how low the system quality drops, how extensive the phase of damaged component individuation is, and how promptly the system operator restores the service can be assessed [5].
The metric R used in this paper is based on the resilience trapezoid area [5]. The resilience area is calculated as in (1).
(1)
where X(t) is the system quality, and t0 and t1 are the critical event's initial and final time steps, respectively (Figure 1).
The two main dimensions of the resilience area are:
- the system quality (vertical axis of Figure 1) that measures both the speed of the hazard evolution and the deep of the system quality reduction, and,
- the basis (horizontal axis of Figure 1) that measures the cumulative restoration time (i.e., from the event to the complete restoration of the quality at the pre-disturbance level).
The system quality can be assessed with many of the mentioned reliability/resilience metrics. The most common is the Energy Not Supplied (ENS). Although the ENS is convenient for estimating the damages arising from a fault in power systems during normal conditions, when the restoration time is usually acceptable, during extreme events, it is more proper to count the number of customers that are not reached by the service. In this paper, the number of customers affected by the outage defines the deepness of the area that quantifies how much the system resists the hazard as required by the Italian regulatory framework. The duration of the system adaptation to the hazard strictly depends on the DSO’s capacity to identify the faulted components' location and organise the restoration phase. The latter is further influenced by the availability of maintenance crews and the time taken to repair each faulted component, which may be much longer than in normal conditions.
3. Distribution system resilience modelling
Reliable power systems can become unreliable during catastrophic events. Therefore, models different from the ones used for reliability studies are needed to study system resilience.
The following fundamental steps can summarise the proposed methodology:
- hazard characterisation that aims at modelling the extreme event,
- system component vulnerability modelling,
- technical solutions for improving the system resilience identification, and
- system response assessment.
When alternative development options must be assessed with a cost-benefit analysis, these four fundamental steps are applied iteratively.
3.1. Hazard characterisation
Natural hazards that affect the power system may be related to extreme temperatures, such as during heavy snowfalls, heatwaves, or even bushfires, or intense forces, such as hurricanes, earthquakes, tornadoes, floods, tsunamis, etc. Furthermore, mainly at the distribution network level, non-negligible dangerous effects can be attributed to severe windstorms that are much more frequent than other disasters.
Human-made hazards may be cybersecurity attacks or terroristic acts. They undermine both the security of the installations and the safety of people. For clarity, the rest of the paper focuses on natural disasters only and disregards human attacks.
Each hazard has its peculiarities, and it is not easy to characterise it with only one representative parameter. However, only one parameter that is more representative of the dangerous event concerning the impact that the threat may have on the power system components should be identified to assess the effectiveness of the adopted measures. Examples of unique parameters for characterising adverse events are the wind speed for windstorms [3], [5], hurricanes [9] and tornadoes; ice accretion (based on the snow precipitation) for the snowstorms [7]; the peak ground acceleration for the earthquakes [10]; etc.
Besides identifying the relevant parameter for each threat, it is essential to characterise it in terms of space-time evolution. Since the geographical area covered by the transmission systems is vast, splitting the area into weather regions is fundamental. On the contrary, due to the limited extension of a single distribution network, exposure to similar weather conditions at any given time is a generally accepted assumption [3]. For this reason, in this paper, the weather is the same in the area covered by the distribution network.
Considering hazard time evolution is crucial for adequately modelling the system behaviour against adverse weather. For example, the hazard duration can impede sending out maintenance crews until the weather event is ceased. But, if the DSO has prepared a suitable defence plan that defines the recovery operation scheduling, the maintenance crews' activity can be anticipated. In any case, the event evolution strongly impacts the time taken by the adaptation phase. For considering the inherent uncertainty that characterises the hazard evolution and the adaptation time, in the paper, the duration of the event and the time taken by the DSO for identifying the faulted components are assumed indistinct, and the corresponding value is randomly extracted from an exponential distribution, as well as the TTR.
3.2. System component vulnerability
Due to their design characteristics, the distribution network components suffer more from natural hazard damage than the more robust transmission structures. However, regarding their risk of failure, the components of both systems can be treated in the same way. The lines are the most susceptible to failure among power system components during a disaster. Underground cables suffer from high temperatures induced by heatwaves. The most fragile elements of overhead lines can collapse even during light windstorms or earthquakes. Both conductors and poles of overhead lines can downfall to the wind pressure, but falling trees and flying debris may also impact poles and conductors and contribute to their failure. The fragility of these system components is even exacerbated by the age of installations [9].
In reliability studies, assessing the system component vulnerability needs a probabilistic approach since it is the only one to properly evaluate the system performance against various hazards by incorporating the relevant uncertainties. In Literature, the concept of fragility curve is widely used, representing the probabilistic behaviour of a specific system component against adverse weather [3], [5], [9]. In the context of this paper, fragility curves are established as statistical tools which represent the probability of exceeding a given (potential) damage state (or performance) during the natural disaster considered in the analysis.
When an extreme event occurs, the failure probability of a given system component should be modelled only by performing data analytics derived from history and relevant statistical data. However, it is difficult to find statistics in this field, especially in distribution systems. The curves highlight two critical values: the lower value and the extreme condition. The lower value indicates which value of the hazard parameter starts impacting the specific system component failure probability. The extreme condition expresses the condition that leads to an inevitable system component failure (the failure probability equals 1). Between these two critical values, the curve can be considered almost linear. In the case study proposed in the following sections, the fragility curve of an overhead line is presented, according to [3], [5] and [11].
3.3. Solutions for improving resilience
The different development options to make the distribution stronger, bigger, or smarter must be measured with suitable indicators [10].
Solutions that make a network stronger are the ones that reduce the vulnerability of the system components for the specific hazard considered. For instance, substituting overhead lines with underground cables will nullify the probability of failure during extreme winds, snowfall, hurricanes, and tornadoes; resorting to overhead insulated cables can be a good compromise option in many cases. The underground cables can help reduce the likelihood of failure caused by earthquakes. Other measures that increase the strength and robustness of overhead lines include reinforcing the conductors (e.g., increasing their cross-section or insulating the bared ones) and the poles (e.g., substituting the aged ones with new installations). These last solutions have the effect of translating the fragility curve to the right.
Increasing the number of redundant paths connecting the busses with meshing leads to a bigger network (e.g., increasing the number of emergency ties, normally open but closed during critical conditions). It is worth noticing that meshing increases the distribution network resilience only if the primary substations and the upstream transmission network do not suffer the considered disaster. However, making the system bigger and stronger increases its resilience but implies high capital expenditures.
The solutions that make the network smarter, often called non-network solutions, can significantly improve resilience with fewer capital expenditures. The non-network solutions are essentially dependent on advanced network automation. In this context, the self-healing technologies of SG can play a crucial role in increasing resilience, acting in different directions. The ICT in SG enables or improves DSO awareness, real-time monitoring, management of crews and advanced network reconfiguration with intentional islanding. The intentional islanding can involve small local LV networks (basic solution, LV microgrid) or wider MV networks with several generators feeding more secondary substations with the relevant LV loads (advanced solution, MV microgrid).
If SG technologies are used, probabilistic methods are even more critical for resilience analysis. SG technologies can impact both the system's robustness and rapidity of recovery. Still, they depend on the probability of other critical infrastructures being healthy during the same extreme adverse event and on the availability of the used resources. Thus, the risk of using the SG to increase resilience must be carefully assessed when non-network actions are compared with network ones.
3.4. System response assessment
A Monte Carlo (MC) simulation obtains the system response assessment. MC requires i) the hazard characterisation with the value of the representative indicator; ii) the definition of the failure probability for each system component with the relevant fragility curve; iii) the scenario definition (that can include a development option to assess its impact on resilience). In particular, M scenarios of outage are built. Firstly, random numbers for each fallible element are extracted in the range [0,1]. If the random number is smaller than the probability of failure corresponding to the intensity of the hazard in its fragility curve, the system component is considered faulted; otherwise, it resists the threat. More than one system component can result failed simultaneously (i.e., this overcomes the N-1 reliability studies).
The fault time is randomly chosen for each faulted component with the exponential distribution typical of non-aged elements. Finally, the TTR is calculated with the relevant exponential distribution. The TTR represents the increment of the typical mean time to repair (MTTR) used in normal conditions for reliability studies (e.g., 8 hours for underground cables and 5 hours for overhead lines). Each faulted component remains out of service for the relevant TTR. Each outage scenario is defined with a sequence of zeros and ones for each system component for the entire study period. The stop criterion for the MC cycle is the maximum number of iterations or a given threshold ? to the convergence parameter ?n, calculated as in (2).
(2)
where ? is the number of the current extraction and ?(?1,..., ?n) and ?(?1,..., ?n) are respectively the variance, and the mean value of the resilience area calculated until the ?-th extraction.
According to (2), the quality of service is assessed when the MC algorithm converges. The expected number of customers affected by the outage is then known, and the quality of the recovery plan can be evaluated. The recovery plan is simulated by considering a given available number of crews. Assuming that one crew is necessary for recovering one by one the faulted system components, if the number of maintenance crews is greater than the faulted components resulting in a simulated outage scenario, all repairs can start simultaneously. According to the extracted TTR, one crew may finish the work before the others, but the cumulative recovery time equals the longest TTR. Otherwise, if the number of crews is smaller than the number of faulted system components, the DSO should list all the needed interventions by considering the possible priorities. Maximising the number of customers to be recovered, recovering first the essential services (e.g., hospitals), and considering the difficulties in reaching specific sites are typical examples of priorities. If no precise information is available, a random list can be created to identify the evolution of the recovery phase.
4. Case study and discussion
The proposed methodology has been applied to the small portion of the Italian distribution system shown in Figure 2.
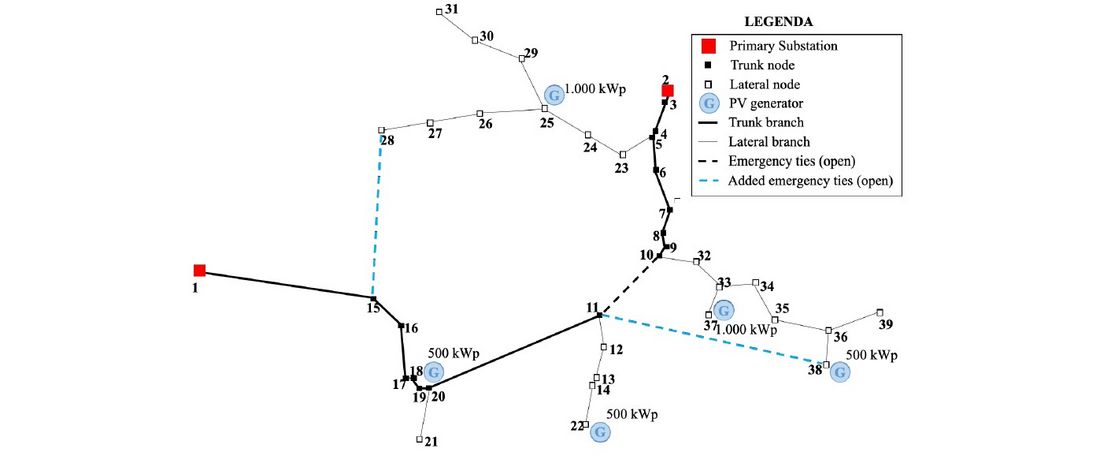
Figure 2 - Test network
The test network is constituted of 39 MV/LV nodes (20 trunk and 19 lateral nodes) supplied by two primary substations that, together with 5 PV generators (with nominal power of 3.5 MWp), feed about 600 LV customers. The network is in a rural area with mostly overhead lines. The trunk branches’ total length is 23 km, while the total length of the lateral branches is 24 km. The considered hazards are:
- severe windstorm with 25 m/s gusts.
- earthquake with an intensity level equivalent to Mercalli VII degree, perceived as “strong” by the people, with an expected “moderate” damage. According to these assumptions, representing the most frequent earthquake in Italy, the peak ground acceleration equals 0.3 g.
Figure 3 and Figure 4 show the fragility curves that model the vulnerability of the system components (i.e., the overhead lines (OHLs) and the undergrounding cables (UCs)) for windstorms and earthquakes, respectively.
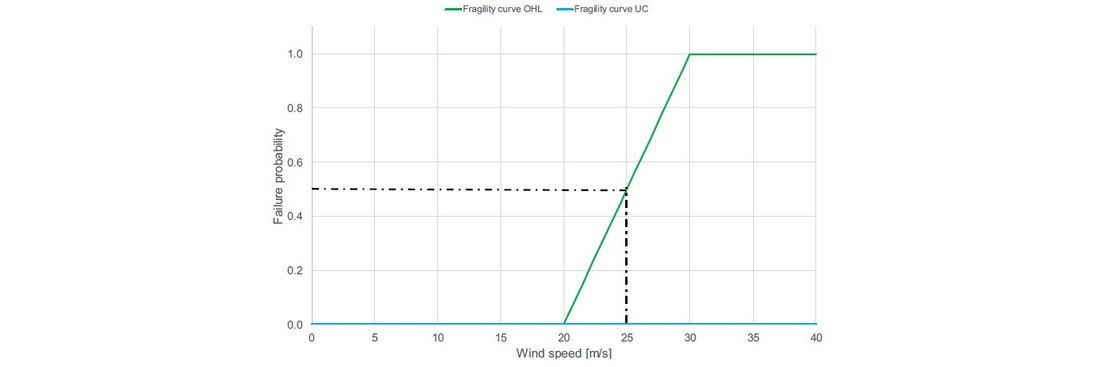
Figure 3 - Fragility curves adopted in the studies for the windstorm events
The probability of UC failures for windstorms is practically null. For earthquakes, the damage to the underground cables happens only in case of ground liquefaction. Such an effect of earthquakes is not included in the present case study. Therefore, the probability of UC failures has also been nullified for the earthquake events.
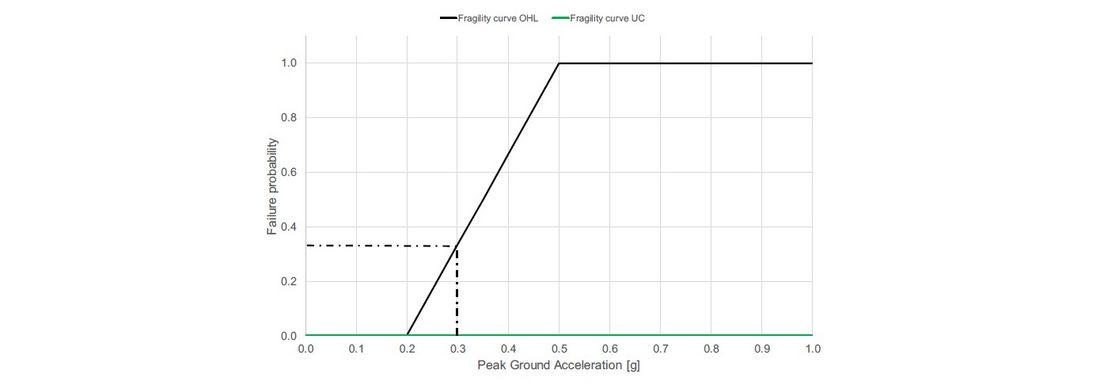
Figure 4 - Fragility curves adopted in the studies for the earthquake events
The implemented solutions, compared with the benchmark (AS-IS condition), make the network:
- STRONGER 1 (STR1), by substituting the OHL trunk branches with UC,
- STRONGER 2 (STR2), by replacing two main OHL lateral branches with UC (i.e., the laterals starting from node 5 and node 10 of Figure 2),
- BIGGER (BIG), by adding two emergency ties (the light blue ones in Figure 2),
- SMARTER basic (LV_MG), which implements the LV microgrid subdivision of the network (nodes 18, 22, 25, 37, and 38), and
- SMARTER advanced (MV_MG), which implements the MV microgrid subdivision of the network.
The unitary costs considered for assessing the total cost of each solution are reported in Table 1. It is supposed that the new emergency ties will be OHL and that the cost of substituting OHL with UC includes the OHL decommissioning (i.e., 20% of the new OHL cost).
| Technical solution | Cost |
|---|---|
| Substitution of OHL with UC (STR1, STR2) | 240 [k€/km] |
| New emergency tie (BIG) | 100 [k€/km] |
| Energy storage system (LV_MG, MV_MG) | 400 [k€/MWh] |
| Remote-controlled breakers (MV_MG) | 20 [k€/switch] |
By substituting all the OHLs with UCs, the second STRONGER solution (STR2) flattens the area because it nullifies the failure probability of the system components. The BIGGER solution uses the added emergency link that connects node 28 to node 11; thus, by hypothesising that such a tie can be remote-controlled, portion 1 of Figure 2 does not suffer from the outage. The SMARTER solutions restore the customers of only the LV network supplied by node 25 (SMARTER basic) or even the neighbouring MV nodes of portion 2 (SMARTER advanced). Even disregarding the STRONGER solution, which improves resilience against windstorms and earthquakes, the adopted metric allows the planner to assess the impact of each planning choice. It is worth noticing that the BIGGER solution is effective only if at least the primary substation in node 1, and the relevant portion of the upstream transmission network, are nonfaulted.
Table 2 reports the results obtained for the entire network of Figure 2. In Table 2, the second column reports the quantities of system assets necessary for implementing each alternative, i.e., the kilometres of lines to be substituted or built, the size of the energy storages and the number of automated switches. The two options that make SMARTER the network incorporate the cost of energy storage systems fundamental for the islanding operation and the cost of additional remote-controlled breakers for the automatic reconfiguration of the network in the MV microgrid case (SMARTER advanced, MV_MG).
The relevant costs and the resilience areas R for the two natural disasters included in the case study (windstorms, WS; earthquakes, EQ) are then calculated (Table 2). Finally, the ratio between the cost and benefit measured by R is calculated and used for decision-making.
| Alternative | Quantity | Cost [M€] | R (WS) | C/B (WS) | R (EQ) | C/B (EQ) |
|---|---|---|---|---|---|---|
| AS-IS | - | - | 425 | - | 284 | - |
| STRONGER 1 | 22.6 km | 5.4 | 413 | 0.452 | 262 | 0.205 |
| STRONGER 2 | 19.0 km | 4.6 | 74 | 0.013 | 47 | 0.016 |
| BIGGER | 10.0 km | 1.0 | 226 | 0.005 | 122 | 0.012 |
| SMARTER basic LV_MGs | 4.6 MWh | 1.8 | 345 | 0.032 | 224 | 0.042 |
| SMARTER advanced MV_MG | 6.3 MWh + 5 switches | 2.6 | 202 | 0.012 | 128 | 0.017 |
The results demonstrate that the metrics can differentiate the alternatives. The resilience area reduction obtained with the substitution of the trunk branches (STRONGER 1) is slight because a different path can supply the trunk branches even in the AS-IS network case. Indeed, the existing network is supposed to be equipped with remote-controlled switches for reconfiguration during emergency conditions.
On the contrary, the resilience improvement is much more evident in the STRONGER 2 solution because it nullifies the failure probability of the lateral branches and, thus, provides the best impact on the network performance. Adding two emergency ties to make the network BIGGER is the most efficient solution considering the cost/benefit ratio. However, it should be considered that the two non-network solutions, despite their high costs, are self-reliant and can be adopted even in the case of failure of the transmission system. The mentioned comments are similar for the two considered extreme events. Therefore, it is essential to highlight that the proposed solutions to improve resilience are very useful for both types of natural disasters, with better exploitation of the proposed investments.
Finally, it is crucial to observe that neither a classical cost-benefit analysis nor the investments’ pay-back time assessment can capture social welfare, economics, health, safety, and externalities related to better resilience since the hazards considered in resilience studies are infrequent. In this context, the resort to multi-criteria analysis allows the appraisal of projects to increase resilience [12]. Additionally, the proposed resilience model will be implemented in a network planning software developed by the authors [13] to help the planners choose the appropriate investment.
Acknowledgment
This work has been partially funded by MIUR PRIN 2017K4JZEE_006 and by the Regional Government of Sardinia (Regione Autonoma della Sardegna, RAS – Assessorato alla difesa dell’ambiente) with a research grant on the Strategies for Climate Changes Adaptation.
References
- S. Chanda, A. K. Srivastava, “Defining and enabling resiliency of electric distribution systems with multiple microgrids”, IEEE Trans. Smart Grid, vol. 7, pp. 2859–2868, Nov. 2016.
- P. Li, Y. Liu, H.Xin, X. Jiang, “A robust distributed economic dispatch strategy of virtual power plant under cyber-attacks”, IEEE Trans. Ind. Inform., vol. 14, pp. 4343–4352, Oct. 2018.
- Panteli M., and Mancarella P., “Modeling and Evaluating the Resilience of Critical Electrical Power Infrastructure to Extreme Weather Events”, IEEE Systems Journal, 2017.
- Zhang H., Yuan H., Li G. and Lin Y., “Quantitative Resilience Assessment under a Tri-Stage Framework for Power Systems”, Energies, 2018.
- Panteli M., Mancarella P., Trakas D. N., et Al., “Metrics and Quantification of Operational and Infrastructure Resilience in Power Systems”, IEEE Tr. on Power Systems, 2017.
- Zhang H., Gan L., Mo W., et Al., “Optimal Resource Allocation to Reduce the Distribution System Risk Induced by Hurricanes”, in Proc. CIRED 2019, Madrid, Spain, Jun 2019.
- De Masi M., Valtorta G., Amicarelli E., et Al., “Resilience A. Enhancement of MV Distribution Grids against Snowstorms”, in Proc. CIRED 2019, Madrid, Spain, Jun 2019.
- Tierneyand K., Bruneau M., “Conceptualising and Measuring Resilience: A Key to Disaster Loss Reduction”, The National Academies of Sciences, Engineering and Medicine, Transportation and Research, News, vol. 250, May-Jun. 2007.
- Shafieezadeh A., Onyewuchi U. P., Begovic M. M., and DesRoches R., “Age-Dependent Fragility Models of Utility Wood Poles in Power Distribution Networks Against Extreme Wind Hazards”, IEEE Tr. on Power Delivery, Vol. 29, No. 1, Feb 2014.
- Moreno R., Panteli M., Mancarella P., e Al., “From Reliability to Resilience”, IEEE P&E Magazine, July/August 2020.
- M. Nazemi, M. Moeini-Aghtaie, M. Fotuhi-Firuzabad, P. Dehghanian, “Energy Storage Planning for Enhanced Resilience of Power Distribution Networks Against Earthquakes” in IEEE Transactions on Sustainable Energy, vol. 11, no. 2, pp. 795-806, April 2020.
- Celli G., Chowdhury N., Pilo F. et Al., “Multi-Criteria Analysis for decision making applied to active distribution network planning”, Electric Power Systems Research, Vol. 164, Nov 2018, Pages 103-111.
- Pilo F., Celli G., Ghiani E., Soma G.G., “New electricity distribution network planning approaches for integrating renewable”, WENE, 2013, 2, pp. 140-157.