Fast Frequency Response from Transmission-Connected Solar Farms: Australian Experience
Authors
N. MODI, A. JALALI, I. COMMERFORD, A. GROOM
Australian Energy Market Operator (AEMO)

Summary
Increasing penetration of inverter-based resources (IBR) has expedited the retirement of conventional synchronous generators (SGs) in power systems worldwide. This has reduced levels of synchronous inertia and frequency control provided by synchronous generators, which in turn increases the complexity of primary and secondary frequency control. Synchronous inertia plays a key role in slowing the rate of change of frequency (RoCoF) after a disturbance, providing time for primary frequency control to act, and thereby maintain frequency within required limits. Under low inertia conditions RoCoF can increase, reducing the available time for primary frequency control to act.
Fast frequency response (FFR) can provide the necessary frequency control quickly and can potentially help avoid undesired system frequency outcomes such as under-frequency load shedding or over-frequency generation shedding. While to date battery energy storage systems (BESSs) have been considered the most promising technology to provide FFR, solar farms (SFs) have also demonstrated the capability of providing FFR.
This paper present real-life example of FFR from SFs in the Australia’s National Electricity Market (NEM) power system. Real-time measurements have been used to benchmark a SF model, to confirm the accuracy of the model. The effect of varying droop in the model has been assessed and its response is compared with response from a BESS. This comparison demonstrates the capability of SF in providing FFR that is similar to that from a BESS. The contribution of FFR from BESSs and SFs toward overall power system security is demonstrated through a simulation of a NEM region. The impact of droop and dead-band settings of SFs and BESSs on their FFR provision, and their impact on power system security, are also assessed.
Keywords
frequency control - synchronous inertia - rate of change of frequency - fast frequency response - solar farm - battery energy storage - droop and dead-band1. Introduction
The National Electricity Market (NEM) of Australia is experiencing an unprecedented increase in the penetration of renewables and inverter-based resources (IBR) at both transmission and distribution levels. The South Australian (SA) power system, in particular, has witnessed operating periods with the instantaneous penetration of IBR-generated electricity exceeding 140% of the region’s operational demand, with the balance exported to neighbouring regions. The increasing level of IBR in the NEM power system has accelerated the retirement of synchronous generators (SGs), which has been a factor in reduced frequency control performance in the NEM [1]. The Australian Energy Market Operator (AEMO) has been intervening to maintain a minimum number of SGs online in several regions of the NEM, to maintain the required level of system strength needed for stable operation of IBR [2]. While these online SGs contribute to power system inertia, a steady decline in the inertia level has been observed in the past few years[1].
Inertial response provided by SGs is an inherent and immediate release of the energy stored in the rotary masses of SGs, opposing sudden changes in frequency [3]. The inertial response of SGs is considered the main factor limiting the rate of change of frequency (RoCoF) immediately after a disturbance. This provides sufficient time for other frequency control measures to respond and control frequency. Under low inertia conditions, limiting the size of the contingency has been considered as an option for limiting the RoCoF, although the increasing sizes of future IBR can increase the impact of this approach [1].
AEMO procure frequency control requirements through Frequency Control Ancillary Services (FCAS) market. Two major categories of the frequency control requirements are sourced through the market and they are regulation requirements and contingency requirement. The current Frequency Operating Standards (FOS) requires frequency to be regulated within ± 0.15 Hz during system normal operation. This is achieved through procuring sufficient amount of regulation services through the FCAS market. The Automatic Generation Control (AGC) uses procured amount to regulate the frequency within the ± 0.15 Hz during system normal conditions. In the event of a contingency different frequency operating requirements apply and is dependent on the type of the contingency. If a contingency occurs and the frequency leaves the normal operating frequency band (± 0.15 Hz), the dispatched resources are required to provide sufficient amount of frequency control to control the frequency as per the FOS. In 2020, the Australian Energy Market Commission (AEMC), which is the rule making body in Australian power grid, re-established effective frequency control within the normal operating frequency band by introducing narrow dead-band frequency responsiveness from generators including IBRs starting from no more than 0.015 Hz away from the nominal frequency. This change does not ensure reservation of headroom unless the resource is dispatched to provide frequency control.
Fast frequency response (FFR) has been gaining increasing attention to support power system operation with low inertia, assisting in limiting the RoCoF, and providing sufficient time for primary frequency control. Here, FFR acts as a rapid active power increase or decrease, by generator or load, in sub-second timeframes to correct frequency changes [4]. While FFR might not be able to fully replace the physical inertia, it allows for larger contingency sizes at lower inertia levels, as is demonstrated in this paper.
The NEM has one of the highest penetrations of distributed photovoltaic (DPV) systems worldwide, causing significant operational demand reduction during sunny periods [5]. Output from this DPV cannot be readily curtailed. Under low demand conditions driven by DPV, and particularly for an islanded region, output from transmission-connected SFs (and wind farms [WFs]) may have to be curtailed instead, due to both insufficient demand and as a result of other technical network constraints [2]. This creates headroom, providing an opportunity for SFs to provide FFR to the grid during these periods. Instances of relatively fast generation change to correct frequency deviation by SFs have been observed in some real-life operating conditions in the NEM power system, which is discussed later in this paper.
Worldwide, FFR has been assessed from various angles:
- FFR has been investigated [6] from an energy viewpoint, where the energy delivered after a frequency event is decoupled, based on the timeframe the energy is released into the grid.
- The capability of FFR supplied by a BESS, in replacing SGs’ inertia and primary frequency response (PFR), has been evaluated [7], measuring the energy provided by SGs to estimate the required size of BESS to deliver the same amount of energy during the first 6 seconds after the event.
- FFR has been contrasted against synthetic inertia, where the former is defined as any type of fast active power change based on frequency deviation, while the latter is the mimicked response of SGs’ rotational masses which is in proportion to the RoCoF [8]. The reference shows that FFR leads to a better overall frequency performance compared to synthetic inertia.
- An SF has been modelled to simultaneously provide FFR and oscillations damping to the grid [9]. The proposed model is evaluated on a two-area test power system.
- The frequency support capability of a curtailed grid-scale SF, among its other grid support services, has been tested by the National Renewable Energy laboratory (NREL), as reported in [10] and [11]. A ramp-rate limit of 10 MW/sec, however, is applied in [10] to the SF’s response which could prevent the SF from delivering its full response before the frequency nadir/peak and hence contributing to arresting the frequency nadir/peak.
To date not much study has been carried out focusing on FFR provision from grid-scale SFs and BESSs and their impact on the frequency stability of an actual large-scale power system, supported by real-life observations. Also, the extent to which the droop and dead-band settings of FFR providers can impact the frequency performance of the grid has not been paid due attention in the past.
This paper first presents the real-life responses from an SF and a BESS in the NEM power system during frequency events. The measured responses of the SF and BESS during the events are then replicated through electromagnetic transient (EMT)-type simulations, via injecting the frequency signals measured during the events into the EMT model of a SF and BESS. Through this exercise it is demonstrated that properly configured SF can provide FFR similar to BESS. A detailed wide area EMT model of a gigawatt-scale NEM region is then used to demonstrate the potential benefits of FFR provision by SFs in addition to BESSs for frequency control of the grid. Additional scenarios are also studied to evaluate the impact of droop and frequency dead-band settings of SFs and BESSs on their FFR provision capability and impact on overall power system security.
2. Real-life Frequency Response from SF and BESS
There have been a few recent frequency events in the NEM for which AEMO has received high resolution data from online generators. This data confirmed that grid-scale BESSs responded to the frequency events by changing their active power rapidly, consistent with their control design.
The received data also confirmed that some SFs in the NEM had provided similar rapid change in the generation to control the frequency change, again in line with their control design. In this section, examples of real-life response provided by a transmission-connected BESS and a SF during a few frequency events are presented.
2.1. FFR from SF
Figure 1(a) shows the response of the SF to an under-frequency event where the frequency dropped to 49.77 Hz. At the time of the event, the SF output was partially curtailed, and SF was generating 50 MW prior to the event. If the SF was not curtailed, it would have been generating 80 MW. Because of the curtailment, the SF had headroom available to increase output. While the SF was operating with some headroom, a frequency event occurred, and as shown in Figure 1(a) the output of the SF started to increase with some time delay. The small time delay in the response is associated with the frequency dead-band, and communication and processing time delays in the controls, which can add up to 200 ms or more.
Figure 1(b) shows the response of the same SF to an over-frequency event, where the frequency increased to around 51.1 Hz. As seen, the SF rapidly reduced its output from around 90 MW to 52 MW, which is well aligned with its known droop (5%) and dead-band (± 0.15 Hz) settings. The rapid reduction in the generation occurred prior to the peak frequency, and therefore contributed towards arresting the over-frequency.
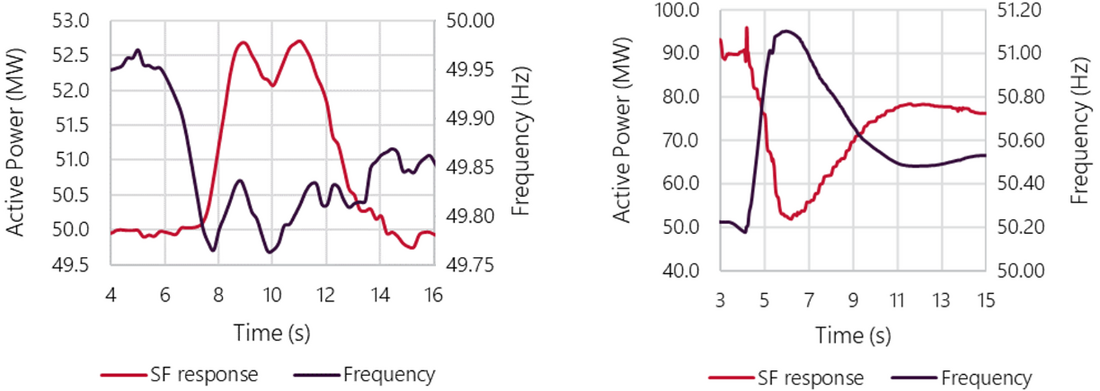
Figure 1 - Measured SF responses to (a) an under-frequency event and (b) an over-frequency event
A noteworthy point in the SF response seen in Figure 1(a) is that after the initial active power rise by the SF, in response to the frequency drop, the SF shows some active power oscillations between t=8 and t=12 seconds and the active power oscillations are somewhat in phase with the frequency. This can be associated with the inherent delayed response from the SF, considering the frequency dead-band, ramp rate, and the time required for measurement, processing, activation and communication. However, given the very small size of SF’s active power oscillations (less than 1 MW) and the Gigawatt scale of the network, it is unlikely that the frequency oscillations are created by the SF response. Nevertheless, the delay in the response of the SF to the frequency changes could impact overall frequency performance of the grid. Hence, a careful design is required to avoid such a delay and its subsequent consequences.
Another point to be noticed in Figure 1(a) is that the response provided by the SF is as per its 5% droop setting. Therefore, even though larger headroom was available for the SF during the event, only a small portion of it was used in line with its droop setting. It is, however, observed that the SF has withdrawn its FFR after t=12s, while frequency has not yet returned within the ± 0.15 Hz dead-band. The sooner-than-expected FFR withdrawal could be associated with the fast variations in the irradiance level observed over the time of the event, given the small size of active power change (less than 3 MW). It could also be caused by the hysteresis-like dead-band re-entering limit in the control system of the SF.
2.2. FFR from BESS
Figure 2(a) shows the response of the BESS to an under-frequency event, where the frequency dropped to 49.62 Hz. As seen, the BESS has responded to the frequency deviations quickly by changing its output power according to its known droop and dead-band settings.
Figure 2(b) shows the BESS response to the same over-frequency event as in Figure 1(b), where the frequency rose to 51.1 Hz. As seen, the BESS has responded to the event by reducing its output to -87 MW in less than 2 seconds according to its droop (1.7%) and dead-band (± 0.15 Hz) settings.
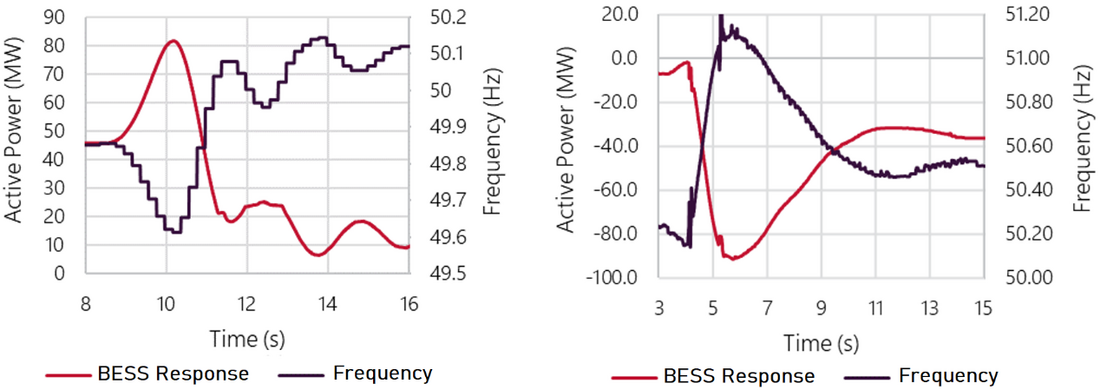
Figure 2 - Measured BESS responses to (a) an under-frequency event and (b) and over-frequency event
The noisier frequency signals in Figure 2(b) could be due to not applying adequate filtering to the measured signal. Also, it is observed that the update rate of the frequency measurement in Figure 2(a) is around 200 ms, which is higher than that of the other measured frequency signals, although it is sufficiently small to show the overall trend of frequency changes.
3. Validation of Solar Farm model
The purpose of this section is to evaluate the accuracy of the EMT model of the SF in emulating the behaviour of the actual plant. For this purpose, the frequency and voltage signals measured at the terminal of the SF, for each event, were applied at the point of connection (PoC) of the SF’s EMT model, using a playback set-up as shown in Figure 3. The active power response of the SF model to the injected signals was then compared against the measured active power response of the SF.
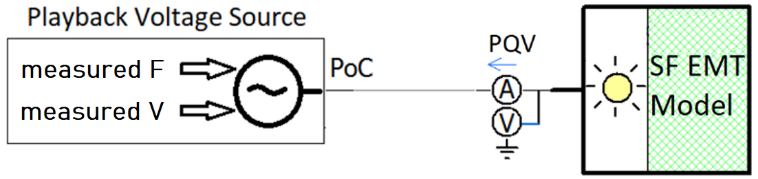
Figure 3 - Playback set-up to simulate the FFR of SFs
3.1. Responses to Under-Frequency and Over-Frequency Events
The active power response from the EMT model of the SF to an under-frequency event is shown in Figure 4(a). As seen, the simulated response is close to the measured response when the droop is set to 5% (the green curve), which is consistent with the known control system settings in the SF model. Figure 4(a) also shows the response of the SF model when the droop is set to 3% (the red trace) and 1.7% (the black trace). As seen, at lower % droop value the FFR response of the SF is increased, while the time to provide the response is almost unchanged. This, however, requires that sufficient headroom is available to provide raise FFR. Figure 4(a) shows that the delay observed in the measured response of the SF (the orange curve) is slightly larger than the simulated response (the green curve). This could be due to the minor model discrepancies, where some delays present in the actual plant’s response has not been adequately captured in the SF model.
The active power response of the EMT model of the SF to the over-frequency event is shown in Figure 4(b). Again, the simulated response closely matches the measured response when the droop is set to 5% (green trace), consistent with the known control system settings in the SF model. Also, the figure shows that changing the droop setting of the model to 3% and 1.7% significantly increases the FFR capability of the SF.
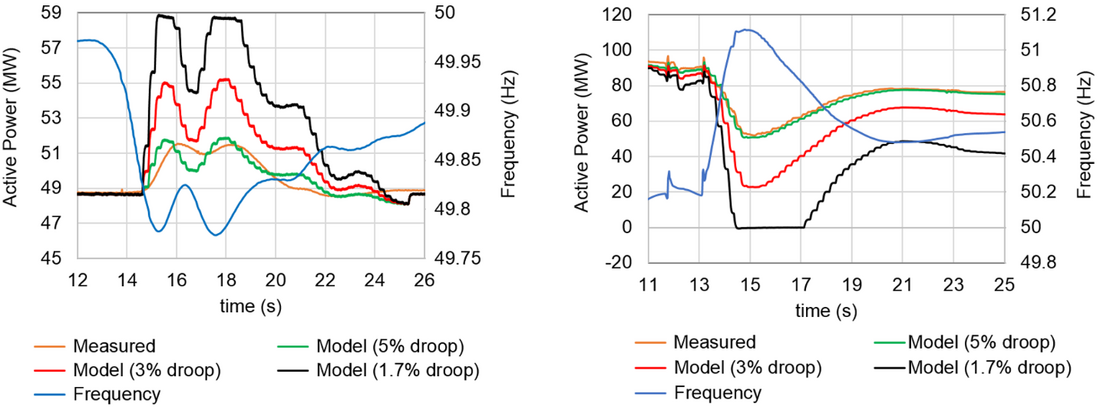
Figure 4 - Simulated and measured responses of SF to (a) an under-frequency event, and (b) an over-frequency event
4. Comparison of FFR provided by SF and BESS
In this section, the FFR responses by both the SF and the BESS to an under-frequency event are compared. For this purpose, the measured frequency signal during the event is fed into the EMT models of both SF and BESS using the playback setup of Figure 3. The droop and dead-band settings of both SF and BESS are set at 1.7% and ±20 mHz, respectively. Figure 5 shows the overlaid responses of SF and BESS to the frequency change. As seen, both models respond quite similarly to the event, when the same settings are used for them. This suggest that SFs can provide FFR similar to BESSs during under-frequency events, if they have headroom available via pre-curtailment.
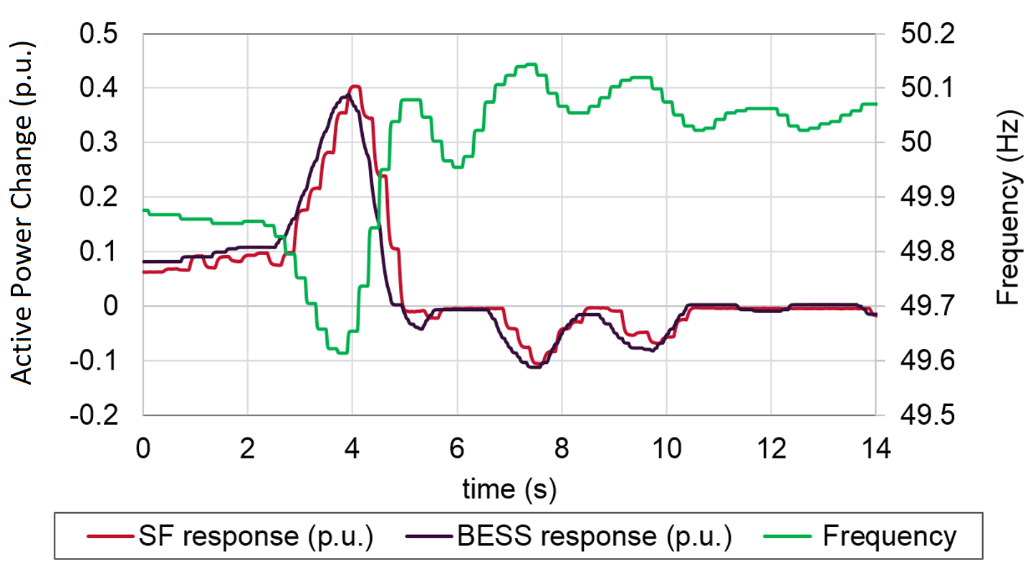
Figure 5 - Overlay of simulated responses of SF and BESS to an under-frequency event
5. Role of FFR in power system security
This section demonstrates the role of FFR in improving overall power system security. For the purpose of this analysis, FFR from SFs and BESSs is considered. It should be noted that other technologies such as super-capacitors and fast load shedding can also provide similar fast response to a change in the frequency.
5.1. Power system model
The wide area EMT model of a gigawatt-scale region of the NEM is used to demonstrate impacts of FFR on overall power system security. The model includes detailed modelling of all SGs, IBR, DC interconnector, and all transmission elements. The model has been benchmarked against measured responses of the actual network during several events [12]. It is worth mentioning that the analysis carried out in this paper could have been conducted using RMS-type simulation tools as well, given that the focus of the paper is frequency stability, however using site-specific and benchmarked EMT-type models of individual plants would help accurately model the temporary energy deficit of the WFs and SFs during the fault recovery period, which can considerably impact the frequency stability of the grid. Some short-term transients during and after the fault may not be captured by RMS-type simulations which could impact the accuracy of the results.
5.2. System conditions
To understand the contribution of FFR to power system security, five scenarios have been considered (shown in Table 1). In all scenarios, a fault and disconnection of a SG coincident with some amount of DPV generation loss has been considered. Droop response of the SF and BESS are calculated from the point where frequency leaves the specified dead-band. In all the cases, it is assumed that both BESS and SF have sufficient head-room available. Also, for simplicity and to show effectiveness of FFR from SF no frequency response is considered from other SGs and WFs in the network.
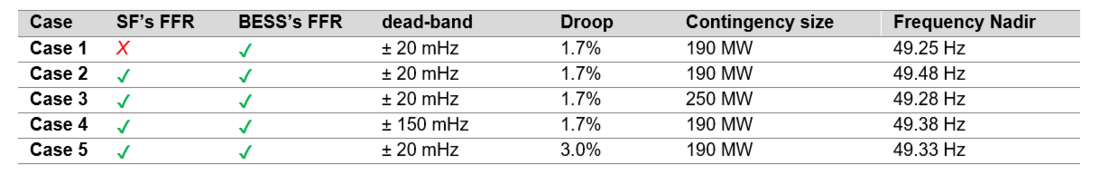
Table 1 - Simulated case studies on the wide area EMT model of a NEM sub-network
The results of the first three cases are shown in Figure 6. The key findings are:
- For a contingency size of 190 MW, when only the BESS provides FFR, the frequency nadir is 49.25 Hz compared to 49.48 Hz when FFR is also available from SF. The availability of FFR from an SF is dependent on headroom availability via pre-curtailment.
- Other things being equal, availability of FFR from an SF allows an additional 60 MW contingency size, while still maintaining the frequency nadir above the frequency operating standards. This clearly demonstrates a benefit of the SF’s FFR for frequency stability of the future grid.
- It is observed that in case 3 (the red curves), SF has hit its maximum active power limit, while BESS has not, while the same droop setting of 1.7% has been used for both devices. This is mainly due to the fact that the initial generation level of the SF is 25 MW (which limits its FFR headroom), compared to the 0 MW in the BESS. Energy availability is required for BESS to provide and maintain FFR for longer durations.
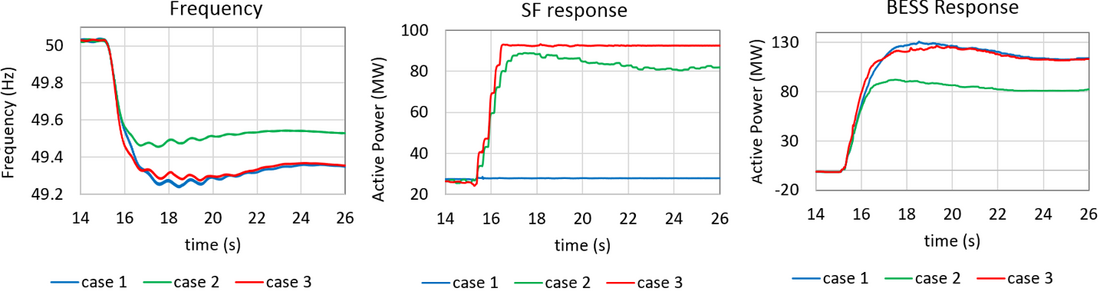
Figure 6 - Wide area results: (a) frequency (b) FFR from SFs (c) FFR from BESS
The results of cases 2, 4 and 5 are shown in Figure 7. The key findings are:
- Using a wider dead-band of ±150 mHz, the FFR responses of both the SF and BESS start with around 300 ms delay, compared to when a ±20 mHz dead-band is used. This leads to a 0.1 Hz lower frequency nadir when a larger dead-band is applied, for the same contingency size.
- When a droop of 3% is used, the frequency nadir is 0.15 Hz lower compared to when a 1.7% droop is used, keeping all other conditions unchanged.
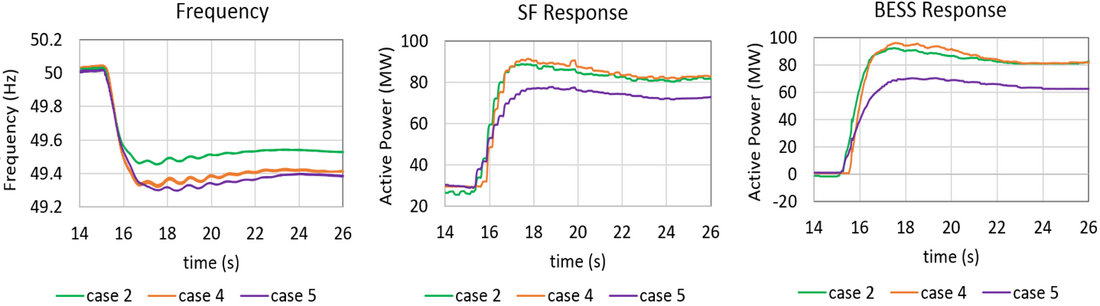
Figure 7 - Wide area results: (a) frequency (b) FFR from SFs (c) FFR from BESS
5.3. Potential limiting factors of FFR from SF and BESS
FFR from SFs and BESSs rely on reliable and accurate measurement of the frequency. The time required to measure frequency and act on it can depend on the frequency measurement algorithm, and measured data update rates. These factors may vary between manufacturers.
If the frequency is measured and responded to directly at the individual inverter level of a BESS or SF, the FFR from the SF or BESS may be quicker, compared to a design where frequency response is managed centrally through the Power Park Controller (PPC), with a power change command transmitted to each inverter. Delays associated with communication between the PPC and inverters can add up to 200 ms or more to response times. Moreover, if the frequency is measured at PPC level, the speed of the response would depend on the update rate of quantities being measured and calculated in this central controller.
In the NEM, FFR from BESS has been implemented both at the individual inverter level and at the central PPC level, depending on the site. In SFs, frequency response has been implemented at the PPC level only to date.
6. International Experience using FFR
FFR services are used by many other international power system operators. Each operator has a different way of specifying FFR, suitable to its grid conditions, with some including renewable sources of generation in the FFR provision framework. This section provides a summary of FFR utilization in some power systems around the world.
6.1. ERCOT (Texas)
ERCOT (in Texas) has FFR services implemented from 1 March 2020. Under this service FFR must be delivered within 0.25 seconds once the frequency is below 59.85 Hz (i.e. 0.15 Hz below nominal frequency of 60 Hz) [13]. Figure 8 shows an expected response from FFR providers. Earlier, ERCOT already had a type of fast frequency response product provided by load resources with under-frequency relays set to trip within 0.5 seconds of frequency reaching or falling below 59.7 Hz. This service still remains, even after implementation of FFR. At this stage, all of the new FFR service is provided by storage resources. Resources providing FFR shall be also capable of governor-like response with ±17 mHz dead-band, and droop setting of 5.0%. Once FFR is deployed, it should sustain for up to 15 minutes or until frequency recovers to 59.98 Hz (whichever happens first). Once FFR is recalled, it should restore within 15 minutes.
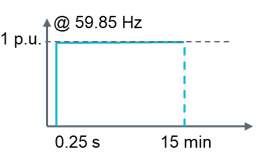
Figure 8 - ERCOT FFR [13]
6.2. EirGrid (Ireland)
EirGrid uses ‘Fast Acting Operating Reserve’ to describe FFR. This ‘Fast Acting Operating Reserve’ is the additional increase in MW output from a generator or reduction in demand following a frequency event that is available within 2 seconds of the start of the event and is sustained for at least 8 seconds.
As the majority of FFR resources is provided by wind generators, EirGrid also limits energy extracted from wind generators. The extra energy provided in the 2-10 second timeframe by the increase in MW output must be greater than the loss of energy in the 10-20 second timeframe due to a reduction in output power. As shown in Figure 9, in order to be eligible for FFR, the amount indicated by the blue hatched area (Power provided) shall be greater than the green hatched area (Power drawn) [14].
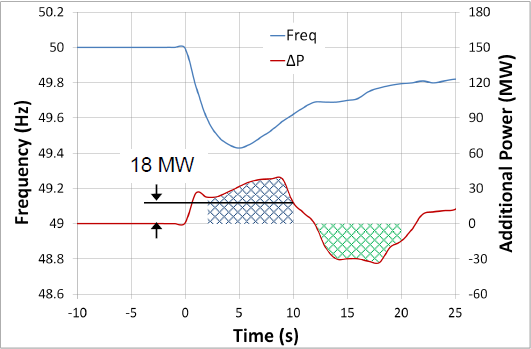
Figure 9 - EirGrid fast acting operating reserve [14]
6.3. National Grid (UK)
National Grid uses ‘Firm Frequency Response’ to describe FFR [15]. FFR represents the ability to modify generation or demand to compensate for changes in system frequency within 2-30 seconds, depending on FFR service type. The FFR service is split into two physical products, Non-Dynamic (static) and Dynamic frequency response. Static frequency response is activated at a defined frequency deviation which is specified in agreement with each FFR provider, and no response is required within the specified band. Static response should be provided within 30 seconds and last for 30 minutes, and hence is categorized as secondary frequency response. Dynamic frequency response, on the other hand, is continuously provided to manage second-by-second frequency variations. Dynamic response is automatically delivered when frequency violates the dead-band of 50Hz ±0.015Hz. It has three types including primary, secondary, and high frequency responses. Primary dynamic response should be delivered within 2 to 10 seconds and last for 20 seconds. Secondary dynamic response should be delivered within 30 seconds and last for 30 minutes. High dynamic response should be delivered within 10 seconds and last indefinitely, unless agreed otherwise with the provider.
7. Conclusion
This paper provides real-life evidence that SFs have capability to provide FFR. The response is configurable and can closely align with that of BESSs. Responses from an SF during frequency events have been analysed. The real-time observations show that grid-scale SFs have the potential to provide FFR to the grid, contingent on the availability of active power headroom when responding to under-frequency. Using the benchmarked model of a SF, it was shown that SFs can provide similar FFR to that from a BESS, if they are properly tuned for this purpose and subject to resource (i.e. headroom) availability. A detailed wide area EMT model of a NEM region was used to evaluate the impact of FFR from SFs on overall frequency control of the power system. The results verify that the frequency response of the grid can be significantly improved when the FFR from SFs is available. It was also shown that the improved frequency stability allows for larger contingency sizes. Besides, it was shown that the FFR control settings, such as droop and frequency dead-band, are crucial for determining the effectiveness of the response, where a tighter dead-band and a smaller droop noticeably improve the frequency stability of the grid.
References
- IEEE, “Renewables in Australia”, IEEE Power & Energy Magazine, Vol 19, n. 5, September/ October 2021
- AEMO, “Transfer Limit Advice, System Strength in SA and Victoria”, Australian Energy Market Operator, July 2021
- NERC, "Fast frequency response concepts and bulk power system reliability needs." NERC Inverter-Based Resource Performance Task Force (IRPTF), March 2020.
- AEMO, "Fast frequency response in the NEM", Australian Energy Market Operator, 2017.
- AEMO, “South Australian Electricity Report”, Australian Energy Market Operator, November 2020.
- D. Stenclik, M. Richwine, N. Miller, L. Hong, “The Role of Fast Frequency Response in Low Inertia Power Systems”, CIGRE PARIS 2018.
- Brogan, P., et al. "Fast frequency response requirements for replacement of observed generator response during under frequency transients." CIGRE Symposium, Dublin, 2017.
- Eriksson, Robert, Niklas Modig, and Katherine Elkington. "Synthetic inertia versus fast frequency response: a definition." IET Renewable Power Generation 12.5 (2018): 507-514.
- Varma, Rajiv K., and Mohammad Akbari. "Simultaneous fast frequency control and power oscillation damping by utilizing PV solar system as PV-STATCOM." IEEE Transactions on Sustainable Energy 11.1 (2019): 415-425.
- C. Loutan, P. Klauer, S. Chowdhury, S. Hall. “Demonstration of Essential Reliability Services by a 300-MW Solar Photovoltaic Power Plant”, NREL/TP-5D00-67799. National Renewable Energy Lab. (NREL), Golden, CO (United States), 2017.
- V. Gevorgian, B. O’Neill, “Demonstration of Active Power Controls by Utility-Scale PV Power Plant in an Island Grid”, NREL/CP-5D00-67255. National Renewable Energy Lab. (NREL), Golden, CO (United States), 2017.
- Babak Badrzadeh, Z. Emin, Emil Hillberg, David Jacobson, Lukasz H. Kocewiak, G. Lietz, Marta val Escudero, “The Need for Enhanced Power System Modelling Techniques and Simulation Tools”, CIGRE Science & Engineering Journal, February 2020.
- Julia Matevosyan, “Overview of Renewables in the ERCOT System”, ERCOT, Wind Integration Workshop Stockholm, October 2018.
- EirGrid, SONI, "DS3 system services: portfolio capability analysis", EirGrid and SONI, 2014.
- National Grid, “Firm Frequency Response (FFR)”, National Grid, December 2017.