Internal Pressure Dynamics of Mass-Impregnated HVDC Subsea Cables at Different Sea Depths
AUTHORS
M. RUNDE, E. BJERREHORN, E. JONSSON, N. MAGNUSSON
SINTEF Energy Research, Norway

Summary
Reducing or turning off the load of a mass-impregnated non-draining cable causes its internal pressure to drop. Under certain conditions, the pressure becomes so low that harmful shrinkage voids or cavities are created in the insulation. The pressure and pressure dynamics of mass-impregnated non-draining subsea cables at external pressures corresponding to laying depths of 30, 60 and 90 m have been investigated. It appears that load changes cause rapid and large changes in the internal pressure and set up radial pressure gradients. These pressure variations are superimposed on the external hydrostatic pressure. Consequently, a high external pressure presumably suppresses cavity formation. However, if the ambient temperature is low—which is typically the situation for a cable directly exposed to sea water at large depths—a load turn-off still causes the internal pressure to abruptly fall to low levels. When imitating load turn-offs in a cable at 90 m depth and with a 10 °C ambient temperature, the pressure in the innermost part of the insulation dropped to levels where voids may form and remained so for several days. A cable buried in the seabed experiences a warmer and more stable ambient than an uncovered cable, making it less susceptible to cavity formation.
KEYWORDS
Cable insulation – Mechanical properties – Oil filled cables – Power cables – Underwater cables1. Introduction
A prominent feature of the insulation of mass-impregnated non-draining (MIND) cables used for HVDC power transmission [1] is that it is made up of two materials with a very different thermal expansion. The high-viscosity impregnation oil—commonly referred to as the "mass"—has a volumetric thermal expansion coefficient around ten times that of the paper [2]. When loading and unloading the cable, temperature changes and a limited permeability for mass migration through the lapped paper layers cause the internal pressures in the insulation to vary over a wide range and in a complicated manner [2]–[4].
The internal pressure in the insulation clearly influences its dielectric properties. In general, high pressures tend to have a positive effect on the dielectric strength of insulating systems containing fluids. This is probably also true for MIND cables. Load reductions or turn-offs cause the temperature and pressure in the cable insulation to drop rapidly, and under certain circumstances it is assumed that shrinkage cavities or voids are created [5], [6]. Such cavities—at least if they grow above a certain size—become weak areas in the insulation, susceptible to partial discharging, and may even be starting points for complete disruptive breakdowns.
The type test for HVDC MIND cables [7] includes a load cycling and polarity reversal test sequence at elevated voltage and at the lowest ambient temperature in the installation conditions, typically 5 °C. This is by many found to be the most challenging part, with failures occurring up to a few hours after a load turn-off, indicating that the description above of cavity-initiated failures has some merit. Dielectric faults on MIND cables in service not coming as a result of external mechanical impacts are rare. This suggests that the type test serves its purpose or—alternatively—that it is too severe and not allowing the true capacity of MIND cables to be utilized.
Beyond the small-scale experimental studies by Evenset [8], [9] hardly any detailed or quantitative information about the critical process of cavity formation in MIND cable insulation is found in the literature. Presumably, the complexity of the problem has made it difficult to accurately identify how the various cable design, material, environmental and operational factors contribute and interact. However, the internal pressure and pressure dynamics in the mass-impregnated paper obviously play an important role. Measuring how the internal pressure distributes and develops under different loading and ambient conditions is, therefore, a natural starting point when the objective is to understand under what circumstances hazardous cavities form.
Recently, pressure measurements on both sides of the 20‑mm thick insulation layer of short lengths of full-scale state-of-the-art MIND cables have been published [4]. When applying a rated load current, the pressure in the conductor (equal to that at the innermost insulation layers) was found to rise quickly and to high levels, in some cases from around atmospheric to more than 30 bar. At the outermost insulation layers (i.e., under the lead sheath) where the temperature is lower, the pressure increase was smaller and slower, resulting in a radial pressure gradient across the insulation averaging up to more than 1.5 bar/mm. Apparently, this gradient generated an outwardly directed migration of mass because after some time the pressure difference over the insulation disappeared, even though ohmic dissipation in the conductor still maintained the thermal gradient. Hence, passing current seemed to slightly alter the mass distribution within the insulation.
More interesting for the process of cavity formation is the internal pressure after a load turn-off. It was found that the pressure in the innermost layers of the insulation dropped rapidly and substantially, typically down to hundreds or tens of millibars. In some cases, the pressure transducers gave readings below zero, suggesting that the mass entered an intermediate metastable state where it for a short while behaved like a solid by taking up tensile stresses. "Negative pressures" and mechanical tension in the mass have earlier—quite convincingly—been linked to cavity formation in MIND cables [10].
All these internal pressure recordings were carried out in an atmospheric ambient. MIND cables are however typically used for subsea power transmission, and thereby exposed to an external hydrostatic pressure along most of the route. The common perception is that this is advantageous since the tendency to form cavities after load turn-offs is believed to be suppressed. However, for a cable in shallow and cold waters during wintertime, the thick circular layer of mass-impregnated paper insulation constitutes an almost impenetrable, un-yielding barrier. Together with the steel bands, the armor, and the protective outer layers this may limit or delay pressure exchanges between the inner parts of the cable insulation and the surrounding water during load changes. Consequently, the water pressure may under such conditions be of little or no advantage in terms of mitigating cavity formation. However, no measurements showing how an external water pressure influences the internal pressure in a MIND cable during load changes have been published.
The present work provides quantitative information about the internal pressure dynamics in MIND cables during load cycling at external pressures of 1 bar (atmospheric), and 4, 7 and 10 bar (emulating sea depths of 30, 60 and 90 m). Two 5-m long MIND subsea cable test objects were placed inside a pressurized vessel and subjected to load cycling. The internal pressure in the cables was measured in the conductor and just underneath the lead sheath, i.e., on both sides of the mass-impregnated paper insulation. A temperature control arrangement maintained the surface temperature of the two cables at around 10 and 20 °C, respectively.
2. Experimental
2.1. Test Objects and Setup
The two cable samples had the same 525 kV / 1600 mm2 design but were cut from different production batches. Sample A had previously not carried currents, whereas sample B earlier had been subjected to load cycling at atmospheric pressure and with ambient temperatures up to nearly 40 °C [4].
The ends of the cable samples were cut and sealed off by means of specially designed brass caps and electrically insulating epoxy glue, see Fig. 1a. These caps prevented any relative axial movements between the different layers of the cable, withstood high internal pressures without mass leaking out, prevented mass from flowing radially across the cable insulation at the cut end, provided electrical connection to the cable conductor, and served as mounting arrangement for the sensors that measured pressure in the conductor and the innermost layers of the insulation. More details concerning the design and installation of the brass caps and the attached pressure sensors are given in a separate publication [4].
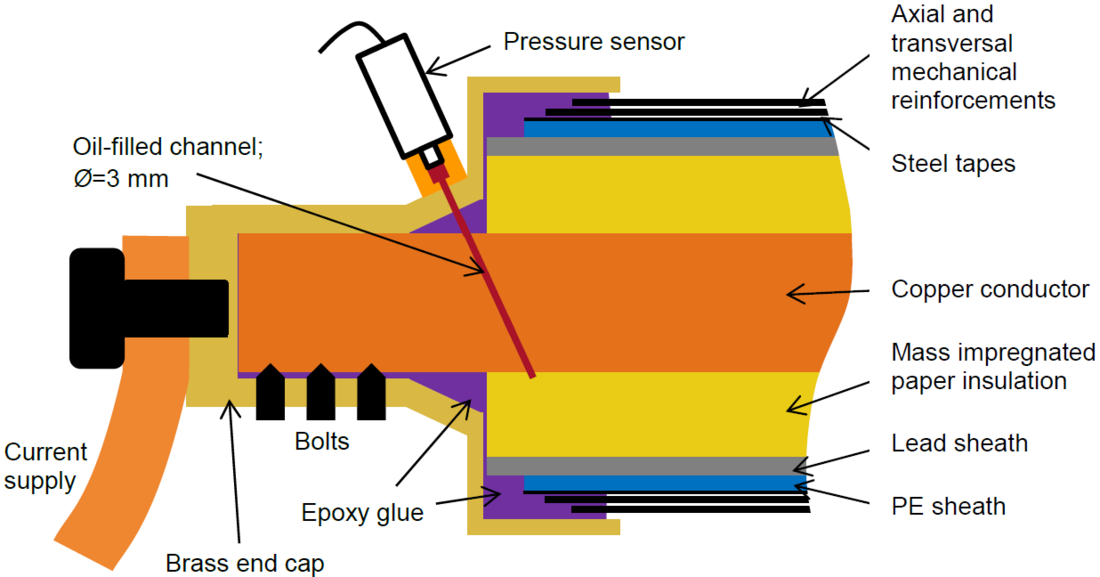
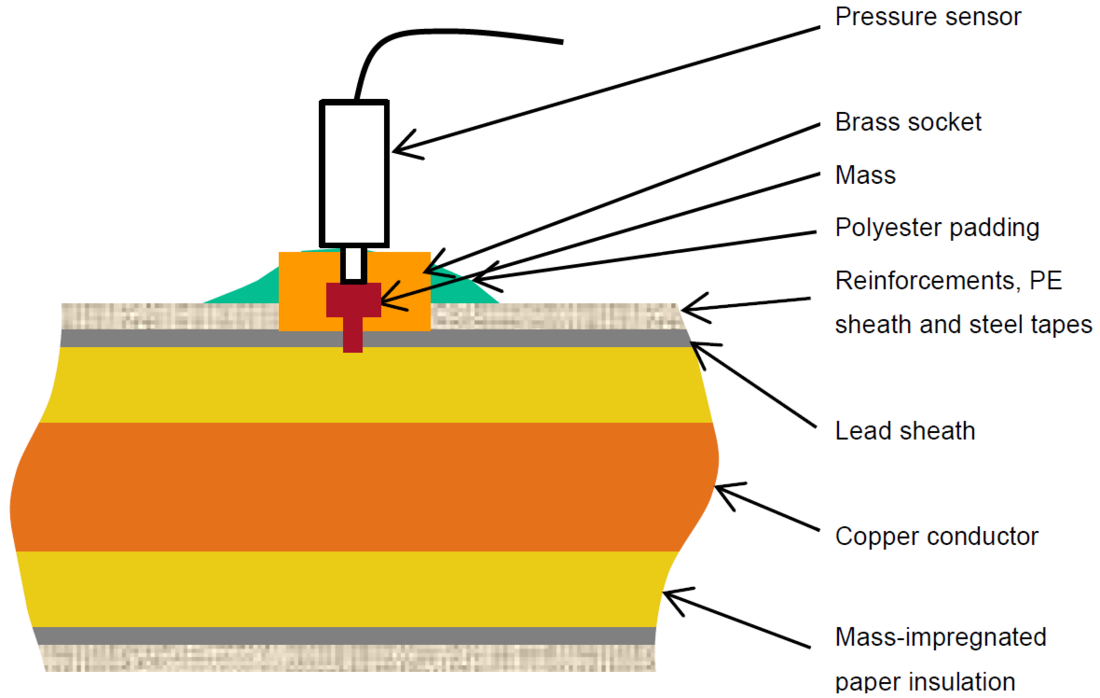
Figure 1 - Cross-sectional and schematic drawing of a brass cap at the end of the cable sample, including the sensor for measuring pressure in the conductor and the innermost insulation layers (a), and pressure sensor assembly for measuring pressure under the lead sheath and the outermost insulation layers (b)
Two other pressure sensors located around 1.5 m from the cable ends recorded the pressure just under the lead sheath, i.e., in the outermost layers of the insulation. Fig. 1b shows this assembly schematically.
The pressure sensors (GE Unik 5000) have a measuring range of 0–70 bar (sample A) or 0–50 bar (sample B). The nominal accuracy is 0.2% of the full-scale value, corresponding to 100 mbar for the 50-bar version.
The surface temperature of the cables was controlled by circulating a water/glycol mixture from a cooling machine in copper pipes wound on the outside of the cables and embedded in a silicone rubber compound filled with aluminum powder that made it thermally well-conducting [4]. Four thermocouples were attached to the cable surface at different locations, underneath the silicone compound.
The two test objects were—one at the time—loaded into a 10-m long, Ø = 30 cm pipe-shaped steel vessel certified for pressures up to 30 bar. The flanged end lids were equipped with feedthroughs for high current cables, pressure sensor and thermocouple wiring, and coolant pipes. Different sea depths were simulated by pressurizing the vessel with air.
2.2. Procedures
The tests were initiated by turning on the temperature control system and let it run for several days, ensuring that the cable reached isothermal conditions before any current or external pressure were applied. The temperature setpoint in the cooling machines was 20 °C for cable A and 10 °C for cable B. Both samples were then subjected to eight load cycles, each lasting a week and consisting of 3 days carrying the rated load current of 1400 A DC, and 4 days with the current turned off. (The very last loading period on sample B was different in that current was passed for 27 days.)
The ambient pressure was atmospheric (1 bar) during the first two load cycles and was then stepped up every two weeks to new levels of 4, 7 and 10 bar, respectively. The pressure was increased some 24 h before starting the first load cycle at a new pressure level. This delay was introduced to be able to distinguish effects caused by external pressure changes from those caused by the current. The 10-bar pressure level was maintained for 21 days for cable A and for 59 days for cable B, to see what values the internal pressures settled at in the two cases. The overpressure in the pressure vessel was then released, exposing the cables to a 1 bar ambient again.
Current, temperatures and pressures (both in the pressure vessel and inside the cables) were recorded every 20 min.
After the tests were completed the glue joint between the cable ends and the brass caps, as well as the pressure sensor assemblies were carefully checked to ensure that they had remained tight and that no mass had leaked out.
3. Results
Figures 2 and 3 show the obtained measurements. Only the output from one of the thermocouples is included for each test object, as the other three gave essentially the same readings. The locations of the pressure sensors are indicated in the insets of Figs. 2 and 3. Unfortunately, the pressure sensor attached to the brass cap at the right end of sample A failed (but did not leak), so for sample A, only one channel measuring the pressure at the innermost insulation layers is available. For sample B a brief disruption in the current supply on day 59 and three days of missing measurements around day 100 are clearly visible in the recordings.
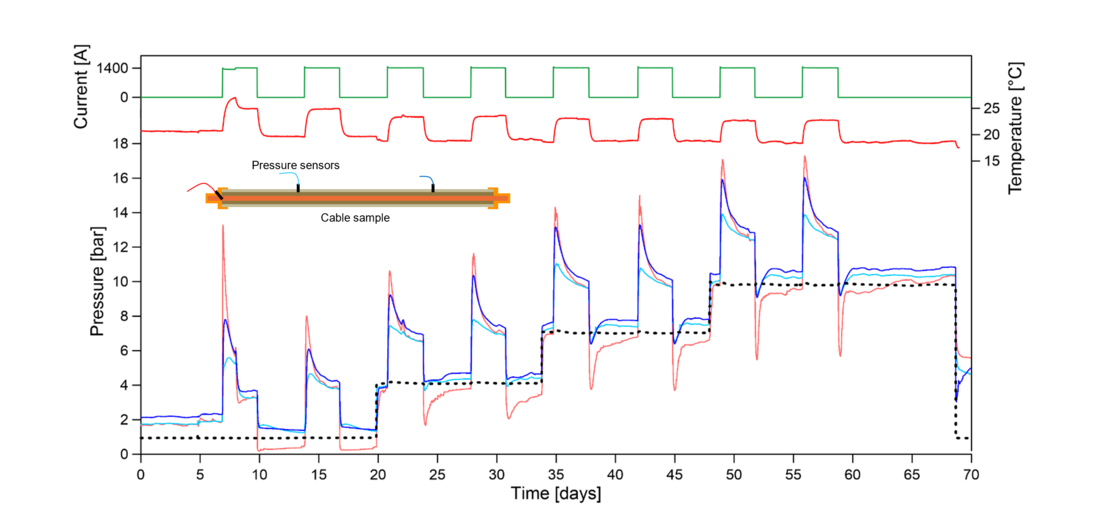
Figure 2 - The measurements obtained on the cable sample A which was run with a coolant temperature setting of 20 °C. The green curve shows the current, the upper red curve is the cable surface temperature, and the dotted black curve is the pressure inside the pressure vessel. The pressure in the cable conductor / innermost layer of the insulation is the lower red curve, while pressure measured under the lead sheath / outermost insulation layers at two locations along the cable (see the inset) are the light and dark blue curves.
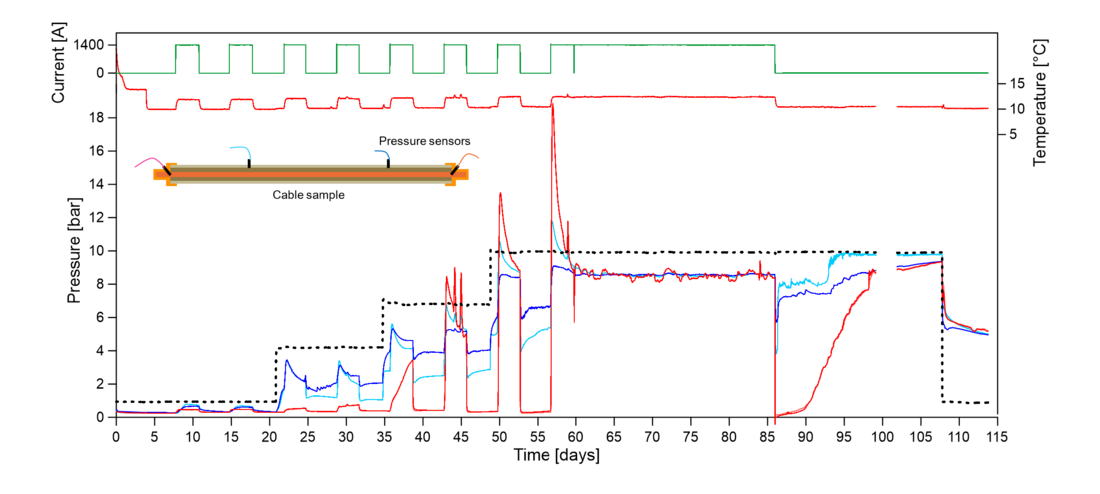
Figure 3 - The measurements obtained on cable sample B which was run with a coolant temperature setting of 10 °C. The green curve shows the current, the upper red curve is the cable surface temperature, and the dotted black curve is the pressure inside the pressure vessel. The pressure obtained at the cable conductor / innermost layer of the insulation is the lower red and light red curves (indistinguishable, as they are almost overlapping), while the pressure recorded under the lead sheath at two locations along the cable (see the inset) are light and dark blue.
The cooling system was not powerful enough to maintain a constant cable surface temperature throughout the load cycles. During loading, the surface temperature increased around 5 °C for sample A and around 2 °C for sample B. A few issues with the control circuitry of the cooling system are visible as glitches in the temperature and pressure curves on days 7–8 and on day 22 in cable A, as well as several times during the cable B test. Obviously, the internal pressure in the cable is very sensitive to temperature changes, irrespective of whether these come as a result of load changes or changes in the ambient temperature.
A first and general observation is that turning on the current caused the internal pressure to increase, while turning off caused it to drop. A second finding is that the pressure difference measured between the innermost and outermost layers of the insulation tended to gradually lessen in the days following such transient events. This occurred both during loading and non-loading periods, except when the temperature was at its lowest (current-off intervals in cable B). However, when current in cable B was off for more than three weeks from day 86 and onwards, the pressure difference across the insulation also here slowly disappeared.
For sample A the pressure profiles during the loading part of all cycles were similar, see Fig. 2. Within a few hours the pressure in the innermost insulation layers increased by 7–8 bar (substantially more when applying current for the very first time). In the outermost insulation layers the pressure also rose, but less—by 4–6 bar—with one sensor giving somewhat higher values than the other.
For the other, colder cable B the pressure profiles obtained during the loading parts changed considerably over the duration of the test, see Fig. 3. The first two load cycles led to only small increases in the measured internal pressure; it remained below 1 bar. Loading the cable for the eighth time, in contrast, caused the pressure in the innermost insulation layer on day 57 to reach 19 bar.
It is also observed that during the load cycles on sample B at 1 and 4 bar ambient, the pressure in the outermost insulation layers varied more than in the innermost layers. In the warmer sample A, the pressure fluctuations were substantially larger in the innermost insulation layer throughout the test.
For both tests, turning off the load consistently caused large and rapid pressure drops, particularly in the innermost insulation layers. For the colder cable B, the pressure in the innermost insulation layers always went down to a few hundred millibars and stayed at this level throughout the no-load part of all cycles. It was not until current in cable B on day 86 was turned off for the last time, that the pressure in the innermost insulation layers slowly started to increase and 20 days later approached the ambient pressure of 10 bar, see Fig. 3.
For cable A, only the two load turn-offs at 1 bar ambient led to internal pressures below 1 bar.
Regarding the effect of the ambient pressure (corresponding to different sea depths) on the internal pressure, the two cases gave quite different results. For the warmer cable A, increasing the ambient pressure appeared simply to cause an upward shift in all profiles of a magnitude equal to the ambient pressure increase. Moreover, the internal pressures remained higher than the external pressure, except the measurements obtained from the innermost insulation layers during the no-load part of the cycles. Here, pressures went as far down as to 4 bar below ambient (days 52 and 59 in Fig. 2).
In the colder cable B, the internal pressures on both sides of the insulation stayed well below the ambient pressure for most of the time. Only at 7 and 10 bar it temporary exceeded the ambient pressure; although quite considerably a few times (on days 50 and 57).
When eventually venting the pressure vessel on days 68 and 108 such that the ambient pressure returned to 1 bar, the internal pressures fell to around 5 bar in both test objects. This is substantially higher than at day 0 when the ambient conditions were the same. However, the internal pressures seemed to continue to decrease, although slowly.
4. Discussion
The only major difference between the conditions of the two tests was the ambient temperature. Cable A was at approximately 10 °C higher temperatures than cable B. When passing current, the conductor becomes around 12 °C warmer than the lead sheath. This temperature difference creates a radial pressure gradient in the insulation due to the different thermal expansion of the mass. This pressure gradient sets up a mass flow through the paper layers towards the outer parts of the insulation, tending to equalize the pressure difference across the insulation. The viscosity of the mass decreases with increasing temperature. Hence this process is expected to proceed faster in cable A than in the colder cable B.
The observed pressure profiles are consistent with this hypothesis. Around 1.5 day into each of the load cycles of cable A, the three sensor readings differed by less than 1 bar. The colder cable B needed the three days of current loading, and in most cases even that was not sufficient, for the pressures in the conductor and underneath the lead sheath to equalize.
The observation of the internal pressure in cable B staying below the external pressure for most of the time can also be attributed to the lower temperature and thereby the volume of the mass being smaller than at higher temperatures.
The thermal time constant for such cables is well below one day, meaning that the radial temperature distribution was unchanged during the last two days of the loading and the last three days of the no-load parts of the cycles. The overall internal pressure in the insulation (estimated by taking the average of the three or four sensors readings) usually changed also during these periods. For example, in cable A the pressure continued to decline throughout the entire loading part of the cycles and increased throughout the entire no-load part of most cycles. This clearly suggests that the pressure and pressure dynamics of these cables are not solely determined by thermal expansion/contraction and radial flow of mass. As have been demonstrated and discussed in detail in a separate publication [11], plastic deformations in the lead and PE sheaths also significantly influence the overall internal pressure.
The peak value of the pressure in the conductor / innermost insulation layers in cable A was considerably higher in the first than in the subsequent load cycles. The same was observed in an earlier investigation on cables that carried full load currents for the very first times [4]. It was interpreted to be related to a temperature induced outward flow of mass as discussed above. This left the inner parts of the cable slightly less impregnated after the first cycle and with a film of mass accumulating under the lead sheath. When current was applied at the start of the second cycle and the conductor heated up, the somewhat poorer impregnation caused the pressure to rise a little less.
Such a mass redistribution may possibly be responsible also for the somewhat strange pressure profiles observed in the first load cycles of cable B. Recall that this sample in the past had carried a full load current in a close to 40 °C ambient. This may have caused considerable amounts of mass to accumulate in the outer layers of the insulation and under the lead sheath. During the loading part of the first five cycles of the present tests, the pressure under the lead sheath became higher than in the conductor, even though the temperature was around 12 °C lower there. In the later cycles, the pressure profiles gradually changed—presumably as a result of an inward directed "back-flow" of the mass that earlier had accumulated under the lead sheath —and became similar to what was observed in cable A.
The external pressure appears—as expected—to have a significant effect on the internal pressure. The measurements carried out here indicate that the internal pressure in a subsea MIND cable in service tends to approach the external water pressure if the cable loading is unchanged for a prolonged period. This is so both when passing a full load current and when passing no current at all, and presumably also for intermediate currents. How quickly the internal pressure adjusts to the external pressure after a load change depends on the temperature. At the lowest temperatures of these tests (unloaded cable B) it took around three weeks after the current was turned off on day 86 before the internal pressure stabilized on a value close to the 10-bar external pressure.
When assessing the risk of creating hazardous cavities in the insulation after a load turn-off, the measurements may provide some insight. It is reasonable to assume that as long as the internal pressure throughout the insulation remains above a certain "critical" level, no shrinkage voids form. Both paper and mass are carefully degassed and dried during the cable manufacturing [6], but some air may be taken up before the lead sheath is applied and seals the insulation off from the ambient. Hence, this "critical" pressure is probably quite low, presumably well below 1 bar. In the present study, many of the load turn-offs caused the pressure in the innermost layers of the insulation to immediately plunge down to the same level of a few hundred millibars and stay there. This may be the critical pressure level just described. i.e., when equilibrium is established between the number and size of shrinkage voids, their internal gas pressure and the pressure in the surrounding mass.
The ambient conditions, i.e., pressure (water depth) and temperature, are decisive for whether a load turn-off brings the pressure in the innermost part of the insulation down to such a low level. With temperatures around 20 °C and an ambient pressure of 4 bar or more, the internal pressure in this cable never became lower than 2 bar. At 10 °C, in contrast, all load turn-offs sent the pressure down to a few hundred millibars. Even an external pressure corresponding to a water depth of 90 m did not prevent such very low pressures in the innermost parts of the insulation.
It should, however, be emphasized that the general perception is that shrinkage voids in HVDC MIND cable insulation not in all cases are associated with an increased risk of aging and dielectric breakdowns. It is believed that small and evenly distributed cavities exist at low temperatures, but that the partial discharges that occur in them during load changes and polarity reversals are too small to harm the insulation. If the cavities combine into larger ones extending between butt gaps and/or causing the paper lapping to "delaminate" they obviously become more dangerous.
Ac partial discharge measurements carried out on HVDC MIND cable samples provide support for such a hypothesis [12]. From the discharge patterns it appeared that two "types" of cavities were created. The type causing by far the most powerful discharges appeared a few hours into the cooling period after a load turn-off, which coincides in time with when load cycling breakdowns during type testing usually occur.
However, a detailed understanding of the processes of cavity formation, discharges and aging is still lacking. It is not clear under what circumstances and conditions the shrinkage voids become harmful.
MIND cables have steel bands wound on the outside of the lead and PE sheaths. Their main purpose is to provide compressive forces so that high internal pressures do not plastically deform the weaker lead and PE layers. However, the steel bands are not very tightly lapped. Strain gauge measurements showed that—at least for the cable design used here—the steel bands were inactive until the pressure under the lead sheath became 5–7 bar higher than the ambient pressure [11]. Consequently, in the present measurements the effect of the steel bands is insignificant. The pressure under the lead sheath was more than 5 bar higher than the ambient pressure only for very limited periods, see the difference between the dotted black and the blue curves in Figs. 2 and 3. For temperatures approaching the upper permissible level for MIND cables, the steel band compression is assumed to greatly affect the internal pressure.
Finally, a few comments on the trustworthiness of the method used for measuring internal pressures are appropriate. The interface between the brass cap and the cut end of the cable is a potential "short circuit" for a radial mass flow when there is a pressure difference across the insulation. Verifying that the glued interface between the brass cap and the sticky mass-impregnated paper of the cut cable insulation remains tight, seems difficult. Although nothing in the obtained pressure profiles suggests that mass has crossed over along this interface instead of migrating through the insulation along the 5-m long test objects, it cannot be ruled out. However, the most important conclusions about the effects of water depth on internal pressure in the cable deduced from the measurements are still valid, even if an unwanted parallel mass flow occurred. The overall internal pressure in the cable is unaffected by such an "internal leak", but the radial redistribution of mass and the accompanying pressure changes in these 5-m samples would be faster than in a long cable.
5. Conclusions
The internal pressure in a subsea MIND cables is—as expected—affected by the external hydrostatic pressure. For a cable under stationary conditions, i.e., with a constant current or no current flowing, the internal pressure throughout the insulation appears to slowly (after days and weeks) asymptotically approach the external hydrostatic pressure, at least for cables at modest and low ambient temperatures.
However, the normal operating patterns for MIND cables often include large load changes taking place within hours. The accompanying thermal expansion and contraction of the mass then cause rapid and large changes in the internal pressure and set up radial pressure gradients. These pressure variations are superimposed on the external hydrostatic pressure.
Concerning the risk of creating potentially harmful shrinkage cavities in the insulation after load reductions or turn-offs, a high hydrostatic pressure has been believed to be beneficial. The external pressure presumably suppresses cavity formation. The present study confirms this assumption, but only in part.
This work also shows that if the ambient temperature is low—which is typically the situation for a cable directly exposed to sea water at large depths—a load turn-off still makes the internal pressure plunge to levels where voids may form. Imitating load turn-offs in a cable at 90 m depth and with a 10 °C ambient temperature caused the pressure in the innermost part of the insulation to drop to a few hundred millibars and remain so for several days. Hence, the positive effects of a high external pressure may have been overestimated.
This work also suggests that avoiding the very low ambient temperatures associated with direct exposure to seawater may be advantageous. A cable that is buried under a meter or so of mud experiences a warmer and more stable ambient than an uncovered cable. This makes it less susceptible to cavity formation, and—unless the water is shallow and warm—it still operates well below its thermal limit.
6. Acknowledgment
The authors thank R. Hegerberg, Ø. Hestad and J. Rantanen for fruitful discussions, and P. King and K. Thinn Solheim for their technical assistance. This work was supported in part by the Norwegian Research Council, Statnett, Nexans Norway, Fingrid, and Svenska Kraftnät under contract no. 256405/E20.
References
- T. Worzyk, Submarine Power Cables: Design, Installation, Repair, Environmental Aspects, Berlin, Heidelberg, Germany: Springer, 2009.
- A. Eriksson, G. Henning, B. Ekenstierna, U. Axelsson, and M. Akke, "Development work concerning testing procedures of mass-impregnated HVDC cables," presented at Int. Council Large Electric Systems (CIGRÉ), 1994, Paper no. 21-206
- P. Szabo, O. Hassager, and E. Strøbech, "Modeling of pressure effects in HVDC cables," IEEE Trans. Dielectr. Electr. Insul., vol. 6. pp. 845–851, 1999.
- M. Runde, E. Jonsson, N. Magnusson, and K.T. Solheim, "Internal pressures and pressure gradients in mass-impregnated HVDC cables during current cycling," IEEE Trans. Dielectr. Electr. Insul., vol. 27, pp. 915-923, 2020.
- P. Gazzana Priaroggia, P. Metra, and G. Miramonti, "Research on the breakdown under type test of non-pressurized paper-insulated HVDC cables," European Trans. Electric Power, vol. 3, no. 5, pp. 321–330, 1993.
- M. Runde, R. Hegerberg, N. Magnusson, E. Ildstad, and T. Ytrehus, "Cavity formation in mass-impregnated HVDC subsea cables—Mechanisms and critical parameters," IEEE Electr. Insul. Mag., vol. 30, pp. 22–33, 2014.
- CIGRE Working Group 21-02, "Recommendations for tests of power transmission DC cables for a rated voltage up to 800 kV," Electra, no. 189, pp. 39–55, 2000.
- G. Evenset and G. Balog, "The breakdown mechanism of HVDC mass-impregnated cables," presented at Int. Council Large Electric Systems (CIGRÉ), 2000, Paper no. 21-303.
- G. Evenset, J. Sletbak, and O. Lillevik, "Cavity formation in mass-impregnated high voltage direct current cable insulation," in Proc. IEEE Conf. Electr. Insul. Dielect. Phenom. (CEIDP), 1998, pp. 554–559.
- G. Evenset, "Cavitation as a precursor to breakdown of mass-impregnated HVDC cables," PhD dissertation, Norwegian Univ. Science and Technology, Trondheim, Norway, 1999.
- M. Runde, S.M. Hellesø, E. Jonsson, and N. Magnusson, "Plastic deformations of the sheaths of mass-impregnated HVDC cables and their effect on the internal pressure," CIGRE Sc. and Eng., vol. 21, pp. 14–21, 2021.
- M. Runde, O. Kvien, H. Förster, and N. Magnusson, "Cavities in mass impregnated HVDC subsea cables studied by AC partial discharge measurements," IEEE Trans. Dielectr. Electr. Insul., vol. 26, pp. 913–921, 2019.