Line Resonance Analysis Implemented in a Cloud-based Monitoring System for Energized Power Cables – A Case Study
Authors
B. SONERUD, M. HUSEBY, K. FAGERVIK - Wirescan AS, Norway
N. PAPADANTONAKIS - Total Eren, Greece

Summary
Line Impedance Resonance Analysis (LIRA) is a characterization method akin to FDS (Frequency Domain Spectroscopy) and TDR (Time Domain Reflectometry), all of which are commonly used for cable system characterization and diagnostics. These methods are typically restricted to offline measurements due to safety requirements which limits the usability for condition monitoring as this ideally should be performed continuously and not at discrete intervals. Online condition monitoring is usually performed with DTS (Distributed Temperature Sensing), a technique based on temperature measurements via fiber optics, but this method is limited to detecting temperature changes in the system. An online monitoring system based on LIRA, which can provide detailed data on the condition of the cable system, is proposed as an alternative and complementary solution to DTS. The proposed system does not require a galvanic connection to the cables as it uses non-intrusive signal inducers and sensors; it is easily adaptable to different cable types and configurations and provides automated analysis based on continuous measurements. To ease data management, the proposed system is cloud-based and uses a data visualization dashboard built upon cable infrastructure maps in which different cable sections can be highlighted and historical and present data can be compared. This makes it possible for the user to handle the large data sets. In this paper the system is described both with respect to hardware and software in addition to a presentation of a case study implemented at the Kithaironas Wind Park, installed by Total Eren in Greece. The wind park comprises 30 turbines and 16 km of medium voltage cables which was installed in 2012. The technical background of the LIRA methodology is presented as well as the approach towards solving the additional challenges associated with online measurements such as the galvanic decoupling of signal injection and pickup.
Keywords
online monitoring - diagnostics - cables - wind farm - line impedance resonance analysis - TDR - FDS - DTS - asset management1. Introduction and background
Power cables play an essential role in the power system and the uninterrupted capability of power transfer is fundamental for the proper operation of any transmission and distribution network. Despite extensive type testing, factory acceptance tests, and after installation tests as well as after installation protective measures such as burial and mechanical protection, cable faults still occur. These can have several different causes and are usually divided into two groups – internal causes and external causes. Internal causes include e.g. poor craftsmanship during installation of accessories, premature ageing or water treeing due to water ingress, whereas external causes can be damage by anchors or trawling for submarine cables or by an excavator for terrestrial cables. The recently published CIGRE TB815 Update of service experience of HV underground and submarine cable systems highlights the different types of faults and their respective prevalence [1]. This brochure covers high voltage cable systems intended for operation above 60 kV and considers a period of ten years ending in 2015. 30000 circuit km of land cables and 6000 km of submarine cables was included with a total number of 744 (2.48 per 1000 km/year) faults in land cables and 22 (0.36 per 1000 km/year) faults in submarine cables reported. 64% of faults have been classified as internal and 29% as external (the remainder as unclassified faults). 56% of the faults have been attributed to the cable itself whereas the rest occurred in accessories. 82% of external faults are due to third party mechanical damage (e.g. excavators or anchors). The average outage time has been calculated to 3.5 months making a fault a costly affair, not only due to the direct repair costs which can be significant – especially for submarine cables, but also with respect to loss of revenue during an outage. According to [2] the average publicly disclosed repair cost of export cables for wind farms amount to 12.5 m£. Medium voltage cable systems can be expected to exhibit different failure statistics than what has been reported in Cigre TB815 as the design as well as stress levels differ between voltage classes. One example of medium voltage failure statistics can be found in [3] where the failure statistics of 25% of the South Korean medium voltage network (11000 km of 22.9 kV cables) is presented as 3.37 per 1000 km/year. This is a higher failure rate than reported for high voltage cables studied in Cigre TB815.
Due to the high costs associated with faults avoiding them by condition monitoring and ageing assessment is an attractive feature of any support system. In addition, being able to rapidly locate a fault to speed up repairs is also desirable. The different types of faults are commonly divided into shunt fault, open circuit faults and sheath faults (described in detail in CIGRE TB773 Fault location on land or submarine links [4]). Fault location is divided into pre-location and pinpointing techniques. Pre-location can, for instance, be performed with Time Domain Reflectometry (TDR) and the pinpointing with acoustic methods. Condition monitoring and ageing assessment can be performed by measuring partial discharge characteristics, voltage withstand and dielectric response. Line Impedance Resonance Analysis (LIRA) is capable of both fault detection and condition monitoring during operation [5]–[7].
In this paper a case study of an installation of a line impedance resonance system modified for cable monitoring during operation is presented. The system is described both with respect to hardware and software as well as implemented as a case study performed at the Kithaironas Wind Park - installed by Total Eren in Greece. In addition to online monitoring, the system allows for remote monitoring, manifested here as the wind farm in Greece being monitored from Norway. The wind park comprises 30 turbines and 16 km of medium voltage cables which was installed in 2012. The technical background of the LIRA methodology is presented as well as the approach towards solving the additional challenges associated with online measurements such as the galvanic decoupling of signal injection and pickup. The system is based on [5]–[7] but especially the sensors and the hardware need to be adapted for non-galvanic measurements. Developments also include cloud-based data storage and the possibility to access data and perform analysis in an online dashboard.
2. LIRA methodology
LIRA is based on measurements of the surge impedance of a cable at a large range of frequencies, thereby assessing the cable condition in the frequency domain. This has the advantage that the frequency content of the measurement signal can be easily modified according to the most suitable range for the cable that is being measured. A large range of cable lengths can be conveniently and reliably measured with this technology – from just a few meters to hundreds of kilometers. The algorithms at the heart of the LIRA technology are derived from the theory of electromagnetic wave propagation in transmission lines and the well-known Telegrapher´s Equation. Given that the measurements are taken in the frequency domain, efficient frequency domain algorithms can be applied to produce calculated cable properties, which give valuable insight into the cable condition. Moreover, given that this technology is fully transparent regarding the frequency content of the measurement signal, it is possible to derive these quantities at multiple frequencies, giving valuable insight as well as quality control over the calculated properties.
In an ideal cable system, the surge impedance is constant. However, discontinuities such as joints, cable damages and defects cause changes in the impedance at these discontinuity points, which subsequently cause the incoming signal to be reflected. This line input impedance signal is then measured at all the applied frequencies, and effective algorithms can be applied to this measurement signal to determine characteristics of the cable. A foundational part of LIRA is the analysis of the signal at the different resonance frequencies that are caused by the properties of the cable, and LIRA employs processing algorithm for identifying these resonance frequencies, inclusive of the identification of impedance phase zero-crossings. Some details on using zero crossings for cable diagnostics can be found e.g. in [8].
LIRA calculates physical properties of the cable based on the above, inclusive of cable capacitance, cable resistance, cable inductance, characteristic impedance, cable attenuation and other, proprietary property calculations like Delta G, a wide band tangent Delta calculation. Additionally, the cable impedance changes resulting from the measurements can be derived and visualized as a function of the cable length (denoted the Spot Signature of the cable measurement), thereby making it intuitive and easy to detect and monitor the development of suspected cable fault locations.
In the online measurement configuration of energized cables, no galvanic contact with the cable core or screen is possible. This implies that, whilst the LIRA core technology remains essentially the same as in the measurements of de-energized cables, the measurement signal must now be injected into the cable through other means than using a physical contact, and consequently, the reflected signal must be measured without having physical contact with the conducting materials of the cable. A key invention here is therefore the sensor design of the LIRA Online technology.
3. Sensor design
A capacitive and inductive pickup are used to measure the voltage and current signals induced by the current injector which can be of capacitive or inductive design. Devising such pickups is a challenge due to several reasons. First, the injected signal is superimposed on the operating voltage and current as this is an online technique which means that the power frequency should be filtered out by the sensors. This implies that an ideal pickup should have a response such as in Figure 1a or 1b with no signal transfer at 50/60 Hz and acting as a band pass filter from 100 kHz to 20 MHz. Second, the gain at the relevant frequency band is limited, mainly due to the space available in the cable termination bays. The capacitive pickup consists of a conductive plate which partially covers the surface of the connector. The larger the plate the more gain which is in turn limited by the available space. This is also valid for the inductive pickup, manifested as a Rogowski coil in the current configuration. Third, the frequency response of the actual pickups, shown schematically in Figure 1c and 1d, differs from the ideal response due to stray capacitance and coil resistance. For instance, the number of windings, distance between windings and the loop area are some parameters which influence the gain as well as the position and magnitude of the resonance in the Rogowski coil.
4. Data acquisition
An overview of the Data AcQuisition (DAQ) system is provided in Figure 2. This figure represents the essence of the components that are installed on-site. For each cable phase studied, inductive and capacitive sensors need to be installed along with the measurement hardware electronics that controls the signal injection and the system that receives the signal from the sensors. The output from the measurement electronics are real and imaginary values of the current and the voltage respectively at each sampling interval. These values are then passed through a LAN connection on to a controlling unit (the Gateway), which then packages the signal and passes the data on to the cloud sub-system. The Gateway is responsible for the management of the measurement devices and can control multiple such cable measurement configurations simultaneously through the local area network. The Gateway is also responsible for performing data integrity checks and for changing measurement parameters should this be required.
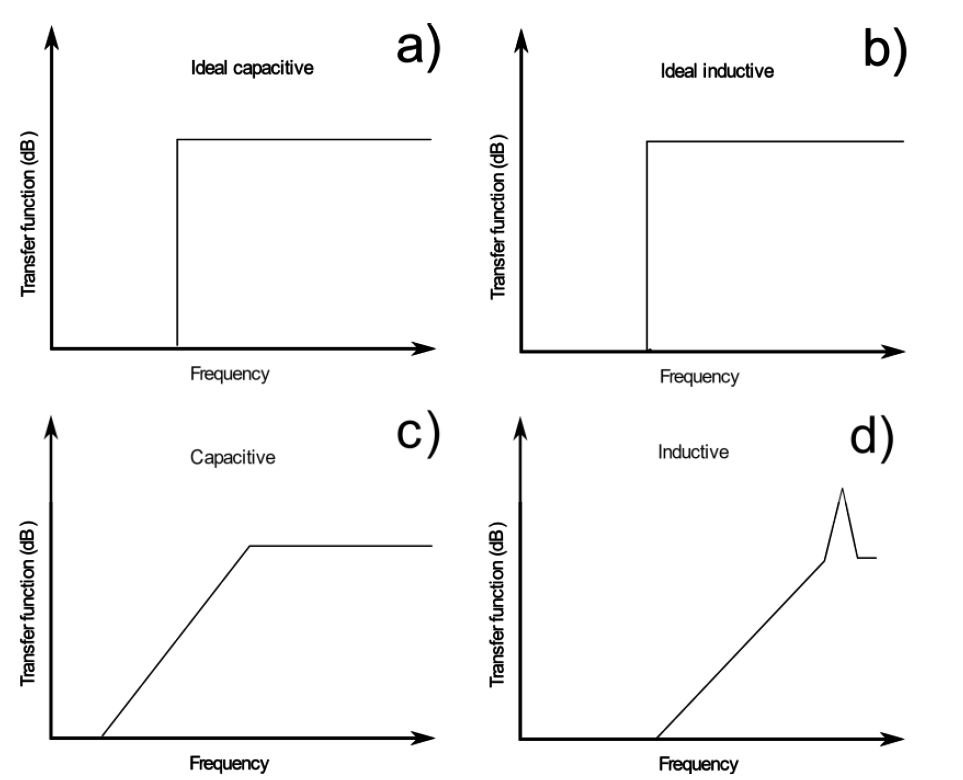
Figure 1-
a. Ideal frequency response of a capacitive pickup / b. Ideal frequency response of an inductive pickup / c. Actual frequency response of a capacitive pickup /d. Actual frequency response of an inductive pickup
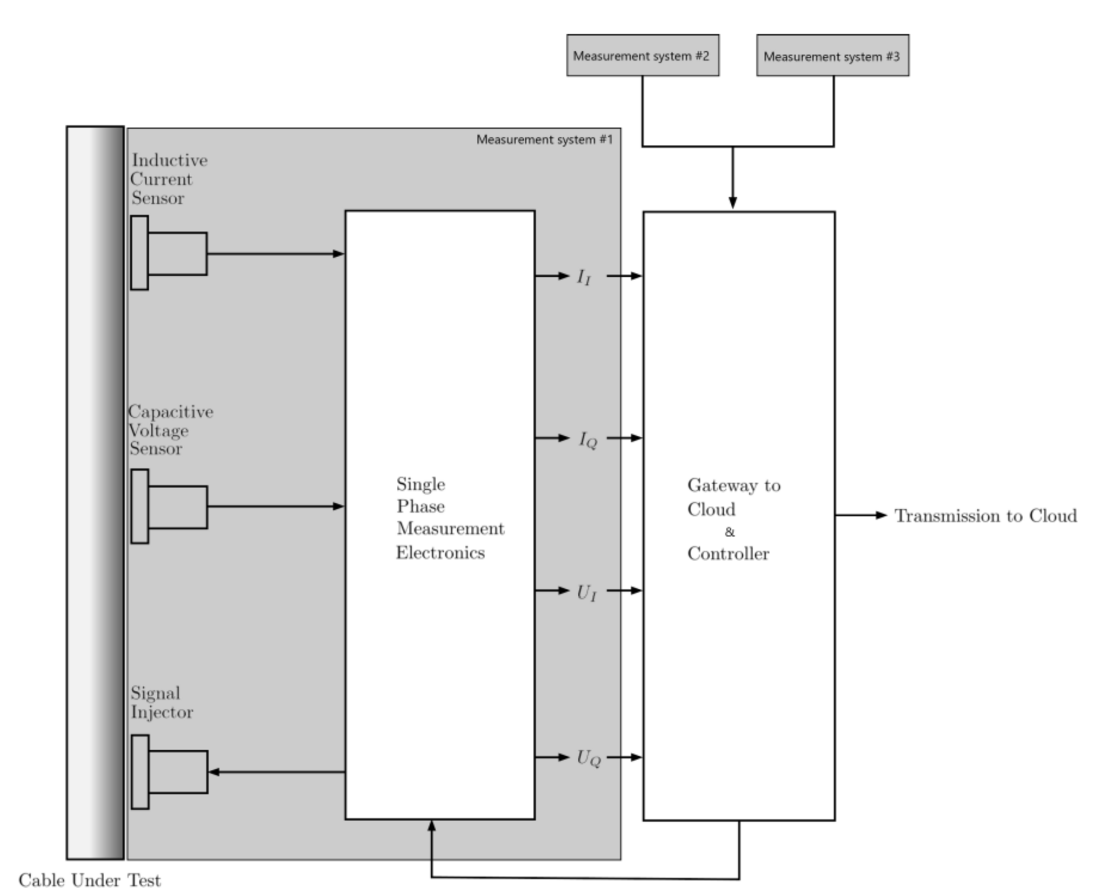
Figure 2 - Data Acquisition Sub-system
5. Software and dashboard
Some important principles behind the design of the overall system for processing and presenting the data from the cable under measurement, are that
- The system should be extensible and be positioned to take advantage of recent trends in AI techniques such as Deep Learning, so that significant amounts of data can be analyzed by machines and not only by humans;
- The system should be easily scalable to multiple cables and sites;
- The system should be results focused and provide a low threshold entry to usage for both experts and non-experts;
- The system should be easy to deploy.
These principles have been guiding the overall design, and a typical Internet of Things (IoT) architecture has been adopted for the system, where the locally placed data acquisition system is responsible for collecting the measurements, whereas a back-end processing and storage sub-system has been implemented as a cloud data processing solution. The front-end user interface has been implemented as a web-client so that it can be made available in a web browser on any type of device, be it mobile phones, tablets, or desktop.
The overall system is illustrated in Figure 3. The DAQ sub-system communicates with a data ingestion Application Programming Interface (API), which also has the responsibility of distributing the data to the appropriate micro-services for processing. The data processing sub-system is an extensible system that can be modified according to the needs of the processing and is currently implementing standard processing according to the LIRA methodology [5]–[7]. It is envisaged that deep learning algorithms and analysis functions will be deployed as part of the workflow in the future.
Given the nature of the data in that new measurements are repeatedly captured and analyzed, it has been an important aspect to capture the data contextual information in the presentation layer/dashboard, as and when new measurements are available. Also, the dashboard functionality should be highly visual, and should provide the essential information for each measurement at a glance. The main element of the dashboard has therefore chosen to be the cable under measurements, displayed in a map, so that it is easily observed which cable is measured, and what the data is.
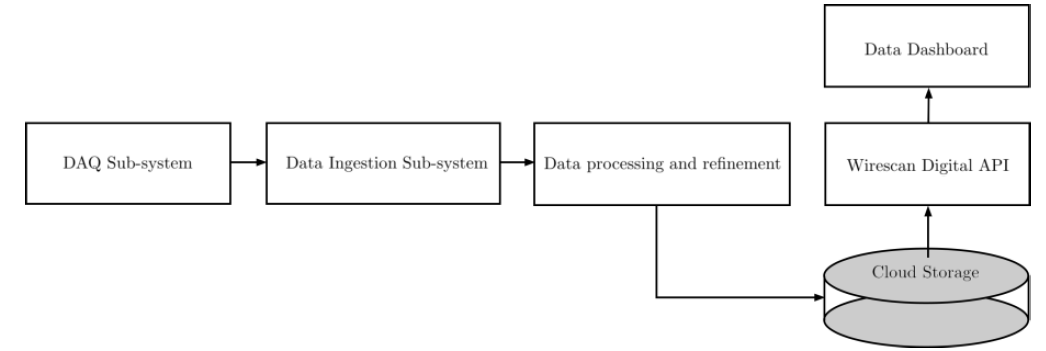
Figure 3 - The Analysis and Presentation Sub-system
6. Case study: Total Eren
Total Eren is an international player in the renewables energy generation industry, generating over 3200 MW of renewable power, and has a further 2200 MW under construction. Total Eren operates solar plants, wind farms and hydroelectric plants in Latin America, Africa, Central and South Asia, Asia Pacific, and Europe.
6.1. Overview of Kithaironas wind farm
The Kithaironas wind farm is a mature wind park operated by Total Eren in Greece. The wind park is in the Viotia region, about 1.5-hour drive northwest of Athens, where the 30 G52-850kW wind turbines generate around 86.5 GWh per year. The park is situated on a mountain ridge approx. 1000 m above sea level, as illustrated in Figure 4.
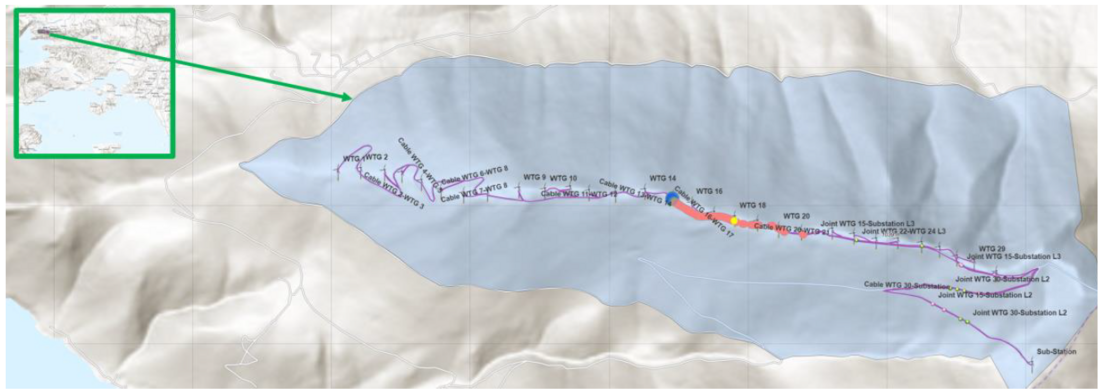
Figure 4 - Kithaironas Wind Farm Location and configuration
During this time, several issues have been observed with different cables in the park, especially with regards to export cables. Total Eren’s interest in online Line Impedance Resonance Analysis arises from the need of mitigating down-time periods and repair costs through continuous cable health monitoring, both specifically for the Kithaironas Wind Farm and strategically for the company.
The wind farm consists of two daisy chained wind turbine strings, connected to a substation which subsequently feeds power to the grid. Each string connects 15 wind turbines to the substation through two export cables. The cables, AL/XLPE/CWS/PVC 1X630/16 RM, 12/10(24) kV, are manufactured by Hellenic Cables S.A. in Greece. Each cable consists of three single phases laid together in a trench from the first turbine on the string to the substation. The cable lengths are approx. 2600 and 5000 meters.
Each phase is terminated at the turbines switch gear by means of T-type slip on connectors for C interface. The connectors are manufactured by TE Connectivity and are of type RSTI-5953. These connectors have a relatively large surface which is beneficial for size and placement of the capacitive sensors. Also, given the size of the connectors, sufficient space is available to comfortably fit the electronics bracket and the inductive pickup without any room/space constraints. The installation of the sensors and the hardware electronics on this T-type connector is depicted in Figure 5.
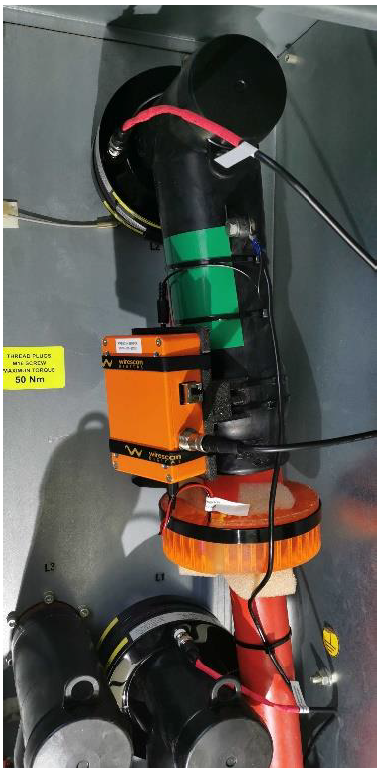
Figure 5 - Measurement equipment installed on T-Connector
6.2. Implementation
The collaboration between Total Eren and Wirescan was initiated in 2019 with technical studies of cables, terminations, and practicalities around constructing an IoT system for cable monitoring on this specific windfarm. The system was eventually installed, commissioned, and put into operation in November 2020 [1].
The systems for both cables were installed during one working day, and once the installation was complete the sensors started to gather impedance information from the live cables. The cloud connection was set up automatically by the on-site DAQ system, which will also secure the reestablishment of the connection even if a power outage or loss of internet connection should occur.
6.3. Operation
The system has at the time of writing been in operations for 75 days. The system has behaved as predicted, although some external events have allowed for appropriate stress testing of the system, including power failures and loss of internet. However, the system has re-established the measurement campaign and the connectivity to the cloud system every time such an event has occurred. The dashboard for monitoring the activity for one of the cables under measurement is shown in Figure 6.
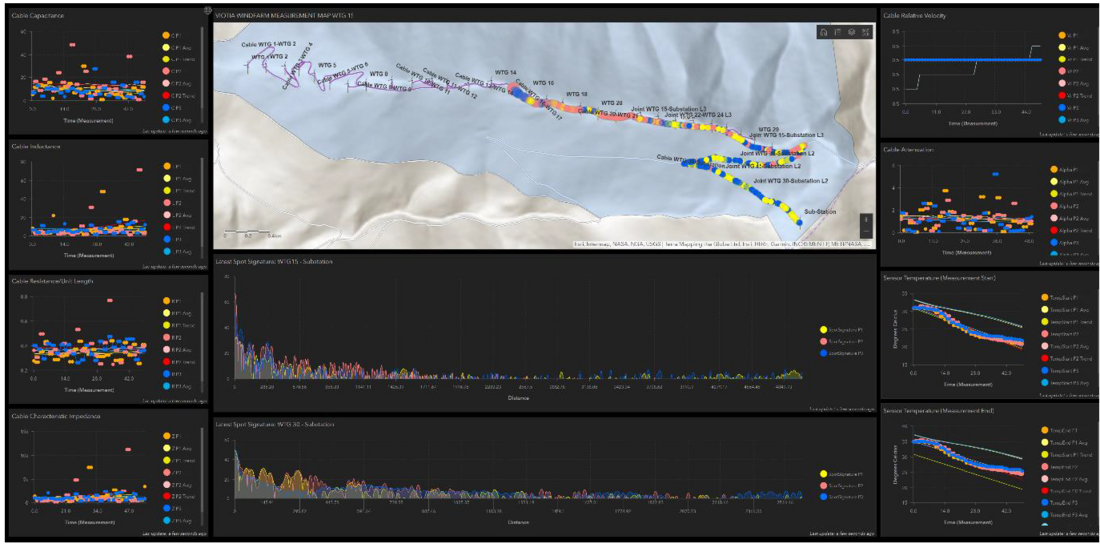
Figure 6 - Dashboard for monitoring the real-time measurements remotely
7. Discussion and conclusions
Ageing assessment and condition monitoring during operation of power cables is an attractive feature and has the potential of substantial savings through the prevention of outages and rapid fault location. This is especially true if the data and analysis is made accessible via online services and can be continuously accessed from a remote location. The case study highlighted here shows the potential of such a system as well as the added value of cloud usage with regards to collection, synthesis, and visualization of data from LIRA measurements. As any good case study, it highlights areas of improvement. Further developments include optimization of sensors and hardware with regards to noise sensitivity as well as development of configurations for different types of end connectors. There is also room for improvement with regards to long term stability of sensor gain as well as the data collection robustness.
References
- CIGRE Technical Brochure 815, “Update of service experience of HV underground and submarine cable systems,” 2020.
- Offshore Wind Programme Board, “Export Cable Reliability: Description of Concern,” vol. 2017, no. July, 2017.
- M. Bawart, T. Neier, K. Jens, and S.-M. Kim, “Estimation of the Remaining Life Time of Medium Voltage Power Cables based on the Aging Index using Unique Algorithms and a Large Database,” in 2020 IEEE/PES Transmission and Distribution Conference and Exposition (T&D), Oct. 2020, pp. 1–5, doi: 10.1109/TD39804.2020.9299991.
- CIGRE Technical Brochure 773, “Fault location on land and submarine links (AC & DC),” 2019.
- P. F. Fantoni, “Condition Monitoring of Electrical Cables Using Line Resonance Analysis (LIRA),” in Volume 1: Plant Operations, Maintenance, Engineering, Modifications and Life Cycle; Component Reliability and Materials Issues; Next Generation Systems, Jan. 2009, pp. 171–178, doi: 10.1115/ICONE17-75833.
- G. J. Toman and P. F. Fantoni, “Cable Aging Assessment and Condition Monitoring Using Line Resonance Analysis (LIRA),” in Volume 1: Plant Operations, Maintenance, Installations and Life Cycle; Component Reliability and Materials Issues; Advanced Applications of Nuclear Technology; Codes, Standards, Licensing and Regulatory Issues, Jan. 2008, pp. 177–186, doi: 10.1115/ICONE16- 48523.
- P. F. Fantoni and Anders Nordlund, Wire System Aging Assessment and Condition Monitoring ( WASCO ). 2006.
- D. Rogovin and R. Lofaro, Evaluation of the Broadband Impedance Spectroscopy Prognostic / Diagnostic Technique for Electric Cables Used in Nuclear Power Plants. Washington: U.S. Nuclear Regulatory Commission Office of Nuclear Regulatory Research Washington, 2006.
- [1] The installation was significantly delayed due to the on-going COVID-19 pandemic