A survey of the reliability of HVDC systems throughout the world during 2017-2018
Authors
M.G. BENNETT, L. CROWE
On behalf of Study Committee B4

Summary
CIGRE Advisory Group B4.04 collects data annually on the reliability performance of HVDC systems in operation throughout the world. This report is a summary of the reliability performance of HVDC systems in operation worldwide during 2017 and 2018. The summary was developed through data prepared by utilities that operate the HVDC systems and submitted to Advisory Group B4.04 of CIGRE Study Committee B4 (HVDC and Power Electronic Equipment). The report contains data on energy availability, energy utilization, forced and scheduled outages and other data in accordance with a reporting protocol developed by the Advisory Group. The report contains statistics on the frequency and duration of forced outages for the years 2017 and 2018 combined with previous data to present a cumulative average of forced outages by frequency and duration covering the years 1988 to 2018. The categories for the cumulative averages are back-to-back stations, and two terminal and multi-terminal stations with one converter per pole, and systems with two or more converters per pole.
The systems that report are line commutated converters using thyristor valves, or voltage source converters using IGBT valves.
The data in this report, together with that published in previous reports; provide a continuous record of reliability performance for the majority of HVDC systems in the world since they first went into operation.
keywords
Survey - Reliability - HVDC Systems - LCC - VSC1. Background
Advisory Group B4.04 was formed specifically to assemble and publish data on the reliability and operational experience of HVDC systems in service around the world. The Advisory Group developed definitions for the reliability terms and parameters of prime interest at that time and prepared a protocol for use in collecting and compiling the data.
The protocol has been revised periodically as experience was gained in collecting and interpreting the data [1]. The latest revision was modified to allow reporting from both Line Commutated Converters (LCC) and Voltage sourced Converters (VSC) [1].
Utilities that operate the HVDC systems collect the data for their systems in accordance with the protocol and prepare a report for each year of operation. These reports are submitted to the Advisory Group where they are compiled into a summary report.
The data were first collected in 1968, covering four dc systems utilizing mercury-arc valves. Data on the first thyristor valve system were compiled in 1972. For this paper reports were received on 49 LCC systems and 3 VSC systems for 2017, and 50 LCC systems and 4 VSC systems for 2018.
The data contained in this survey report cover operation during 2017 and 2018. Data for earlier years can be found in previous reports [2] [3] and in the list of references given in those reports. The data in this report, together with that of the previous years, provide a continuous record of reliability performance of thyristor HVDC systems for the past 47 years.
2. HVDC System Reliability Performance
The overall reliability statistics for all systems for which reports were received for 2017 and 2018 are given in Table I. Fourteen of the systems are back-to-back systems and the remainder are point-to-point transmission systems utilizing overhead line and/or cable systems.
Reports were received for the first time from Champa Kurukshetra 1, Haenam-Jeju 1, Jindo-Jeju 2, LitPol, NER-Agra BP2, Norbalt, NRTS BP3, and Rio Madeira BP2.
Table I shows the year of commissioning, the maximum continuous transmission capacity, energy availability, energy utilization and energy unavailability for the HVDC systems covered by this report.
Energy Availability is a measure of the amount of energy that could have been transmitted over the HVDC system, except as limited by forced and scheduled outages of converter station equipment and dc transmission lines or cables. Energy Utilization is a measure of the amount of energy actually transmitted. Both parameters are expressed as a percentage based on the maximum continuous capacity of the HVDC system.
It can be seen in Table I that some systems operate at very low energy utilization, i.e. they are used primarily for standby capacity, and other systems at a very high level of energy utilization, i.e. approaching maximum rated capacity.
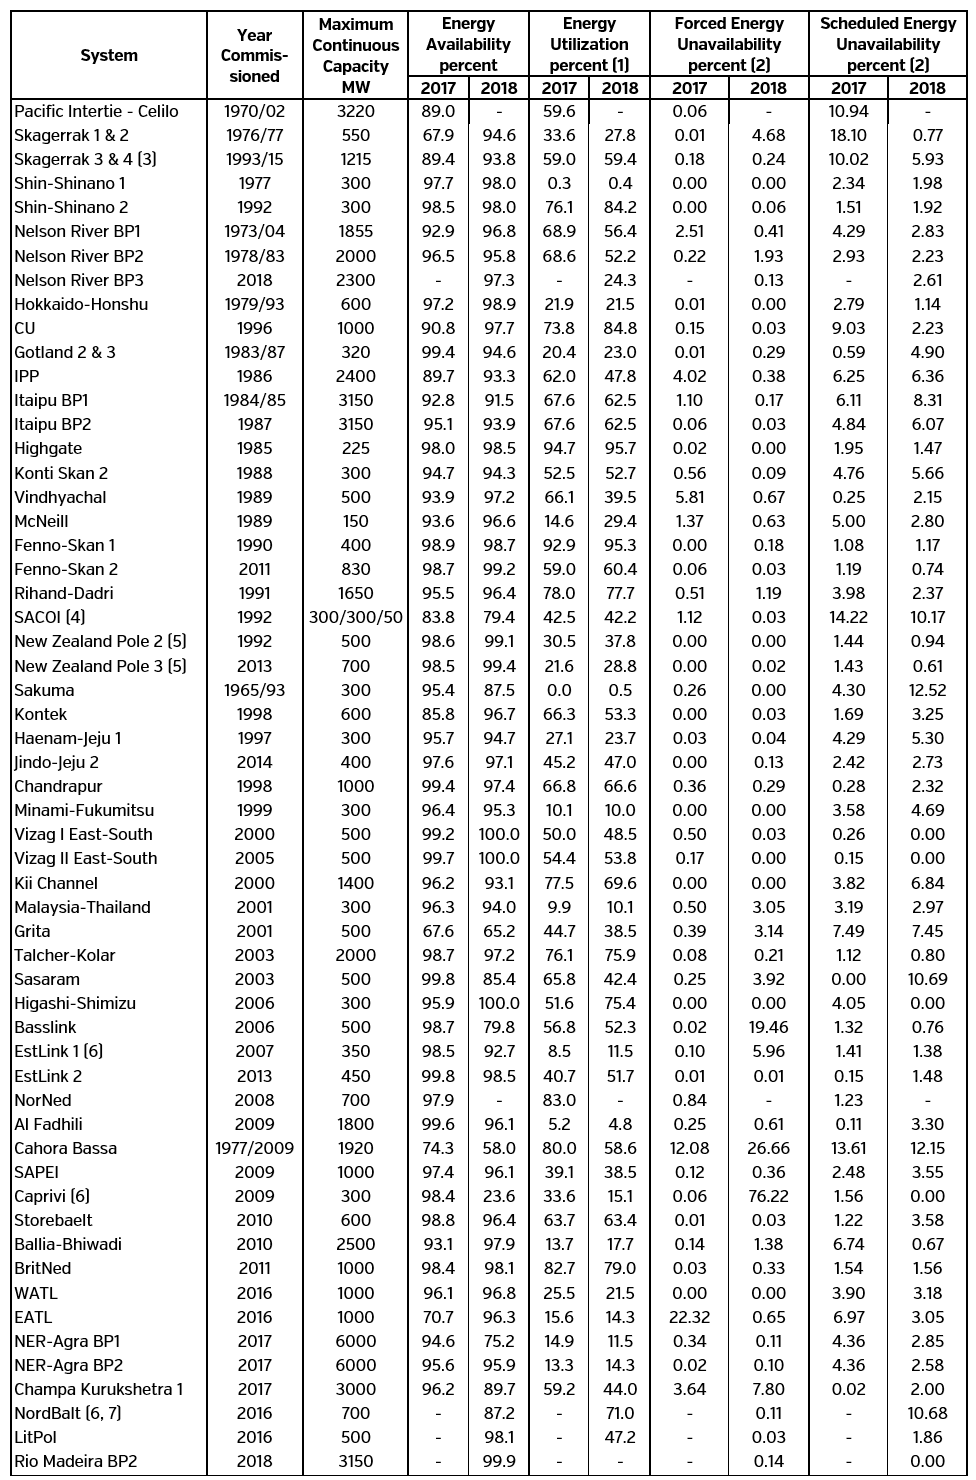
Table 1 - System Energy Availability, Energy Utilization and Converter Station Energy Unavailability
Forced Energy Unavailability (FEU) is the amount of energy that could not have been transmitted over the dc system due to forced outages. Only FEU associated with converter station equipment outages are shown in Table I, i.e. transmission line and cable outages are excluded.
Scheduled Energy Unavailability (SEU) is the amount of energy that could not have been transmitted over the dc system due to scheduled outages. Although transmission line and cable scheduled outages are included in the data in Table I, it is believed that in most cases the scheduled energy unavailability shown closely approximates that for converter stations only, since most scheduled maintenance on transmission lines and cables is generally conducted concurrently with station maintenance.
Scheduled outages have less impact on the performance of the power system than forced outages since planned outages can usually be taken during periods of reduced system load or when some reduction in transmission capacity can be accepted. Hence scheduled energy unavailability can vary substantially from system to system due to differences in utility maintenance practices and policies, and the requirement for transmission capacity.
3. Forced Outage Data
Data on forced outages are given in Tables II to V inclusive. In Table II, the data on forced outages are classified into six categories as follows:
- AC and Auxiliary Equipment (AC-E)
- Valves (V)
- Control and Protection (C&P)
- DC Equipment (DC-E)
- Other (O)
- Transmission Line or Cable (TL)
The number of forced outage events and the equivalent forced outage hours within each category, together with the totals for each dc system are shown in Table IIA for 2015 and Table IIB for 2016. Equivalent forced outage hours is the sum of the actual forced outage hours after the outage duration has been adjusted for the percentage of reduction in capacity due to the outage. For example, for an outage of one pole of a bipole system (50% loss of capacity) that lasted two hours, the equivalent outage hours would be one hour.

Table II A - Number of Forced Outages and Equivalent Outage Hours - 2017

Table II B - Number of Forced Outages and Equivalent Outage Hours - 2018
The protocol makes a distinction for reporting events that caused a reduction in transmission capacity but did not lead to a forced trip of the HVDC equipment. Table IIC summarizes the number of capacity reductions included in the statistics reported in Table IIA and Table IIB. Capacity reductions are not included in the values reported in Tables III to V, as these outages did not lead to a forced trip of equipment.
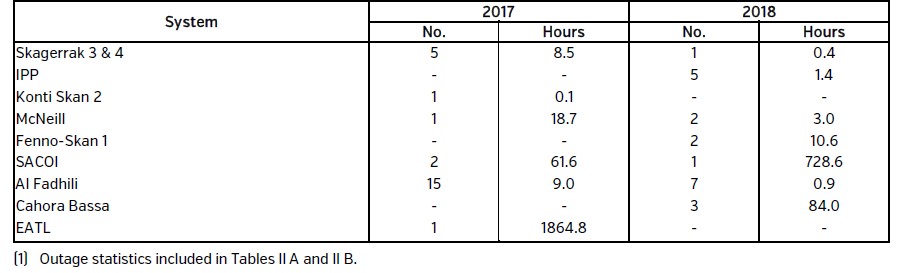
Table II C - Number of Capacity Reductions and Equivalent Outage Hours (1)
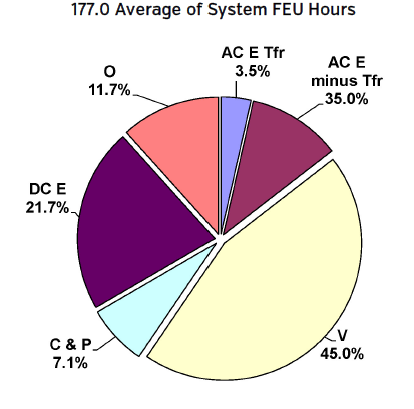
Figure 1 - Breakdown of Average FEU by Equipment Category of All Reporting LCC and VSC
HVDC Systems (2017-2018)
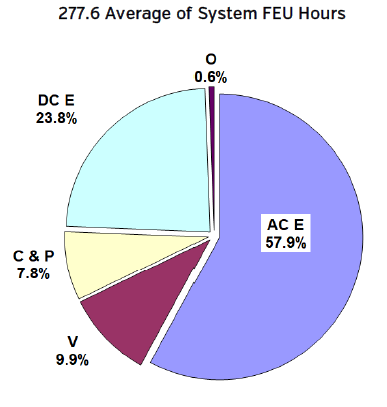
Figure 2 - Breakdown of Average FEU by
Equipment Category of All Reporting LCC and VSC
HVDC Systems (1983-2016)
Figure 1 shows a summary of the average FEU of all reporting systems for 2017 and 2018 on the basis of the major equipment categories as reported in Table IIA and Table IIB but excluding outages due to transmission lines/cables. Figure 1 can be compared to Figure 2 that shows the average FEU by category of all reporting systems from 1983 to 2016. The contribution to FEU by converter transformer failures is significantly reduced over this reporting period as compared to past results. Reports on converter transformer failures are available through CIGRE [4, 5, 6, 7].
Table III gives data for each of the dc systems on the number of forced outages that have occurred and the average duration of the outages. It should be noted that the durations are given in actual lapsed time, i.e. the capacity lost during the outage is not considered. Some outages may be converter (valve group) outages, some pole outages and others bipole outages.

Table III - Average Actual Outage Duration for Converter Station Forced Outages
Table IV shows the number of bipole, pole and converter forced outages that occurred in 2017 and 2018 for all the bipolar systems. The total number of all outages for each of the systems is also shown.
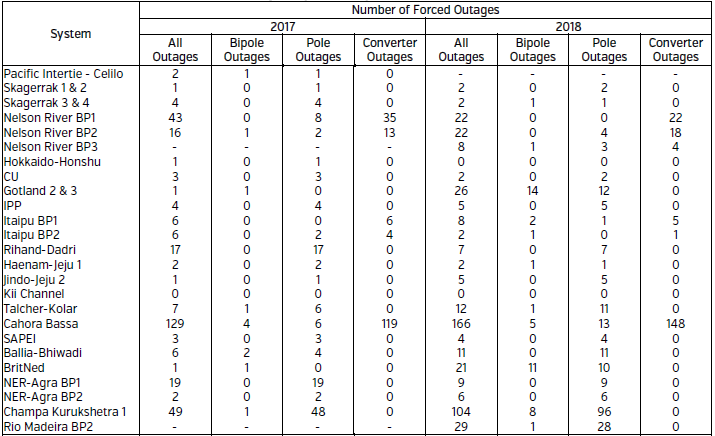
Table IV - Number of Forced Outages by Severity
Table V shows the frequency and duration of forced outages for 2017 and 2018 and the cumulative average of this data from 1988 to 2018. The table is presented in three parts: (A) covers back-to-back converter stations, (B) covers systems with one converter per pole, and (C) covers systems with two or more series-connected converters per pole. The data for systems reporting operation of less than one full year has been adjusted in these tables to an annual basis for the year, but the cumulative average is calculated for the actual total reporting period.
Table V(A) shows the average frequency (number) and average duration of station outages for back-to-back converter stations on a "per block" basis.
Tables V(B) and V(C) show the average frequency and duration of converter, pole and bipole outages for two-terminal and multi-terminal systems. The frequency of outages is given on a per terminal basis.
It is believed that the data in Table V will be useful to planning engineers involved with reliability studies of HVDC systems.
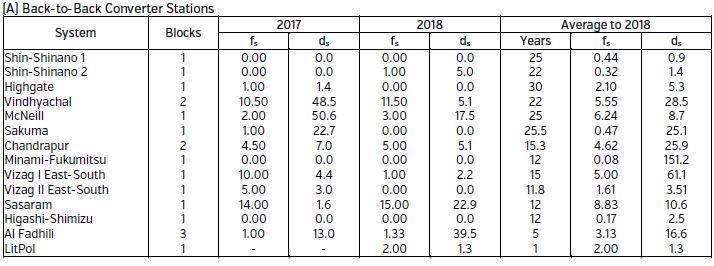
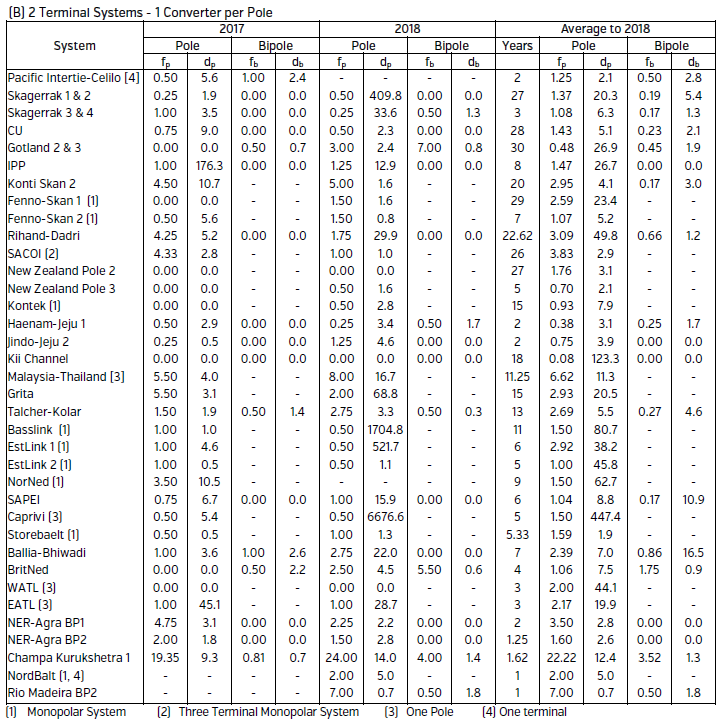
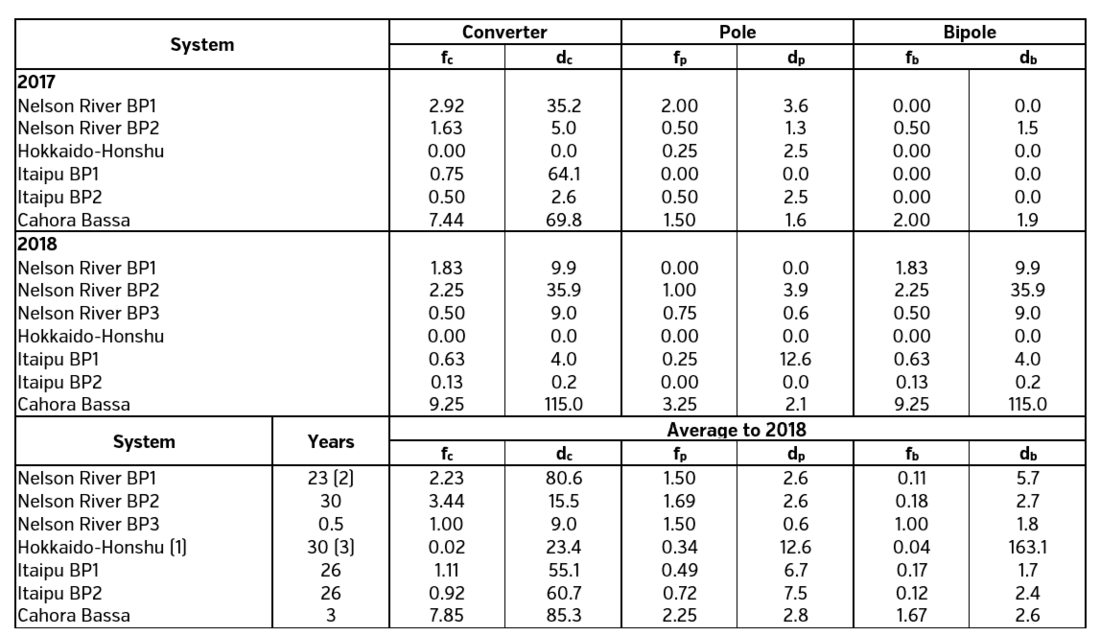
Table V – Frequency and Duration of Forced Outages
Notes to Table V
fs = number of station outages per block for back-to-back converter stations per year
fc = number of converter outages per converter per terminal per year
fp = number of pole outages per pole per terminal per year
fb = number of bipole outages per bipole per terminal per year
ds = average duration of station outages in hours
dc = average duration of converter outages in hours
dp = average duration of pole outages in hours
db = average duration of bipole outages in hours
block = one independent back-to-back converter circuit consisting of one rectifier and one inverter
4. Thyristor and IGBT Valve Performance
Data on thyristor failure rates are given in Table VI (A) and IGBT failure rates in Table VI (B). The tables shows the total number of thyristor/IGBT devices in a system, and the number of failed devices, and the associated failure rate in 2017 and 2018 for each of the dc systems. The device failure rate indicates the inherent failure rate of the thyristors and IGBTs, and their associated circuitry.
A device is an individual thyristor (with its associated auxiliary circuits) or IGBT. A number of thyristor or IGBT levels are connected in series to form a valve.
The device failure rate is the ratio of the number of device failures to the total number of thyristors or IGBTs in the system, expressed in percent.
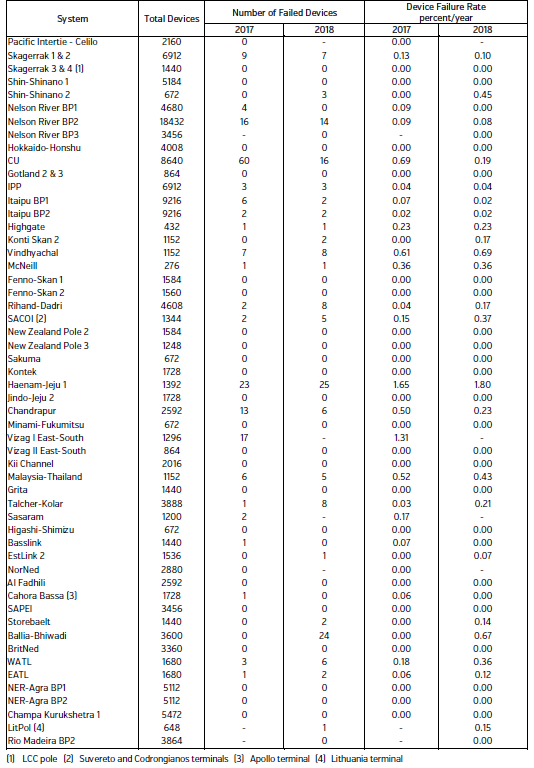
Table VI (A) - Thyristor Calendar Failure Rate
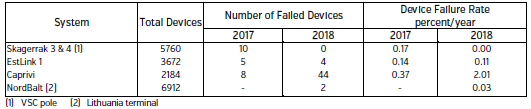
Table VI (B) - IGBT Calendar Failure Rate
5. Commutation Failure Start Rate
A parameter of interest in assessing LCC valve and control system performance is the number of commutation failure starts (CFS). A CFS is the initiation of a distinct and separate commutation failure event. CFS are usually caused by ac system voltage disturbances but may also be caused by events internal to the converter station. CFS are associated with LCC systems. The number of recordable ac faults is an indication of the number of system disturbances. More frequent CFS could be indicative of valve and control system problems. The protocol calls for the inverter end commutation failures to be reported when the ac bus voltage drops below 90 percent.
Table VII records the recordable ac faults, the CFS caused by ac system faults (external) and those initiated by control problems, switching events or other causes (internal) for 2017 and 2018.
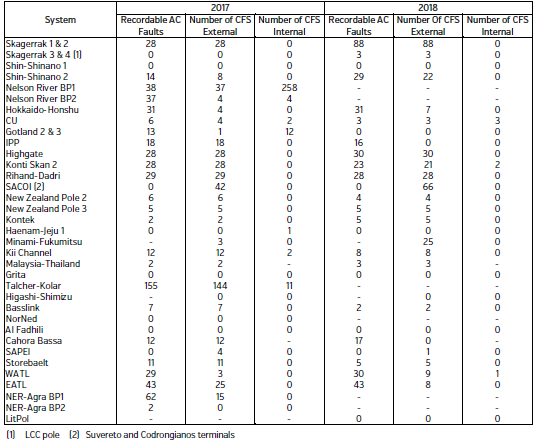
Table VII - Recordable AC Faults and Number of Commutation Failure Starts for LCC Systems
6. Conclusion
This survey provides a record of the reliability performance of over 50 HVDC systems encompassing over 20 countries worldwide. The results of the survey are presented in seven tables that are explained in detail within the paper
The average of system force energy unavailability (FEU) hours was 177.0 for the years 2017 and 2018, compared to 277.6 hours for the average of all systems reporting from 1983 to 2016.
The survey concentrates on HVDC equipment, but there were four systems that experienced extended outages due to cable issues. One other system had a major outage attributed to a fire in the valve hall.
The number of systems that report their reliability performance following the CIGRE protocol [1] has been slowly increasing over the years, but there are still a large number of existing and new HVDC systems that do not take the opportunity to participate in this work by CIGRE B4, where doing so would provide a valued contribution to the HVDC community.
The Advisory Group welcomes the participation of all HVDC systems and thanks all who work to encourage systems to report, and to the manufacturer’s representatives for continuing to support with specific information on their systems.
Acknowledgment
The Advisory Group wishes to thank the System Correspondents for providing the annual reports that form the basis for the data in this paper and for their valuable comments and suggestions on improvements to the reporting procedure.
Bilbiography
- Protocol for Reporting the Operational Performance of HVDC Transmission Systems, (CIGRE Publication 590, July 2014)
- M.G. Bennett, N.S. Dhaliwal, A Survey of the Reliability of HVDC Systems Throughout the World During 2013-2014 (CIGRE 2016 Report B4-131)
- M.G. Bennett, N.S. Dhaliwal, A Survey of the Reliability of HVDC Systems Throughout the World During 2015-2016 (CIGRE 2018 Report B4-137)
- Joint Task Force B4.04/A2-1, Analysis of HVDC Thyristor Converter Transformer Performance, CIGRE Technical Brochure 240, February 2004
- HVDC Converter Transformer Failure Survey Results from 2003 to 2012, (CIGRE, Technical Brochure 617, April 2015)
- N.S.Dhaliwal, 2015 Transformer Failure Survey Report Covering 2013 and 2014, presented to CIGRE B4 AG04, Sept 2015
- N.S.Dhaliwal, 2017 Transformer Failure Survey Report Covering 2015 and 2016, presented to CIGRE B4 AG04, Sept 2017
- N.S.Dhaliwal, 2019 Transformer Failure Survey Report Covering 2017 and 2018, presented to CIGRE B4 AG04, Sept 2019