Cyber Secured Grid Operations with Machine Learning Implementation - A Case Study
Authors
Y. S. KULKARNI, S. KUMAR - OrxaGrid, India
N.S. SODHA - Former Executive Director, Powergrid, India
S.C. KULKARNI - Chairman, Scope T&M Ltd., India

Summary
Artificial Intelligence (AI) and Machine Learning (ML) are often associated with futuristic applications - self-driving cars, speech and facial recognition, robotic control and medical diagnosis - all powered by numerous rows of servers filled with CPUs or GPUs, at remote data centres. However, AI and ML are no more esoteric terms; they are increasingly applied to immediate use cases. Smart technology puts intelligence where it is needed; modern Power System/Smart grid is a possible suitable application area to enhance Cyber Security, efficiency, reliability, and availability. Previously, if machine learning capabilities were to be deployed, they had to run on pre-configured on-premise servers. Detecting a pattern required that the data go from the device to the cloud to generate the inference. On the contrary, putting intelligence onboard a device has key advantages:
- minimal latency, since AI and ML functions are no longer dependent on an internet connection
- data communication can be filtered, prioritized or summarized based on communication constraints Cyber security and data privacy can be enhanced by keeping sensitive data on the device.
Working in concert with cloud services where data storage and processing power are plentiful and scalable, these devices are capable of processing large volumes of data locally. AI and ML driven predictions executed at the edge after having been trained in the cloud are enabling highly localized and timely “inference”. Globally, Electric Power Utilities are facing unique challenges due to higher thrust on Low Carbon Technologies (LCTs) such as Electric Vehicles, Wind and Solar Energy. These disruptive technologies have significantly changed traditional energy flow profiles in recent years. Shifting energy flow on account of LCTs coupled with ageing assets and growing electricity demand is leading to an increased risk of outages and inevitable increase in system energy losses. Power Utilities are increasingly faced with two stark choices:
- To revamp their networks at prohibitive costs; or
- To make their existing networks Cyber secured Smart grids, and maximize capacity of their current assets.
Many industry vendors - from smart metering to distribution automation to demand response - are beginning to integrate edge intelligence into their product lines. But as many are finding out, this is a complex endeavour, both technologically and culturally. By engaging with vendors and system integrators to communicate their requirements and define their use cases for edge intelligence, utilities are in a position to drive a technology revolution in the industry that will unlock new benefit streams and empower customers with more energy choices. It is pertinent to note that data is a critical component of ML and AI implementation. The more data that is collected in the cloud, the better the training models become, resulting in a smarter, faster and more accurate inference – all of which enables edge intelligence to be a true business differentiator for utilities.
This paper covers an abnormal energy prediction algorithm which indicates a probability of nontechnical losses in the network. The paper will describe the technologies, the potential benefits of such technologies and the pilot results to the electricity networks.
Keywords
Internet of Things (IoT) - Electricity Theft Detection - Power Outage Prediction - Machine Learning (ML) - Artificial Intelligence (AI) - Smart Grid - Grid Analytics1. Background
India follows a “One Nation One Grid” policy resulting in a gigantic interlinked system of around 365 GW generation capacity as on November 2019[1] and 1,58,298 circuit kilometres (km) of Central Transmission network as on March 20192 that is transmitting electricity across multiple sub-managed power grids in different States and corners of India. The grid network operated by the Central Transmission Utility, Power Grid Corporation of India Limited is successfully managed with a steady network capacity growth rate of 12% and almost zero major grid failures[2]. The sector however still faces major challenges in the management of its Distribution Grid networks. The Distribution Grid Network suffers from Aggregated Technical and Commercial Losses at 21.35%[3], resulting in exceptionally low reliability and frequent interruptions of network supply. Mismanagement of the Distribution Grid is a major concern of the Indian Government and the Indian Power Sector is undergoing a change in its regulatory policy framework to address some of these concerns. A major proposed amendment to the Electricity Act, 2003 is the separation of carriage and content businesses of the Distribution Grid Companies[4]. Another solution actively on trial but with slow adoption is the privatisation of grid operations by various models, from distribution franchisees in Bhiwandi, Agra, etc., to complete privatisation of State-owned Distribution Companies in Delhi. Distribution Grid Networks in some parts of India are adopting a licensing model (Distribution franchisee) to lease the grid infrastructure to Private vendors for operation and maintenance as well as revenue collections from its customers for fixed time periods[5]. Yet another fast-growing trend being visualised in the Indian Distribution Sector is the adoption of high-tech monitoring and control systems on the Distribution Grid infrastructure. The focus of this paper will be on the latter trend, looking at the adoption of smart sensors and machine learning algorithms to improve the performance of Indian distribution grids.
2. Introduction
Globally there are various technologies for monitoring and controlling networks and/or infrastructure and many are trending toward technologies that are integrating Information Technologies (IT) and Operation Technologies (OT). Power Grids, however, are globally considered as critical infrastructure within a country and necessary for a country’s security and economic growth[6]. Power Grids typically therefore adopt isolated systems for this need to ensure high reliability and security for monitoring and controlling its grid infrastructure. Isolated systems however are expensive to setup and cumbersome to manage. Due to this limitation, power grids globally restrict the monitoring and controlling only at critical grid nodes such as connections of large generators to the grid network, and High Voltage substations in the transmission and distribution infrastructure. Distribution grids at low voltage are typically unmonitored except for revenue billing purposes because:
- Number of grid nodes grow exponentially as we go downstream to low voltage networks;
- Economically unfeasible to setup isolated communication infrastructure and install monitoring equipment used at upstream high voltage nodes;
- Low voltage disturbances will be observed at an upstream monitored grid node;
- It is perceived that system conditions are fairly static at low voltage level.
Internet of Things (IOT) enabled sensors, low cost of machine to machine (M2M) wireless communication infrastructures such as LPWAN and NB-IOT amongst many others and also the dropping costs of high powered computing infrastructures through cloud computing is creating new possibilities in the Power Grids to monitor these low voltage grid nodes at economical costs and visualise trends and Insights of grid network performance that was previously unknown or only estimated.
In India, the cost of wireless communication (4G LTE) is among the cheapest in the world[7]. Further, the country has 451 million monthly active internet users at the end of fiscal year 2019, with only 36% internet penetration[8] (though the reliability is questionable). This combination of cheap data, low internet penetration, very high AT&C losses and mismanagement crisis of the Indian Distribution Grids is resulting in an ideal case for implementation of these high-tech IoT & Machine Learning technologies to drastically change the Distribution Grid into the Grid of the Future.
To address this gap in the market, pilots involving smart sensors and AI have been put on trial to reduce grid losses and improve efficiency. In India, various installations within the Distribution grid networks were done to assist in solving key problems identified for its customers. This paper covers one such example, where machine learning backed technology has been codeveloped and deployed for solving the customer challenge.
| Customer name | Challenge |
| Brihanmumbai Electricity Supply and Transportation Limited | Electricity theft mitigation strategies |
3. BEST Electricity Theft Mitigation
Case Background
BEST, a Public Sector Distribution Company, supplies electricity to the greater Mumbai region in Maharashtra. It has a varied electricity consumer base serving electricity to large scale consumers (Total Consumers: 8,20,000 and Total Substations: 1,773) like hotels and industries to upscale homes as well as low income shelter homes or chawls. BEST has two Zonal Vigilance Departments (North and South) to ensure ethical and legal electricity consumption by its consumers. On discussions with BEST North Vigilance Department it was agreed to do a pilot installation at BEST low-income shelter home where BEST has previously identified multiple occasions of illegal consumption of electricity. BEST vigilance department currently follows a manual analytical approach where in billing data is compared on month to identify potential sources of electricity pilferage. Locations are inspected without prior knowledge and malpractices are identified. The pilot identified location had previously witnessed multiple ingenious methodologies for electricity pilferage ranging from bypassing the consumer meter, tampering of the meter as well as illegal tapping off from different supply sources, Neutral Disturbance.
Anomaly Detection System trial was carried out at this location for early detection of electricity theft consumption.
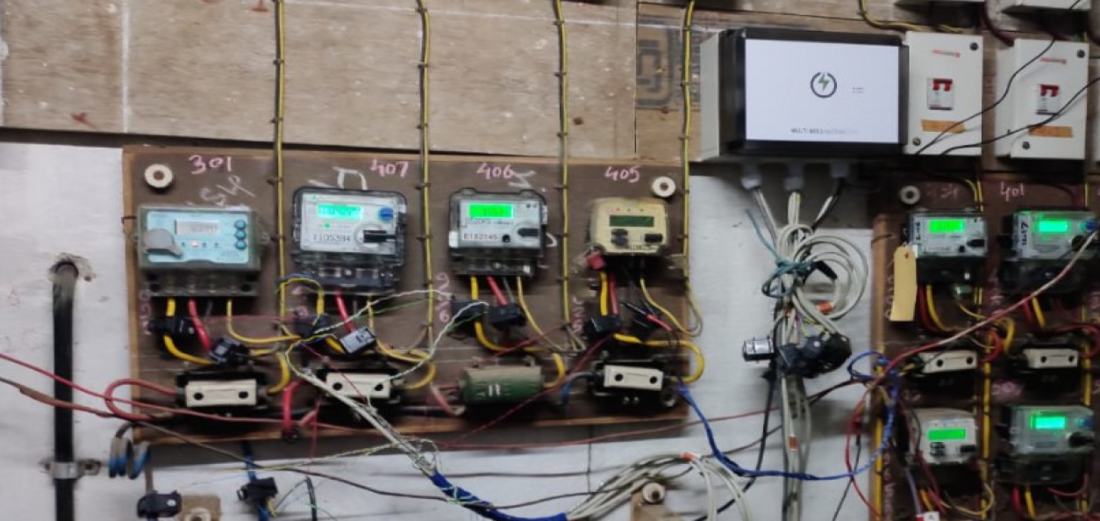
Figure 1 - Installed Device at BEST Residential Building (Vigilance North Wing)
Anomaly Detection System Technology
The system deployed at BEST location, consists of (1) Multichannel SEED device that measures electricity input supply as well as before-the-meter electricity output to each consumer and the real time data is sent to the Grid Analytics Platform. The GAP platform hosted on a cloud instance provided by AWS consists of the anomaly detection algorithm for data analysis and a Front-End Processor (FEP) service for output data visualisation. Data flow is visualised below:
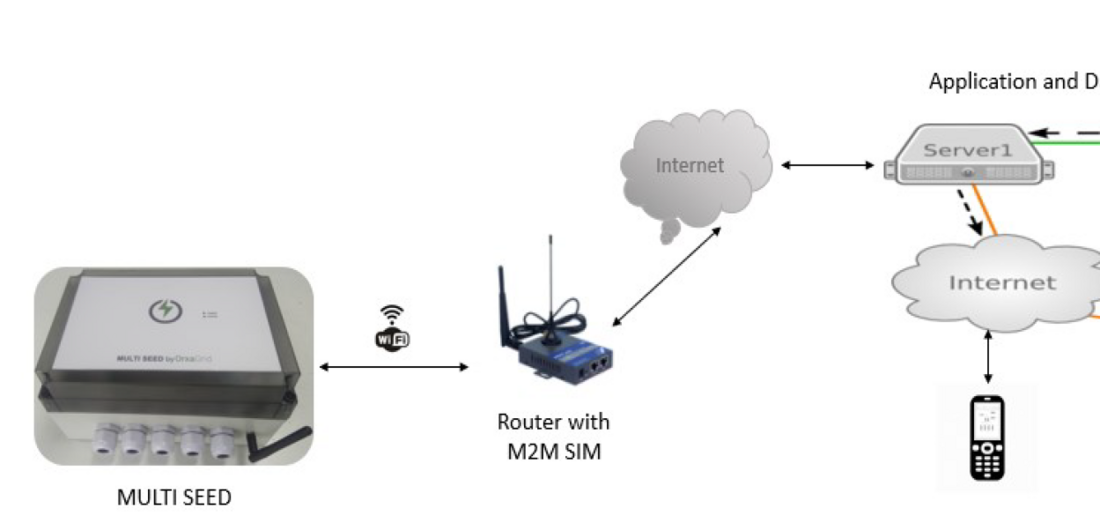
Figure 2 - Data Flow Components
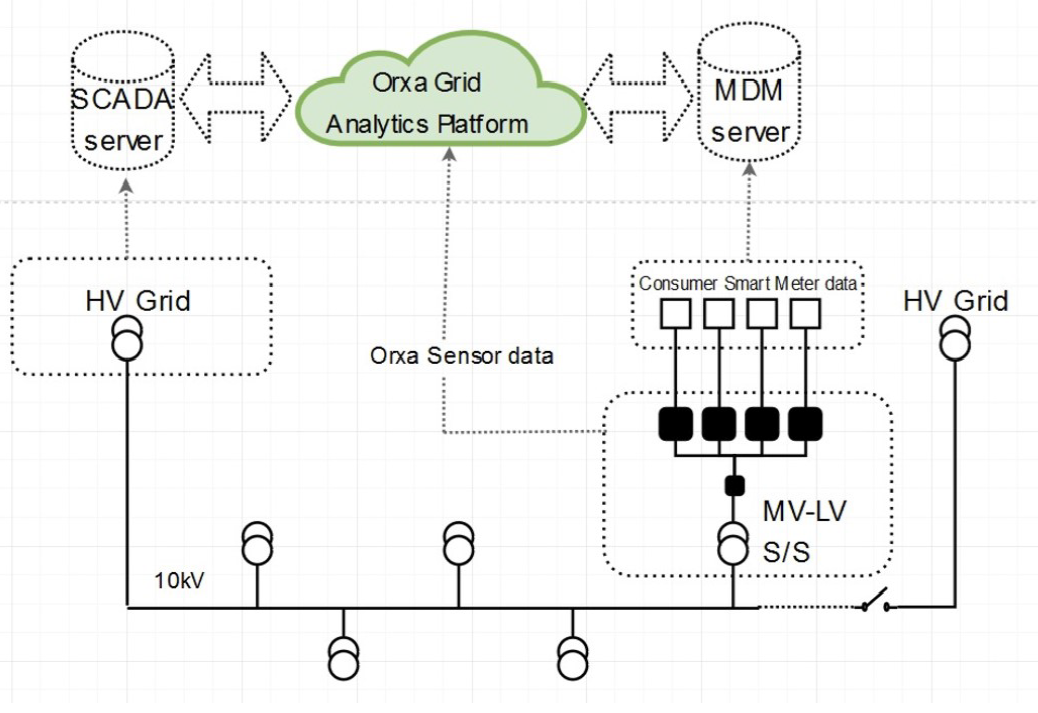
Figure 3 - Data Flow Architecture
Data Security of the system
The system has been developed with n-tier architecture, where different logical and data layer components separated from each other for wide range of clients. The data from a device posted in a fixed time interval from device built with SSL encrypted REST api calls with a JWT token authentication. Similar authentication mechanism used between the server and Grid Analytics Platform (GAP) software. Also, the entire database and analytical processing is done in a virtual private cloud (VPC) and only the public facing servers are communicated to internet via NAT gateway. Regular PEN testing has been conducted on the GAP software to handle any ongoing vulnerabilities to meet different industry standards. Finally, the system also follows the OWASP web application checklist to stay current.
Anomaly Detection Algorithm
The system utilizes machine learning for demand forecasting at the heart of the Anomaly Detection Algorithm. The algorithm was developed and tested on MATLAB R2019a following by production. Demand Forecasting is done using LSTM (long short-term memory) Recurrent Neural Network methodology. Depending on site conditions and quality of incoming data, one of two methods is applied. The difference between the two methods is the threshold limits for anomaly detection and dependent upon the costs and effects of investigating false alarms as required by the utility. The first method with wider thresholds was used for this pilot study. The forecasting tool combines various input parameters such as learning rate and cycle, as well as unique features such as date, time, and weather. A high-level description of the algorithm can be found below:
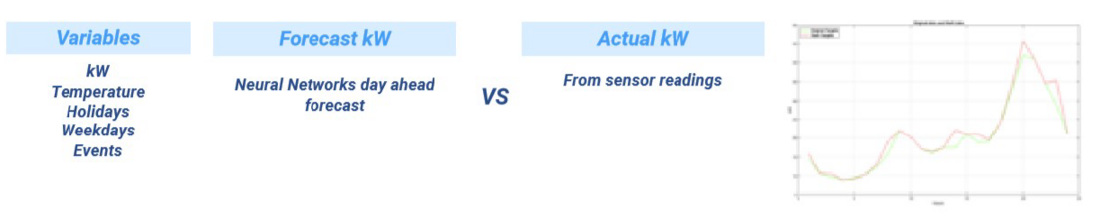
Figure 4 - Algorithm Description
The LSTM uses hyper parameters like number of layers, number of hidden and learning rate optimizer. The algorithm is built to understand holidays and weekends to learn consumption trend difference for consumers on weekends and holidays. Weekdays or working days are automatically calculated from the data column of the weekend and holidays input functions. Similarly, weather data is also utilized to learn the impact of weather on consumption. The energy demand is forecasted and abnormal anomalies are tested in a loop for initial test purpose. Forecast result is compared with actual consumption to calculate accuracy metrics, and as a standard RMSE (root mean square error) or MAPE (mean absolute percentage error), mean error and standard deviation of mean error is calculated for each iteration for checking accuracy.
The anomaly detection algorithm builds on top of the forecasting tool where in 6-8 weeks preceding of same day data is utilized for learning and forecasting consumption of a specific day (meaning: a forecast for Thursday will utilize previous 8 weeks of Thursday data for learning). The output function determines whether energy usage for a day is normal or can be classified as abnormal. Currently for the trials, a difference of 40% RMSE is defined as a setpoint for identifying abnormality trigger to the Vigilance department. A typical Actual versus predicted value for BEST Feeder which has detected abnormal consumption for 6th Jan 2020 is shown in the figure below:
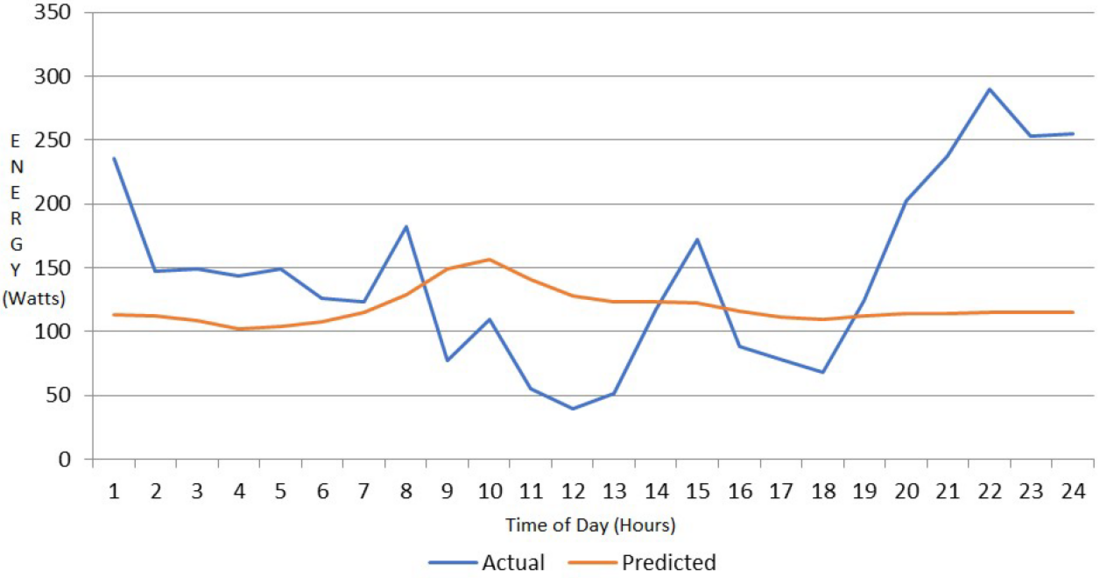
Figure 5 - Sample graph for Abnormal Condition Detection
Customer End Visualisation
The Grid Analytics Platform is combined with front-end Energy Efficiency App that is alert driven. The Anomaly Detection Algorithm runs at midnight of every day for performing prediction for previous day after training the algorithm using preceding 8 weeks of preceding same day data and compared with the actual demand for previous day and trigger anomaly or abnormal detection when the RMSE value exceeds pre-calibrated threshold anomaly triggers are logged into the system as predictions at the early start of the day. Early warnings are disbursed through the front-end Energy Efficiency App along with the demand graph and consumer location and ID for further check. The Grid Analytics Platform can also be linked with SMS and Email portal to generate level 2 and level 3 alert escalation.
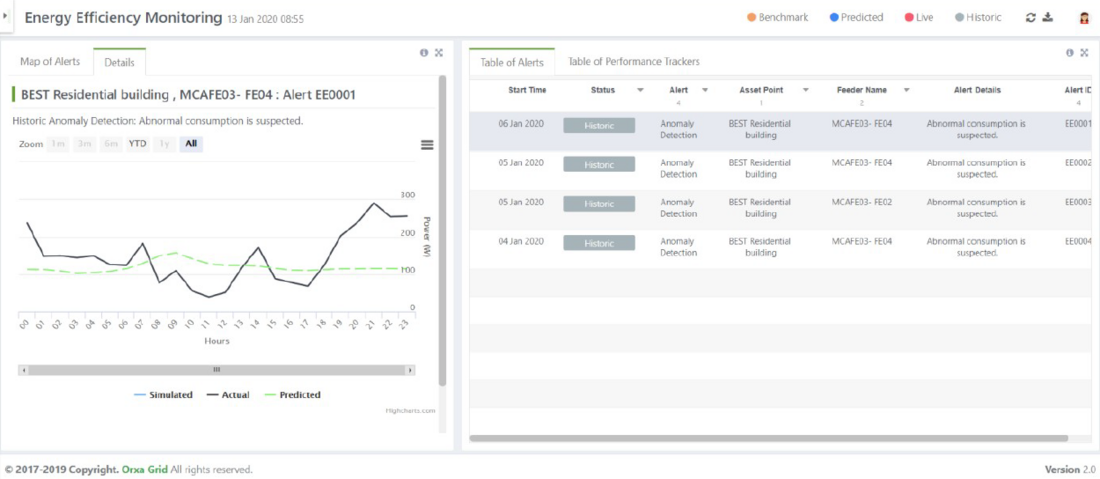
Figure 6 - Sample for Alerts table with it’s graphical representation
4. Key results & Conclusion
Rapid evolution in ML technologies and algorithms coupled with higher processing power and lower server costs are bringing about greater accuracy in predicting anomalies on the networks. These developments accompanied by reduction in costs of communication enabled sensors have resulted in the second option becoming more feasible and drastically efficient. Bringing this technology to the power grid domain requires expertise in developing specific use cases and applications that would deliver new value to utilities.
BEST is currently utilizing the EE App front end, to check for early detections of anomaly while planning their routine checks of different probable pilferage sites. Outcomes of the site visits are used to identify false positives in the algorithm and further tuning of the algorithm is under works. It is envisaged to extend this trial by monitoring more outgoing consumer connections within the service area to get better insights into distribution of demand for the input supply. The algorithm is dependent on the quality of data and hence, a larger trial base will lead to further understanding if there is any correlation between each outgoing consumer connection within an area.
It is also envisaged that the anomaly detection algorithm would be deployed at the edge level itself (within the device) and relay back only the anomaly detected area to compare consumption patterns across the area to finetune and remove the false positives detections. The algorithm serves the purpose of a low-cost solution to identify potential theft due to abnormal usage of energy. Going forward the company would process data more data sources including voltage and phase angle variables and energy meter data. Furthermore, studies to estimate type of theft would also be analysed through analysis of other data parameters. It is expected that this algorithm can help utility vigilance departments to simplify and plan their vigilance efforts based on smart data, thereby leading to lower non-technical losses.
References
- “Executive Summary on Power Sector – November, 2019”, Central Electricity Authority
- POWERGRID Annual Report 2018-19
- Dashboard at UDAY Portal, accessed at https://www.uday.gov.in/home.php
- Draft Proposed Amendment to the Electricity Act, 2003, Ministry of Power accessed at https://powermin.nic.in/
- “Distribution Franchisee section”, Maharashtra State Electricity Distribution Co. Ltd.
- “Smart Grid: Enabler of the New Energy Economy”, Electricity Advisory Committee, United States Department of Energy
- “Worldwide mobile data pricing: the cost of 1 GB of mobile data in 230 countries”, cable.co.uk
- “India Internet 2019”, Internet and Mobile Association of India