Data segregation and traffic anomaly detection within the transmission substations and the whole power system
Authors
E. CASALE, M. MATTA, M. MACINA, P. MIGLIORE, G. CECI, N. MORELLI
Terna, Italy

Summary
Ethernet technology has been introduced in the communication networks dedicated to the Italian transmission system since early 2000s, both at the local level, within the substation, and at the wide area level.
Within the substation, Terna adopted the IEC 61850 model, based on the ethernet technology, in 2004, when the first edition of the standard was released. To date, about the 40% of PACS in service in the Italian transmission system are based on IEC 61850.
Regarding the wide area network, the spread of optic ground wires (OPGW) on the overhead power lines and the consequent increasing availability of bandwidth, allowed the exploitation of the same physical support for different services related to the operation, control and monitoring of the whole power system. Furthermore, the spread of cyber security applications among digital PACS already in service, will imply additional services to be conveyed by means of the same communication network.
The paper will describe data segregation solutions adopted both at local and at wide area level to balance the need for integration, to take profit of scale economies offered by the large bandwidth of the fiber optic, with the different levels of QoS, availability and information security required by each service conveyed by the same transmission means.
Experiences and future projects related to traffic anomaly detection are also reported. These solutions, based on machine learning methods, are aimed at improving the protection of the transmission power system against unknown cyber threats.
Keywords
Data segregation - Protection Automation and Control Systems - Traffic Anomaly Detection1. Introduction
In the era of digitalization, communication services and facilities are a key pillar for the protection, control, automation and monitoring of the transmission power system.
Wider bandwidth and higher performances offered by the technological evolution, allows the exploitation of the same physical means to implement multi services purposes: examples are conventional protection applications, remote control, special protection schemes, monitoring, metering, video applications. On the other hand, each service requires specific performances in terms of latency, QoS and cybersecurity.
In the following paragraphs, general architectures of communication networks adopted in order to guarantee data segregation between command and control services, requiring higher level of data protection and availability, and other less demanding services are described.
Finally, a description of Traffic Anomaly Detection techniques for the protection of these critical infrastructures is provided.
2. Communications within the transmission substation
Since late 90s, different typologies of digital PACS have been installed in the Italian transmission substations [1]. In the following paragraphs last PACS solution specified by Terna is described.
2.1. Architecture of PACS substation LAN
According to the IEC 61850 model [2], the exchange of information within the substation is based on a fiber optic IEEE 802 ethernet LAN connecting substation level devices (substation computers, HMI Workstation, Engineering workstation and GNNS receiver) with bay level IEDs. These are classified in three classes according to their main function: Bay Protection Units (BPU), Bay Control Unit (BCU), Bay Monitoring Unit (BMU).
As shown in Figure 1, two separated PACS substation LAN are provided:
- one for protection, command, control and grid monitoring (i.e. disturbance recording) applications;
- the other dedicated to other monitoring functions and services not involving command actions on HV equipment.
The first is physically isolated from the WAN dedicated to the power system operation; the communication with remote control centres is realised by means of substation level devices having two separated physical interfaces. Within this LAN different VLANs are configured in order to:
- limit the circulation of broadcast GOOSE messages to the minimum necessary;
- differentiate the QoS levels required by each function by means of IEEE 802.1p priority tagging.
In order to ensure redundancy of physical links between the bay level and the substation level and, at the same time, to limit latencies a ring each two bays is provided. RSTP protocol is adopted to avoid message loops.
The second subnet is connected to the WAN dedicated to the operation of the power system to allow the connectivity to devices installed in kiosks at the bay level but not executing control actions on the process level (e.g. PMU, meters, HV equipment monitoring devices). In this case a star configuration is provided.
To date, the interface of bay level IEDs with HV equipment remains hardwired.
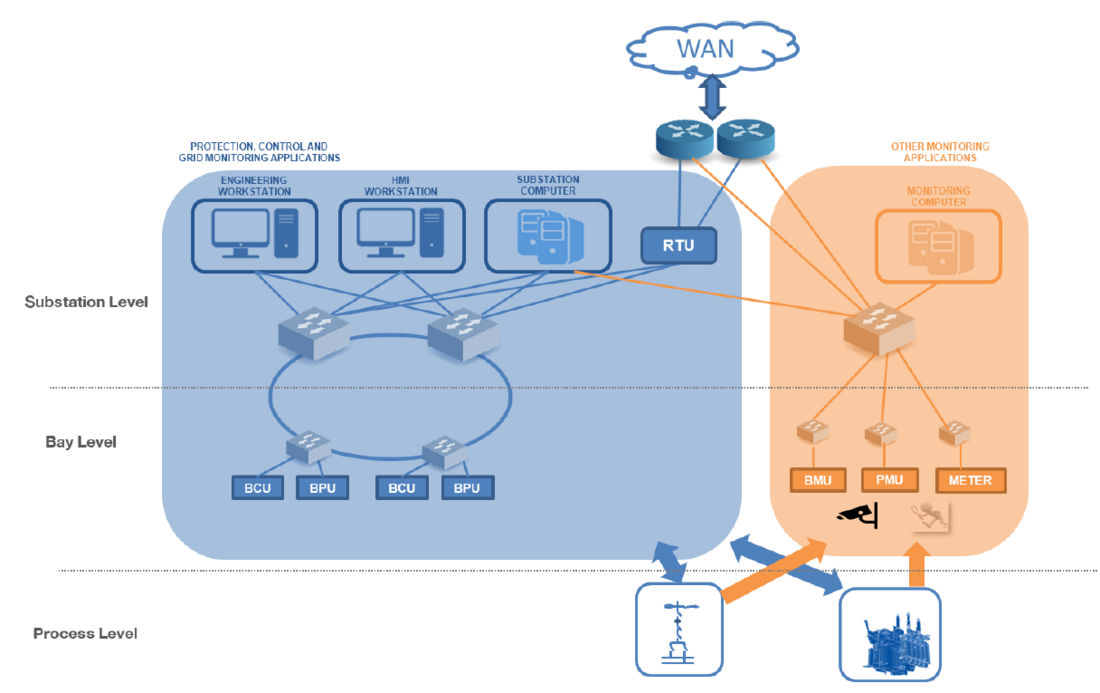
Figure 1 – General architecture of PACS substation LAN
2.2. Applications and services implemented over the PACS substation LAN
Services typically implemented over the PACS substation LAN are:
- interlocking schemes and tripping commands related to protection functions or remedial actions by means of the exchange of GOOSE messages [3];
- operation of the HV equipment by MMS command services;
- supervision and control by MMS reporting services;
- diagnostic by means of SNMP protocol;
- time synchronisation of central devices with NTP protocol;
- transmission of COMTRADE files power grid monitoring by MMS file transfer.
This initial solution has been revised over the years to cope with new functional requirements and to benefit from new performances made available by the technological evolution. Examples of functions added later are:
- transmission of events to substation devices dedicated to special protection schemes;
- monitoring of HV equipment;
- acquisition of images from the process;
- time synchronisation with Precision Time Protocol;
- digitalization of auxiliary component dedicated to the LV supply of the substation;
- transmission of PMU data for wide area applications.
A general overview of protocols and logical connections implemented over the two PACS LANs is shown in Figure 2 and in Figure 3.
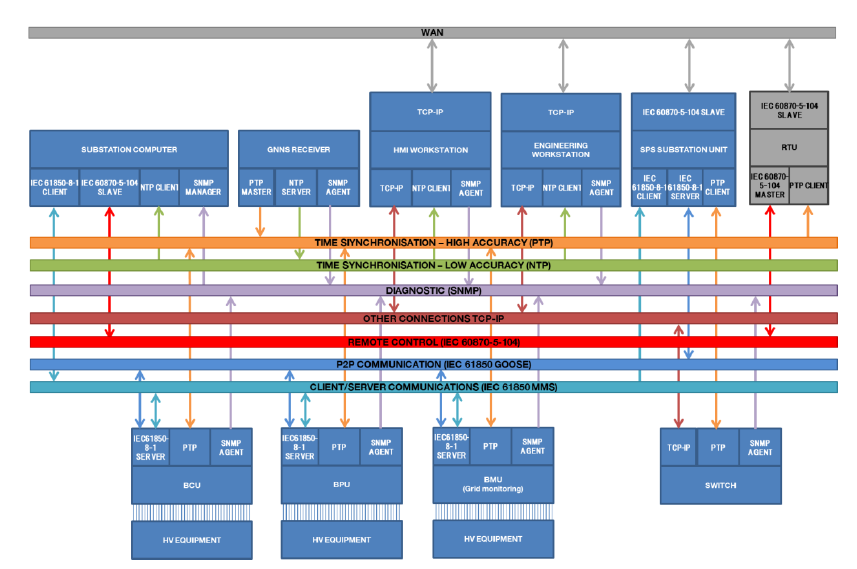
Figure 2 – Protocols and logical connections implemented over the protection, control and grid monitoring LAN
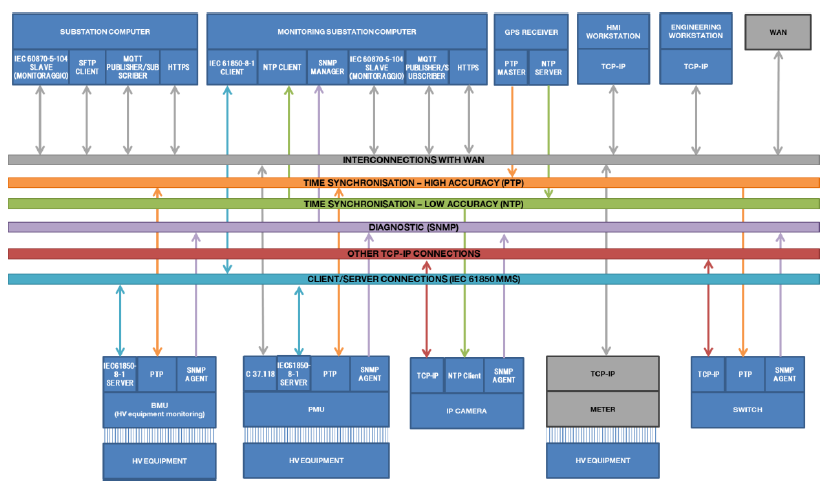
Figure 3 – Protocols and logical connections implemented over the monitoring LAN
3. Wide area network for the transmission system operation
Services provided by the wide area communication network dedicated to the transmission system operation are also continuously evolving. Since early 2000s, the following services are being implemented:
- remote control and operation by the protocol IEC 60870-5-104;
- special protection schemes by the protocol IEC 60870-5-104 for vertical communications between peripheral devices and the central system, and by means of a customized version of the IEC 60870-5-104 protocol for horizontal time-critical communications between peripheral devices;
- monitoring of the power grid and of the HV equipment with IEC 60870-5-104 and ftp protocols.
Afterwards, the following services were introduced:
- teleprotection and differential protection by means of the IEEE C37.94 protocol;
- transmission of synchrophasors by means of the IEEE C37.118 protocol;
- metering;
- interface with future IoT platforms by means of the MQTT protocol.
Remote control and operation and Special Protection Schemes services have high latency, bandwidth and availability technological requirements that are ensured by Terna's infrastructure with different transmission technologies, including OPGW proprietary fiber.
The choice of substation communication vectors is influenced by the abovementioned requirements.
Each communication channel has characteristics suited to the specific features of the specific service to be implemented. Among these, fiber optic allows the transport of all services needed for the operation of the transmission substation.
By using proprietary optical fiber on OPGW, it is possible to implement DWDM transmission technology, allowing the implementation of high-performance communication vectors. At the same time, the exploitation of the links between transmission substations ensures the necessary redundancies.
Terna also has an MPLS-based transport infrastructure that allows a more efficient management of the network. In this case, it is possible to achieve, in a structured way, services that are differentiated by characteristics and, at the same time, logically segregated using the same physical device. The process of implementing services or multi-services, is managed using the so-called VRF (Virtual Routing Forwarding). Several segregated services, one per VRF, travel within the MPLS network backbone and are transported by the same devices.
As a further guarantee of system reliability, QoS policies are also applied, which allow traffic to be identified by means of a specific “tag” inside the IP packets. The “tag” therefore allows the classification in which priority and bandwidth suitable for each network service are decided, ensuring that, in the event of network congestion, critical services are always available.
4. Traffic anomaly detection (TAD)
To date, the WAN dedicated to the control and monitoring of the physical processes related to the transmission system is exposed and vulnerable to cyberattacks due to weaknesses at the application layer protocols.
For this reason, Terna has implemented several security and monitoring systems to protect its industrial infrastructure, as shown in Figure 4.
One of the main paradigms implemented and consolidated by Terna is the ONE-WAY. Due to this policy, the current implemented solutions permit only the traffic from peripheral devices to central systems. Cybersecurity elements protect the areas outside the field systems.
In particular, the electrical substations are segregated from the control system, the SCADA's and the control room systems, by Cybersecurity devices. Access rules and application controls system are implemented on these devices.
All traffic logs are sent real time to SIEM and to the central detection systems.
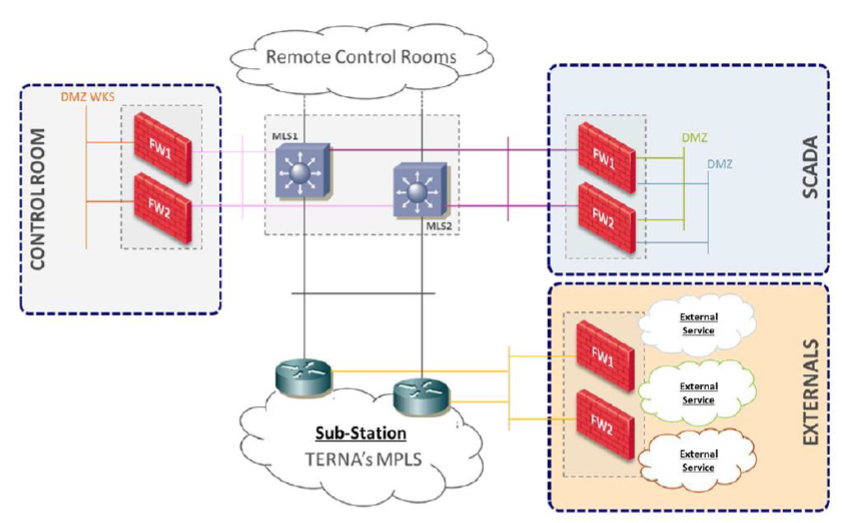
Figure 4 – High level overview of Network Segregation
4.1. Approach to TAD
Anomaly Detection (AD) is probably the most important Machine Learning strategy across all industries, technologies and use cases. The reason can be explained as traditional rule-based security systems can efficiently and effectively detect everything that is “known” but they fail when dealing with the unknown. The only way to detect that something new (even bad from a cybersecurity perspective) is going on is by statistically observing behaviours and raising alarms when anomalies are found. We refer to Traffic Anomaly Detection (TAD) as the AD applied to network flow information.
Anomalies can be described, from a business perspective, as rare events that can be considered suspicious because they are significantly different from most of the cases. From a Machine Learning (or statistical) point of view, anomalies can be observed as patterns in data that do not conform to a well-defined notion of normal behaviour.
To give an example let us imagine a set of points in which two indicators are observed (Figure 5).
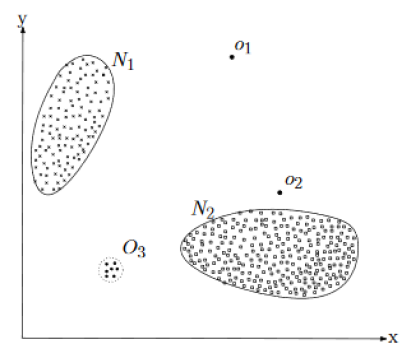
Figure 5 - Non Anomalous Regions vs. Anomalous one
The data has two “non anomalous” regions (N1 and N2) because most observations lie inside them, points that are far from such regions (o1, o2 and O3) can be defined as anomalous.
This may sound simple but, in practice, AD is generally complex and requires ad hoc, sophisticated algorithms in order to deliver satisfying results. In the following we will describe the strategies and algorithms that we put in place to perform TAD.
4.2. TAD strategies and algorithms
Anomalous conditions can be detected by observing the following point of views:
- Profiling the behaviour of any single component among time by analysing sensor data;
- Correlating the behaviour of single components to other measure by analysing sensor data;
- Modelling the behaviour of the system as a whole by analysing network traffic data.
Profiling the behaviour of any single component
By building time series of data collected from the sensors, analysing them and detecting when anomalous conditions are in place. Anomalies are extracted by detecting when a measurement is not coherent with past behavioural components like trend, seasonality, cycles, etc. The following Figure 6 shows an example in which temperature is observed over time for a transformer.
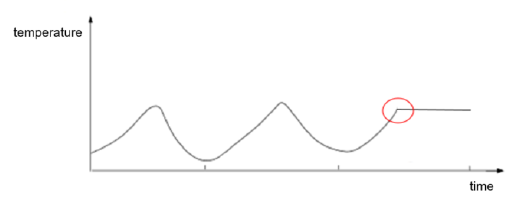
Figure 6 – The anomaly condition alert
In the instant marked in red an anomalous situation alert is triggered since temperature measurement over time (becoming constant) breaks all preceding cyclical patterns. These algorithms perform time series modelling of past data, extract model forecast on actual data and compares forecasts with actual values. Such comparison is used to compute an anomaly score.
Correlating the behaviour of single components
By cross-analysing time series from different sensors we can detect when patterns break or new ones emerge. Figure 7 gives an example in which oil temperature (red) and external temperature (blue) are observed for a transformer.
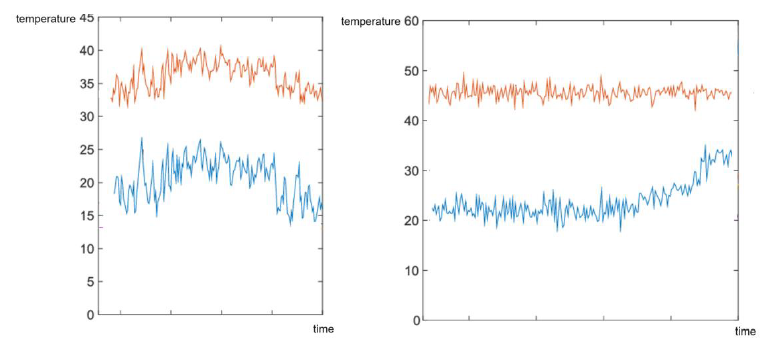
Figure 7 – Correlating the behavior
In the left graph we observe a correlation between the two measure. The AD algorithm can model such correlation and monitor it over time. In the right graph, the algorithm detects a break in the modelled correlation since the external temperature is raising while the oil temperature does not. This will raise an alert to security analysts.
Modelling the behaviour of the system
Here the algorithms collect the network data coming from all the system components and model traffic behaviour according to:
- individual behavioural patterns for each single host (e.g. IP address, …);
- behavioural patterns of the whole network.
More in detail the following algorithms have been developed and released:
- Host Anomaly Module: an algorithm that released an anomaly score for each Network session between two hosts. Such score varies between 0 and 1 where 1 stands for “maximum anomaly level”. The base algorithm builds, for each session, about 10 atomic anomaly indicators (called features or predictors). Such variables are then analysed by a nonlinear unsupervised algorithm in order to extract the anomaly scores.
Example of predictors are reported as follow:
- Number of nodes
- Number of edges
- Number of total packets exchange by hosts
- Holistic Module: an algorithm that models the behaviour of the whole network as a graph and monitors the shape of such graph over time. When a new topological shape emerges, an alert is raised. This algorithm releases an anomaly score for each time windows of 5 minutes representing the level on anomaly of the actual network shape.
This algorithm builds about 150 predictors. Such predictors are analysed by a non-linear unsupervised algorithm in order to extract the anomaly scores.
Example of predictors are reported as follow:
- Number of nodes
- Number of edges
- In-degree statistics
- Out-degree statistics
- Eccentricity statistics
- Average Path Length
- Closeness Centrality statistics
- Betweenness Centrality statistics
- Service Anomaly module: an algorithm that models, via time series, the number of bytes and packets that are transmitted in the whole network for each service. This algorithm releases an anomaly score for each time windows of 5 minutes representing the level on anomaly for the relative service. These algorithms are based on the same logics of the host anomaly module used to profile the behaviour of the single system component.
Example of predictors are reported as follow:
- Number of nodes
- Number of edges
- Number of total packets exchanged by service
- Number of total bytes exchanged by service
5. Conclusions
The paper describes technological solutions and data segregation methods applied both at substation level and at the wide area level to communication networks dedicated to Protection, Automation, Control and Monitoring of the Italian transmission system.
The one-way paradigm is adopted by Terna to protect this critical infrastructure against cyber threats. Besides conventional cybersecurity that can efficiently and effectively counter everything that is “known” as malicious, innovative Traffic Anomaly Detection techniques based on machine learning method are adopted to identify unknown threats.
References
- M. Petrini, E. Casale, M. Pedicino, T. Fabio, G. Ricci, M. Rebolini “Design, maintenance, renewal and refurbishment strategies for Substation Automation Systems” (CIGRE B5 Colloquium, September 2017, Auckland, paper 122)
- IEC 61850-8-1:2011 Communication networks and systems for power utility automation - Part 8-1: Specific communication service mapping (SCSM)
- E. Casale, C. Sabelli, M. Petrini “The automation of the future networks: from the substation automation to the grid automation” (CIGRE Symposium, September 2011, Bologna, paper 1206)