Enhancing Decision Support Tools in Ireland and Northern Ireland Control Centres to Facilitate Integration of Large Shares of Wind Generation
M. VAL ESCUDERO, J. RYAN, , O. GOULDING, D. CORCORAN, B. MALONE, P. MOONEY, G. O’DOHERTY,J. O’SULLIVAN, D. BARRY - Eirgrid, Ireland
M. RAFFERTY, J. KENNEDY, K. O’DOHERTY - SONI, Northern Ireland

Summary
In response to climate change, energy policy objectives in Ireland and Northern Ireland mandate that, by 2020, 40% of the electricity consumption must be generated from renewable sources. Governments’ objectives beyond 2020 have set a new target of 70% renewable electricity by 2030 in Ireland [1] and net zero carbon emissions by 2050 in Northern Ireland [2]. For technical and economic reasons, the dominant share of this renewable energy will come from wind. To meet these ambitious renewable electricity targets, it is necessary to regularly operate the all-island system with very high instantaneous levels of wind generation. Specifically, it has been determined that operation with 75% System Non-Synchronous Penetration (SNSP) is required by 2021, increasing to 95% by 2030 [3].
For a small synchronous power system with limited HVDC interconnection, these objectives pose a range of unique operational challenges to the safe, secure and economic management of the power system. In particular, operation with 75% SNSP presents challenges mainly related to rate-of-change-of-frequency (RoCoF), ramping capability, reactive power control, rotor-angle stability and voltage dip-induced frequency event (VDIF). Managing these technical issues requires a holistic co-ordinated approach between appropriate investment in performance capability, operational policy and the development of new tools.
In order to facilitate the operational changes required to integrate pioneering levels of wind generation, the control centres in Ireland and Northern Ireland are in continuous evolution. This paper describes EirGrid and SONI’s experience with innovative tools recently introduced in their control centres as well as three new tools currently under development: (i) look-ahead security assessment, (ii) voltage trajectory tool and (iii) ramping margin scheduling tool. As of today, tools with the new capabilities described in this paper are not available in control room environments anywhere in the world. These enhanced tool capabilities will contribute in the transition to a sustainable, carbon-free electricity system on the island of Ireland.
Keywords
Situational Awareness - Decision Support Tools - Power System Operation - System Security - System Stability - Voltage Control - Frequency Management - Wind Power Generation1. Introduction
EirGrid and SONI are the Transmission System Operators (TSO) responsible for ensuring the safety, security and reliability of the transmission grid in Ireland and Northern Ireland, respectively. Both companies are part of the EirGrid Group, which along with SEMO, operate the transmission system and the wholesale market for electricity for the island of Ireland.
The Ireland and Northern Ireland power system (referred as the “all island” system hereafter) is a single synchronous system with limited HVDC interconnection to Great Britain (see Figure 1). The individual transmission systems of Ireland and Northern Ireland are weakly interconnected via a double circuit 275 kV line and two 110kV circuits. In addition, two HVDC links with 500 MW capacity each provide interconnection with the GB system. This synchronous power system had demand figures in 2019 of 6.5 GW and 2.5 GW, peak and valley respectively. Currently, there is over 5.5 GW of variable renewable generation (wind and solar) connected to the system and additional connection of 10 GW of renewable generation is expected by 2030 [3].

Figure 1 – All Island Transmission System
In response to climate change, energy policy objectives in Ireland and Northern Ireland mandate that, by 2020, 40% of the electricity consumption must be generated from renewable sources. Governments’ objectives beyond 2020 have set a new target of 70% renewable electricity by 2030 in Ireland [1] and net zero carbon emissions by 2050 in Northern Ireland [2]. For technical and economic reasons, the dominant share of this renewable energy will come from wind. To meet these targets, it is necessary to regularly operate the all-island system with very high instantaneous levels of wind generation. Specifically, it has been determined that operation with 75% System Non-Synchronous Penetration (SNSP) is required by 2021, increasing to 95% by 2030 [3].
Integrating high levels of renewable non-synchronous generation to an electricity system poses many technical challenges and operational risks ([4]-[14]). Examples of recent incidents related to high levels of wind generation, such as the 2006 European system split [15], the ERCOT event on February 26, 2008 [16], the 2016 South Australian blackout [17] and the power disruption in GB on 9th August 2019 [18], highlight the complexity of operation in this changing environment and the need for enhanced situational awareness and decision support tools. The situation is even more complex in the all island system due to its smaller size and characteristics.
Through the multi-year programme “Delivering a Secure, Sustainable Electricity System” (DS3) [19], EirGrid and SONI have gained an in-depth understanding of these challenges and have implemented operational changes that enable secure operation with SNSP of 65% today (increased incrementally from a level of 50% in 2010). This means that, at any time, up to 65% of the system demand in Ireland and Northern Ireland can be met with non-synchronous sources (primarily wind and HVDC imports) and any excess wind generation is dispatched down for security reasons. Completion of the DS3 programme by end 2020 will enable operation with 75% SNSP which, in turn, will reduce wind curtailment and will ensure that the lowest cost generation is available to the market while achieving the 2020 renewable electricity targets.
This paper is concerned with one of the three pillars of the DS3 programme: System Tools. Specifically, the paper concentrates on control centre tools and provides an overview of innovative tools recently introduced in the control centres in Ireland and Northern Ireland as well as three new tools currently under development: (i) look-ahead security assessment, (ii) voltage trajectory tool and (iii) ramping margin scheduling tool. As of today, tools with the new capabilities described in this paper are not available in control room environments anywhere in the world.
2. Operational challenges with high share of wind generation
The transition towards sustainable, low-carbon electricity systems is driving radical changes in energy generation and transmission patterns in many parts of the world. This has introduced a range of new technical and operational issues, some driven by the volatility of renewable generation resources and others driven by changes in generation technologies from those based on large synchronous generators to those based on Power Electronic (PE) converters. Many publications [4]-[14] have described in detail the issues that need to be addressed to guarantee safe and secure operation with high shares of renewable non-synchronous generation. The most critical challenges are outlined below to contextualise with the new control centre tools introduced in Ireland and Northern Ireland:
- Reduction in system inertia, driving higher RoCoF and more extreme frequency Nadir/Zenith following large disturbances.
- Reduction of transient stability margins.
- Reduction in controllable reactive power resources.
- VDIF events.
- Increased need for real-time energy balancing due to renewable forecast errors.
- Observability and controllability of RES.
- Network congestion.
- Reduction in available short circuit current affecting the magnitude and propagation of voltage dips throughout the system (with direct consequences on voltage stability and rotor-angle stability) as well as the reliable operation of protection schemes.
- Increased number and severity of system oscillations.
- Deterioration of Power Quality indices.
- New forms of instability driven by controls in PE-converters at sub- and super-synchronous frequencies.
The tools described in the next sections – i.e. 3 (existing tools) and 4 (new tools under development) - deal primarily with items (1) to (6) in the list above.
3. Overview of existing control centre tools in the all island system
This section provides a high-level overview of some of the tools recently introduced in the control centres in Dublin and Belfast that have enabled secure operation of the all island system with unprecedented levels of wind generation reaching 65% SNSP.
3.1. Integrated All Island EMS with Real-Time Monitoring of Operational Metrics
A major upgrade of the Energy Management System (EMS) in the control centres of EirGrid and SONI took place in 2016 through the EMS Integration Project (EIP). This project delivered a single all-island EMS, thereby facilitating all island power system operation. Prior to that, only jurisdictional operation was possible. The integrated all island EMS provides enhanced control and situation awareness to the control operators in both jurisdictions through visibility and controllability of both generation and network on an all island basis. At any point in time, full operation of the entire all island system can be performed from either control centre. Coordination
of operations between both control centres is based on a common set of policies and close integration of both TSOs under a single organisation (i.e. the EirGrid Group).
New on-line functionality has been added to the all island EMS to monitor key operational metrics directly related to wind integration, namely SNSP, Inertia and RoCoF. These new features are outlined next and an example of the new displays available to the grid controllers is shown in Figure 2.
SNSP monitoring
The System Non-Synchronous Penetration (SNSP) metric was introduced in Ireland and Northern Ireland with the Facilitation of Renewables Studies in 2010 [4]. This metric describes the instantaneous level of non-synchronous resources (predominantly wind generation and HVDC imports) feeding the demand, as per Equation (1).
(1)
For system security reasons, an operational limit of 65% SNSP is currently in place, with plans to increase to 75% by 2021. The SNSP is monitored in real-time through the EMS (Figure 2, left display) and, when required, non-synchronous renewable generation is dispatched down to ensure that the operational limit is not exceeded.
Inertia monitoring
The rotational kinetic energy (in units of MW.s) from on-line synchronous units is monitored in EMS to ensure adequate frequency system performance. This metric is monitored on an all island basis and also on a jurisdictional basis (Figure 2, right display). At present, the operational minimum level of inertia in the all island system is set to 23,000 MW.s. It is expected that this operational limit will drop in future in order to accommodate higher shares of renewable generation required to meet policy targets [20].
RoCoF calculation
The prospective system RoCoF after a large disturbance is calculated in real-time based on the on-line inertia and the size of the maximum infeed (negative RoCoF) and outfeed (positive RoCoF) according to Equation (2). This value is monitored in EMS to ensure adherence to the operational limit (Figure 2, right display). At present, a limit of 0.5 Hz/s is in place with plans to increase to 1 Hz/s in 2020.
(2)
where ΔP is the generation/load lost, Hi and Si are the inertia constant and apparent power rating of the synchronous machine i (with i ranging from 1 to N - number of synchronous machines online), and Ht and St are the inertia constant and MVA rating of the tripped synchronous machine t.
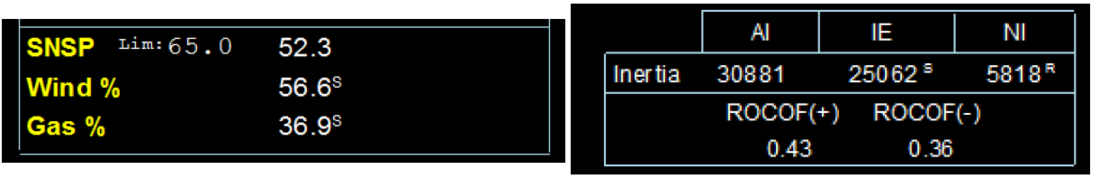
Figure 2 – Real-Time Monitor of SNSP, Inertia and RoCoF in All Island EMS
3.2. Wind Dispatch Tool (WDT)
The Wind Dispatch Tool (WDT) was introduced in the control centres of both Ireland and Northern Ireland in 2014, and later integrated in the all island EMS. This tool allows grid operators to directly control the level of wind generation in the all island system in real-time.
The WDT allows set-points to be directly issued to wind farms from the EMS. Prior to the implementation of this tool, instructions were issued manually to each wind farm. With over 250 controllable wind farms currently in operation in the all island system, the introduction of the WDT was a key milestone enabling the effective management of high levels of wind in real time. All wind dispatch instructions are logged for market settlement and reporting purposes, providing a high level of transparency to the market participants. Figure 3 shows the main display used by the grid operators to control the application.
The tool allows two distinct modes of wind dispatch down:
- Curtailment is a global function which allows the grid operator to reduce the output of all controllable wind farms at once in situations where the total wind output is considered to be a threat to the system security (e.g. SNSP exceeding secure operational limit). From the WDT display the grid operator can enter the total required wind output and request the application to calculate revised set points for each individual wind farm. The total reduction required is allocated across all controllable wind farms on a pro-rata basis. The set points are then displayed to the grid controller for review, who can modify these if appropriate. When satisfied, the grid operator issues the new set points to the wind farms directly from the tool. When the security threat disappears or reduces, the tool allows the grid operator to remove or relax the curtailment instructions. The WDT displays the total wind power availability, allowing the grid operator to know what level of output to expect when curtailment has been removed.
- Constraint dispatch allows the grid operator to reduce the output of individual or group of wind farms. This is normally required as a result of local network constraint issues. Defined constraint groups are included in the tool, within which dispatch down is “grandfathered” based on category, firmness and gate. For constraint operation the grid operator directly selects the wind farm(s) that need to be constrained, enters the desired set point(s) and issues directly to the selected wind farm(s). Within the tool, the user can also remove or relax the constraints from all the constrained wind farms.
Note that it is possible to have both constraint and curtailment in operation simultaneously. The tool ensures that the minimum of the two set points is issued to the wind farm. Application logic is provided to track the actual implementation of the set points and inform the grid operator via alarms of any implementation failures. For a more detailed description of the tool capabilities the reader is referred to [21].
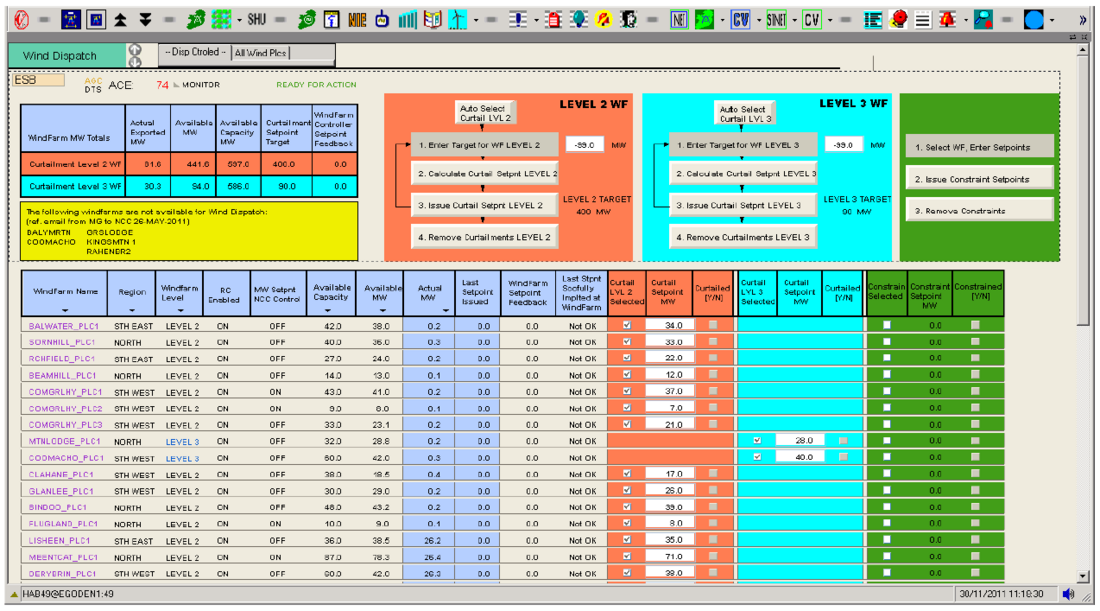
Figure 3 – WDT User Interface
3.3. On-Line Wind Security Assessment Tool (WSAT)
Traditionally, power system operation has been primarily based on off-line study methods combined with years of operators’ experience. However, the new technical challenges outlined in section 2 introduce significant complexity and operational risks and this approach can no longer ensure secure and cost-effective operation in real time. Specifically, while attempting to cover a wide range of credible scenarios to account for high variability or intermittency in generation output, security limits based solely on off-line studies can become over-conservative for a range of scenarios, while inadequate for others. This normally leads to a “defensive” mode of operation with over-commitment of conventional plant that can bring about excessive operational costs and limitation in the integration of renewable resources. Hence, new enhanced decision support tools are needed in control centres to facilitate high levels of wind. On-line tools provide the basis for a more realistic assessment of system security in highly volatile operating conditions by refreshing the input data with the actual system conditions at regular intervals.
The on-line all island Wind Security Assessment Tool (WSAT) was introduced in the control centres at Belfast and Dublin in 2012 (prior to that it was running in the Dublin control centre only). WSAT is a decision support tool whose main objective is to perform real-time security assessments for the all island system and to determine the maximum amount of wind that can be accommodated at any point in time. This functionality provides guidance to grid operators on how to maximise the utilisation of available wind resources in real time without compromising resilience.
WSAT performs steady-state (load-flow) and dynamic (RMS time domain) simulations to assess the voltage, transient and frequency stability of the all island system. These assessments are based on real-time snapshots of the system obtained from the EMS State Estimator (SE) and automatically updated every 5 minutes. The tool is very computationally intensive and runs on high performance servers providing new results to the grid controllers in Dublin and Belfast simultaneously every 5 minutes, 24/7. With more than 800 contingencies assessed, this translates to more than 2 million system security tests carried out each day. Distributed computation techniques are implemented to optimise the use of multiple CPUs.
Figure 4 shows the main displays available to the grid operators. The display on the left provides the relevant information about the current security status and the available margin before security limits are breached. This display also flags prospective system insecurities and suggests preventive correction actions. The graph on the right shows the trend in aggregated wind generation comparing wind forecast, actual wind output and the limit of secure wind.
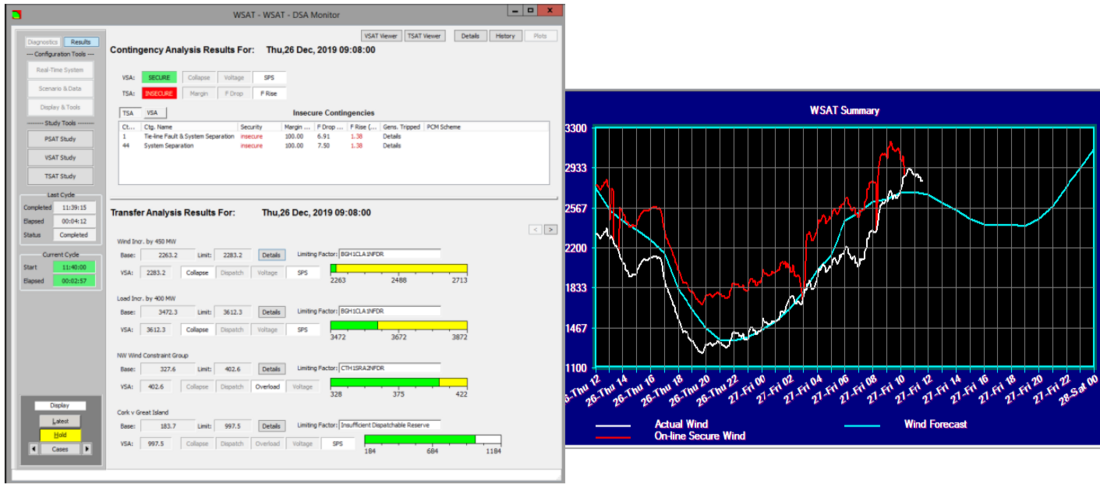
Figure 4 – WSAT Results Displays
Figure 5 shows a high-level illustration of the workflow and functionality provided by on-line WSAT. Inputs to the tool are the network model (in PSS/E format) from EMS SE and additional signals and telemetry. Python scripts are used to pre-process the PSS/E file for use within the tool, e.g. addition of missing system components (such as station service loads), merging or splitting generator units, correction of inconsistent data, etc. The converted load-flow (referred to as the base-case) is then combined with a series of files residing within the tool (e.g. contingency list, Special Protection Schemes, dynamic models, solution parameters, reactive capability curves, etc.) and two types of security assessments are performed in parallel: Static (VSA) and Dynamic (TSA). Results are then displayed and visualized in the WSAT Monitor installed on the grid controller’s workstation. In addition to the information presented in Figure 4, WSAT offers extensive output results that can be retrieved starting from high-level data (WSAT summary) to more detailed information on simulation process, tool performance, logs, etc.
One of the most powerful features of the on-line tool is the capability to import real-time EMS signals such as runback values or status of Special Protection Scheme (SPS) and to update static and dynamic model parameters accordingly to accurately reflect their response when the system condition requires such controls to react.
WSAT also has an off-line study mode capability where the grid controller can perform further analysis, e.g. to test suggested preventive correction actions or multiple contingencies outside the standard criteria. Apart from the control room environment, the off-line study functionality is regularly used to perform extensive technical analysis in near time and long term planning as well as to support the development of new operational policies. For a more detailed description of the WSAT tool capabilities the reader is referred to [22] and [23].
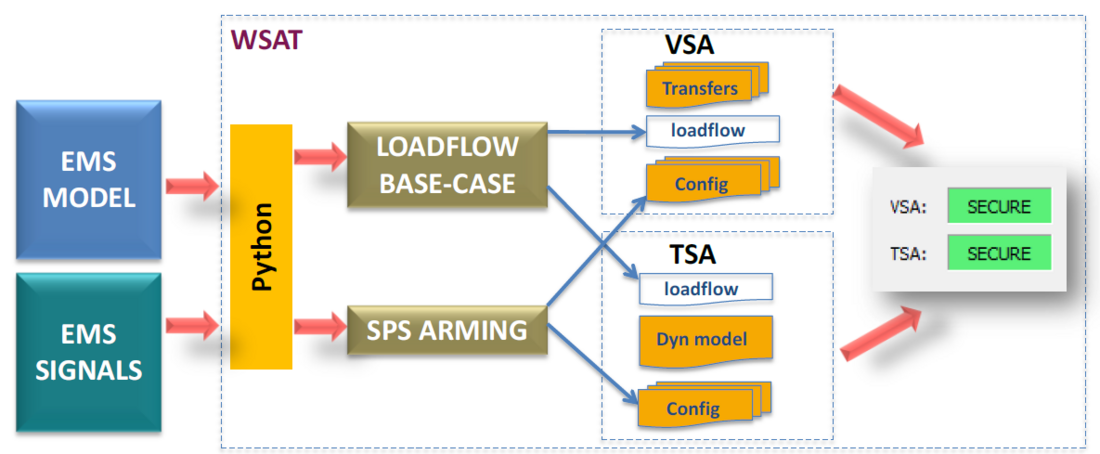
Figure 5 – On-Line WSAT Workflow
With almost a decade of operation, WSAT has become a core tool used by grid controllers in Dublin and Belfast. Based on the on-line WSAT assessments, grid controllers regularly modify the output of generators and the flows in the tie-lines as preventive actions to avoid risking system security. WSAT has also directly led to changes of transmission line protection settings in areas of the system subject to severe transient instability problems.
While highly efficient and robust, the outcomes of the tool can only be as accurate as the input data. As such, there is a high dependency on the accuracy of the EMS SE solution. The experience to date has shown that the SE works very well on providing accurate solutions at transmission nodes; however the solution can sometimes be suspicious at lower voltages mainly due to inaccurate estimation of transformer tap positions. This issue can affect initialization of dynamic models and performance of SPSs, making it an area where improvements are needed.
Furthermore, the tool relies on a large number of configuration and model data files that need to be regularly maintained, validated and kept up-to-date with the real-time network topology and on-line generation portfolio. As new plant is commissioned - e.g. new wind farms, solar parks, BESS, STATCOMs, etc. - accurate models need to be incorporated. Similarly, any changes in network topology or control settings need to be reflected in the models. A basic lesson from experience with WSAT is not to underestimate the modelling maintenance effort and to dedicate sufficient knowledgeable personnel to this task on a continuous basis.
4. New control centre tools under development
The tools described in the previous section, combined with a range of operational changes and the introduction of new system services, have enabled secure operation of the all island system up to 65% SNSP. However, meeting the 40% renewable energy target requires operation at 75% SNSP [19]. A key enabler for increasing the SNSP is the development of innovative tools for the control centres in Dublin and Belfast. In particular, EirGrid and SONI have identified that three new functionalities are required: (i) look-ahead security assessment, (ii) voltage trajectory and (iii) ramping margin scheduling. Tools providing these new functionalities are currently under development and expected to go live before the end of 2020. The main features of these new tools are described next.
4.1. Look-ahead security assessment tool (LSAT)
To meet renewable targets whilst continuing secure, reliable and economic operation of the all-island power system, EirGrid and SONI have identified the need to improve the control room options to include comprehensive WSAT-type operational security analysis ahead of time. This extended decision support tool will not only carry out stability analysis of the real-time power system, but will also look-ahead a number of hours to assess the future stability of the power system. This will identify potential instabilities in advance of the issues manifesting on the power system and will enable timely implementation of the required changes to the initial Market Management System (MMS) schedules that meet the operational security criteria. An on-line Look-ahead Security Assessment Tool (LSAT) is being developed for this purpose. This tool will predict the security of the all island power system up to typically 24 hours ahead of real-time, whilst maintaining the current 5 minute on-line WSAT (“real-time”) functionality.
Similar to the existing WSAT, LSAT will be an innovative decision support tool, which will continuously run on-line in the control centres in both Belfast and Dublin to assess system security for a number of contingencies and transfers over a near-future timeframe based on forecasted system conditions. A high-level view of the LSAT process is illustrated in Figure 6, detailing the inputs, real-time and look-ahead processes, outputs and off-line study tools. Each aspect of the LSAT process flow will be described in the remainder of this section.
LSAT will utilize data inputs from a number of existing EirGrid/SONI IT applications and tools. Initial input will be based on the generation dispatches generated by the EirGrid/SONI MMS along with the forecast load profile and interconnector transfers. Furthermore, data from the planned outages database will also be imported to ensure correct network topology for each of the time-points considered in the analysis (e.g. circuits or pieces of equipment scheduled to be switched in or out).
The above input data will be combined with the real-time network model produced by EMS SE to generate up to 10 load flow scenarios (base-cases) in user configurable time frames over a 24 hour look-ahead time horizon. This is an automatic process, which will update in 30 minute intervals and use robust load flow algorithms to obtain a solution.
Following construction, each load flow case is combined with a number of scenario definition data (as illustrated in Figure 6), which reside and are managed within the tool, and a number of security assessments are conducted in parallel. Each look-ahead case is assessed for rotor angle and frequency stability post contingency using the dynamic stability analysis tool (TSA), and for voltage stability for pre and post contingency using the steady state stability analysis tool (VSA).
Results of the stability assessments are displayed and visualized on the LSAT monitor installed on the grid operator’s workstation, and depicted in Figure 7. These outputs will assist the grid operators to produce the final generation dispatches that have all operational security criteria met in a timely manner. The initial run of LSAT will produce the security analyses for these scenarios. If the system is insecure, either dynamically or steady state, LSAT will suggest preventive control measures. Additional runs of LSAT will be conducted for the scenario with preventive control measures implemented to assess the provided solution. Similar to the existing WSAT, LSAT will have the functionality for the grid operator to conduct off-line studies for each of the assessments done on-line and also on a load flow case for further analysis, e.g. allowing the grid operator to test the suggestive preventive corrective measures from the tool or turn off special protection schemes. Again these off-line tools will also be available to other teams across EirGrid/SONI to conduct other technical analysis such as long term studies, post-disturbance analysis and user defined model validation and development.
In conjunction with the look-ahead aspect of LSAT, the existing WSAT functionality that has been running in both control centres since 2012 will be incorporated and continue to provide a real-time security assessment of the power system in 5 minute granularity. In light of this, it is severely important for usability that the real-time and look-ahead security assessment results are both clearly visible and distinctly separated to avoid confusion. The main objective is to produce a display that presents the relevant amount of information in an intuitive manner. Since the grid controllers are already familiar with the layout and functionality presented in the WSAT GUI (see Figure 4), it was important to preserve as much of this look as possible, while integrating all the new information related to the future time points. This approach ensures minimum disruption in the control centres and increases acceptability of the new tool. A prototype dashboard is shown in Figure 7. This display has a clear differentiation between the “real-time” and the “look-ahead” results and provides the user with the most relevant information regarding the current and future security status of the system. More detailed information, including time domain plots, can be accessed through the various buttons.
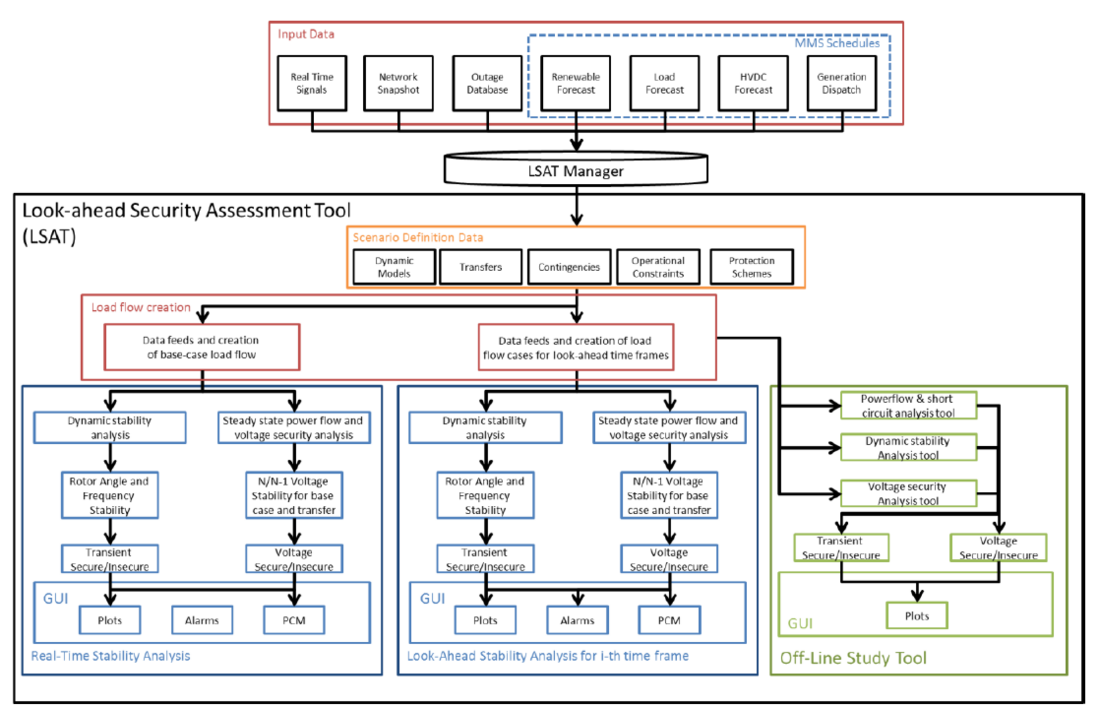
Figure 6 - LSAT process flow chart
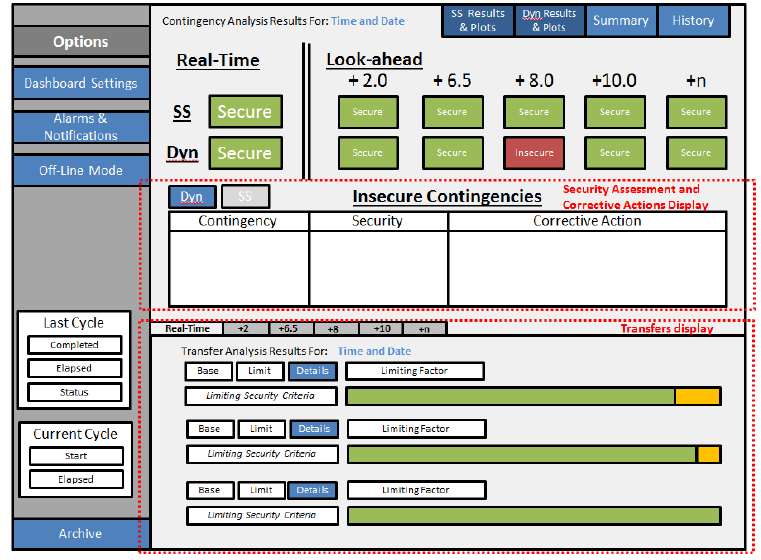
Figure 7 – LSAT main dashboard (preliminary)
4.2. Voltage trajectory tool (VTT)
Voltage management in Ireland and Northern Ireland is becoming more challenging due to the reduction of available reactive power resources (through displacement of conventional plant) and the disperse location of wind farms (with different capability characteristics), combined with increasing installation of HV cables. Currently, an active transmission constraint dictates that there must be a minimum of 8 large synchronous machines on-load at all times in the all island system. In order to accommodate increasing amounts of non-synchronous renewable generation, this constraint must be relaxed. Studies have shown that, while it is possible at certain times to operate the all island system safely and securely with fewer conventional units, special attention is required during the transition periods of entering and exiting times of low numbers of conventional units. Until now, voltage management has been mostly based on heuristic methods highly reliant on the operator’s experience. However, as more wind connects to the system, we enter unchartered territory and a new tool is required to provide guidance to control centre operators on the best methods of managing system voltage. Such a tool will determine optimal reactive targets for different types of device, delivering voltage trajectory plans secure against contingency events for a near time horizon (typically intra-day and day-ahead). An on-line Voltage Trajectory Tool (VTT) is being developed for this purpose.
The required functionality for VTT has been jointly developed by Eirgrid and SONI over the past two years. This process has included significant engagement with control centre operators in Dublin and Belfast, software vendors, academics and other TSOs. While some of the required functionalities are similar to those already implemented in some systems ([24]-[27]), the unique characteristics of the all island system and the sheer penetration levels of wind generation expected in Ireland and Northern Ireland require innovative solutions. In particular, the need to perform on-line multi-time period optimisation of reactive power resources has not been reported to date to be implemented in any control room environment.
The core functionality of VTT is to produce schedules of reactive power resources and voltage set-points in the most optimal way over a multi-hour study period (typically over a 30 hour look-ahead period) to maintain a healthy secure voltage profile in the all island power system. Unlike LSAT, VTT is only concerned with static analysis, using security constrained optimal power flow (SCOPF). The multi-time optimisation process is subject to temporal and locational constraints such as the maximum number of operator actions per time horizon (e.g. per hour) and on a jurisdictional basis. A range of timestamp remedial actions will be recommended by the tool when operating points are forecasted to be beyond the target bands. The user will be able to configure a priority ranking for implementation of such control actions.
VTT is a decision support tool. At the time of writing, it is not intended to automatically issue any schedule or operational instruction, but leave the responsibility and final decision to the grid controller. Ultimately, the tool has been conceived with an end user focus. It was of critical importance that grid controllers were engaged in the project as early as possible. This has a twofold benefit: (i) better understanding of the operators’ needs, preferences and constraints and (ii) increased likelihood of acceptance, successful implementation and use in the control rooms.
VTT will run on-line continuously in the control centres of Dublin and Belfast and will also have the capability to perform off-line studies. The introduction of this new on-line tool will facilitate a reduction in the minimum number of units that must be synchronised at all times for security reasons while optimising the use of available reactive power resources, hence facilitating the integration of higher levels of wind generation in Ireland and Northern Ireland.
4.3. Ramping margin tool (RMT)
With increasing levels of installed variable renewable generation capacity i.e. wind and solar, and further interconnection, it has become necessary to manage system uncertainty over long operational timeframes to ensure the safe and prudent operation of the all island system. To ensure system security and adequacy, sufficient ramping margin services must be in place to meet the ramping requirements at all times. To that end, the traditional reserve ancillary services (i.e. reserves across varying timeframes) have been recently augmented in Ireland and Northern Ireland with the procurement of new ramping services over three time horizons (one, three and eight hours). These new products, referred to as Ramping Margin reserves (RM1, RM3 and RM8), describe the increased MW output and/or MW reduction that a unit is contracted to provide and maintain within the defined periods. The time horizons for the RM-reserve products were selected to reflect the expected evolution time of forecast errors and the notice times of standby synchronous generation. RM services are now provided by both conventional units and aggregated demand side units (DSU).
EirGrid and SONI are currently developing a ramping margin tool (RMT) for their control centres. This tool will enable grid controllers to accurately schedule the ramping margin reserve services, thereby enabling more effective management of changing demand and generation profiles with increased wind integration. The tool’s functionality is outlined in detail in [28].
In summary, RMT can be split into two functions: reserve requirement specification for input into the market management systems (MMS) and capability monitoring of both scheduling outcomes and real-time system conditions. The reserve requirements utilise a novel forecast that characterises current weather uncertainty, ultimately producing a requirement time series that varies over time.
Despite the requirement time series being delivered into the MMS, the ramping reserve capability that would be available from the scheduling outcomes may not meet the system need. Necessary simplifications during the unit commitment and dispatch process and time delays due to process sequencing can reduce capability available in scheduling outcomes, hence driving the need for capability monitoring. Probabilistic assessments will capture the effect of non-response of resources scheduled to provide ramping reserves, thus providing the control room operator with clearer picture of system reserve margins. As user experience develops, the monitoring and requirement setting functions will be loosely coupled, allowing for requirements to be updated automatically when large variable generation forecast error events are detected.
5. Conclusions and outlook
The power system transition towards decarbonisation introduces new technical challenges and increased operational complexity. Along with the generation portfolio and transmission network infrastructure, the control rooms need to evolve. This paper has outlined both EirGrid and SONI’s experience with innovative tools recently introduced in their control centres and has presented the development of three pioneering on-line tools: (i) look-ahead security assessment, (ii) voltage trajectory and (iii) ramping margin scheduling. These enhanced tool capabilities will help maximise the utilization of wind generation resources in Ireland and Northern Ireland and will enable the fulfillment of the governments’ policy targets for 2020 while contributing to the transition to a sustainable, carbon-free electricity system on the island of Ireland.
Whilst it is expected that the above on-line tools will be adequate to meet the 2020 renewable energy targets, the authors acknowledge that new type of tools and models may be required to operate above certain levels of SNSP. In particular, traditional tools based on RMS simulation fail to capture new instability phenomena related to fast control loops in PE devices, such as those used to connect wind and solar plants. Electromagnetic transient (EMT) tools overcome those limitations but, currently, their high computational burden makes them unsuitable for on-line applications in control room environments. Further work is needed worldwide by academia and software vendors to develop new solution methods capable of reducing simulation times to levels compatible with real-time operation. EirGrid, through participation in Cigre WG C4.56 (Electromagnetic transient simulation models for large-scale system impact studies in power systems having a high penetration of inverter connected generation), is gaining a better understanding of these developments and will assess the suitability of emerging solution methods against the new challenges and needs in the control rooms environments.
References
- Department of Communications, Climate Action and Environment. (2019). Climate Action Plan 2019. Available at: https://www.dccae.gov.ie/documents/Climate%20Action%20Plan%202019.pdf (accessed 10/02/2020)
- The Climate Change Act 2008 (2050 Target Amendment) SI2019/1056 Available at: https://www.legislation.gov.uk/uksi/2019/1056/contents/made (accessed 10/02/2020)
- EirGrid Group Strategy 2020-2025. Available at: http://www.eirgridgroup.com/about/strategy-2025/EirGrid-Group-Strategy-2025-DOWNLOAD.pdf (accessed 10/02/2020)
- All Island TSO Facilitation of Renewables Studies, 2010. Available at: http://www.eirgridgroup.com/site-files/library/EirGrid/Facilitation-of-Renewables-Report.pdf (accessed 10/02/2020)
- J. O'Sullivan, A. Kennedy, J. Boemer, K. Burges, S. Stapleton, A. Mullane, J. Dillion and D. Lewis, "Maximising the real time system penetration of windfarms on the Ireland and Northern Ireland power system," in 9th International Workshop on Large-Scale Integration of Wind Power into Power Systems as well as on Transmission Networks for Offshore Wind Farms, Québec City, 18-19 October 2010.
- Y. Coughlan, J. O'Sullivan, S. Rourke and A. Kennedy, "Overcoming Operational Challenges to maximise the levels of Wind Integration – a System Operator perspective," CIGRE Paris, 2012 session. Paper C2-105_2012.
- J. O'Sullivan, Y. Coughlan, S. Rourke and N. Kamaluddin, "Achieving the Highest Levels of Wind Integration— A System Operator Perspective," Sustainable Energy, IEEE Transactions on, vol. 3, no. 4, pp. 819-826, Oct. 2012.
- I. Dudurych, M. Burke, L. Fisher, M. Eager and K. Kelly. “Operational security challenges and tools for a synchronous power system with high penetration of non-conventional sources”. Published in CIGRE Science and Engineering Journal 2017, CSE-007-010.
- P. Wall, A. Bowen, C. Geaney, B. O’Connell, N. Cunniffe, R. Doyle, D. Gillespie, J. O’Sullivan, “Common Mode Oscillations on the Power System of Ireland and Northern Ireland”. Proc. 18th Wind Integration Workshop, Dublin, 16-18th October 2019.
- CIGRE Reference Paper: “Effects of Increasing Power Electronics Based technology on Power System Stability: Performance and Operations”. A. Halley, N. Martins, P. Gomes, D. Jacobson, W. Sattinger, Y. Fang, L. Haarla, Z. Emin, M. Val Escudero, S. Almeida de Graaff, V. Sewdien, A. Bose. CIGRE Science & Engineering Journal, CSE011, June 2018.
- V. N. Sewdien, R. Chatterjee, M. Val Escudero, J. van Putten, “System Operational Challenges from the Energy Transition”. CIGRE Science & Engineering Journal, Vol. 17 February 2020.
- C. F. Flytkjaer, B. Badrzadeh, M. Bollen, Z. Emin, L. Kocewiak, G. Lietz, S. Perera, F. F. da Silva and M. Val Escudero, “Power Quality Trends in the Transition to Carbon-Free Electrical Energy System”. CIGRE Science & Engineering Journal, Vol. 17 February 2020.
- IEEE PES-TR68 Technical Report: “Impact of Inverter Based Generation on Bulk Power System Dynamics and Short-Circuit Performance”. Prepared by the IEEE/NERC Task Force on Short-Circuit and System Performance Impact of Inverter Based Generation. July, 2018.
- ENTSO-E Technical Report: “High Penetration of Power Electronic Interfaced Power Sources and the Potential Contribution of Grid Forming Converters”. Prepared by ENTSO-E Technical Group on High Penetration of Power Electronic Interfaced Power Sources. January, 2020. Available on-line at: https://docstore.entsoe.eu/Documents/Publications/SOC/High_Penetration_of_Power_Electronic_Interfaced_Power_Sources_and_the_Potential_Contribution_of_Grid_Forming_Converters.pdf (accessed 10/02/2020)
- Final Report. System Disturbance on 4 November 2006. Available at: https://www.entsoe.eu/fileadmin/user_upload/_library/publications/ce/otherreports/Final-Report-20070130.pdf (accessed 10/02/2020)
- E. Ela and B. Kirby, “ERCOT Eveny on February 26, 2008: Lessons Learned”. Available on-line at https://www.nrel.gov/docs/fy08osti/43373.pdf (accessed 10/02/2020)
- Integrated Final Report South Australia Blackout 28 September 2016, AEMO. Available on-line at https://www.aemo.com.au/-/media/Files/Electricity/NEM/Market_Notices_and_Events/Power_System_Incident_Reports/2017/Integrated-Final-Report-SA-Black-System-28-September-2016.pdf
- GB Power System disruption on 9th August 2019. Report available on-line at https://assets.publishing.service.gov.uk/government/uploads/system/uploads/attachment_data/file/855767/e3c-gb-power-disruption-9-august-2019-final-report.pdf (accessed 10/02/2020)
- EirGrid and SONI DS3 programme http://www.eirgridgroup.com/how-the-grid-works/ds3-programme/ (accessed 10/02/2020)
- DS3 Programme Transition Plan: Q4 2018 – Q4 2020. Available on-line at http://www.eirgridgroup.com/site-files/library/EirGrid/DS3-Programme-Transition-Plan-Q4-2018-Q4-2020-Final.pdf (accessed 10/02/2020)
- M. Burke, R. Lopez, C. Martin, and M. Gallagher, “Advanced EMS Wind Dispatch Tool for the Power System of Ireland and Northern Ireland,” in Proc. 13th Wind Integration Workshop, 2014.
- R. Aherne, J. Conroy, D. Connolly, R. Doyle, I. Dudurych, H. Jones and A. Rogers, ”Design and Implementation of a Tool for Assessment of Secure level of Wind on the Irish Power System” in Proc. 2010 CIGRE Session, paper C2-107.
- I. Dudurych, A. Rogers, R. Aherne, L. Wang, F. Howell and X. Lin, “Safety in Numbers: Online Security Analysis of Power Grids with High Wind Penetration”. IEEE Power and Energy Magazine 10(2):62-70. March/April 2012.
- J. Adams, S. Sharma, S. H. Huang, N. Sarma, C. Thomson, T. Mortensen and E. A. Villanueva, “ERCOT ISO's experiences in handling voltage related issues in the control center”, 2011 IEEE Power and Energy Society General Meeting.
- M. Geidl, “Implementation of coordinated voltage control for the Swiss transmission system”, in Proceedings of Melecon 2010 - 15th IEEE Mediterranean Electrotechnical Conference. Valletta, Malta. 26-28 April 2010
- T. J. Bertram, K. D. Demaree, L. C. Danglemaier, “An Integrated Package for Real-Time Security Enhancement”. IEEE Transactions of Power Systems, Vol 5, No 2, pp 592-600. May 1990.
- S. Boroczky, A. Honecker, A. Illing, M. Miller, “Automating the Dispatch of Reactive Power in Australia”, 2018 CIGRE Paris Session. Paper C2-121.
- J. Ging et al., “Integrating multi-period uncertainty ramping reserves into the Irish balancing market”. 2020 CIGRE Paris Session. Paper C5-109.