Optimal Energy Management and Control for Load Management in V2G EV-integrated Microgrid
Authors
G. BYEON, S. LIM, J. KIM, H. JO, S. KIM, H. SUN, D. YOO
Korea Electrotechnology Research Institute, Republic of Korea

Summary
Because of environmental issues as results of limited amount of fossil fuel and environmental pollution, efficiency enhancement and low carbon emissions have become a hot issue in the field of power systems. In order to reduce greenhouse gases and fine dust, it is necessary to change existing fossil fuel-based energy supply systems. In particular, the electric vehicle (EV) is considered one of the best ways to solve these problems. EVs are rapidly becoming popular every year despite the shortcomings of long charging time and lack of charging infrastructure. Among the EVs, the vehicle-to-grid (V2G) EV is attracting attention as a means to replace or support the energy storage system (ESS) because of the bi-directional charging/discharging characteristic. Since the primary purpose of V2G EVs is in transportation, the operational strategy should reflect the uncertainties due to the mobility and guarantee required SOC for driving.
This paper proposes energy management strategies for V2G EV-integrated microgrid (V2G EV-MG). The V2G EV uses renewable energy and grid power to charge other EVs and supply electrical loads. The proposed energy management strategy is to maximize the revenues of the V2G EV-MG and mitigate the impact on adjacent power systems. For load management, the forecast-based optimal ESS & V2G EVs operation scheme is applied to a V2G EV-MG under the time-of-use (TOU) pricing. Reflecting the uncertainties due to the mobility of V2G EVs, it is implemented to operate optimally even for unexpected connection and disconnection. Real-time control methods are implemented to limit peak load, prevent reverse power flow, and manage battery state-of-charge (SOC) of the ESS and V2G EVs. Proposed technologies were implemented in the real operating system (server & software) and verified using the real-time digital simulator (RTDS) based hardware in-the-loop (HILS) test system. From November 2019, demonstration tests began at Sports complex of Willings Co., Ltd. in Yongin, Gyeonggi-do, South Korea. Comprehensive demonstration results have shown that the proposed strategy is reliable and effective in actual operation.
Keywords
Vehicle to grid - Microgrid - Energy storage system - Energy management - Load management - Hardware in-the-loop - Demonstration1. Introduction
A number of advantages and applications are seen using V2G technology in various countries in the world. In Reference [1], ancillary services using V2G EVs are described. Ancillary services have mainly two categories known as the spinning reserve and the power grid regulation. V2G technology controls the EVs charging/discharging rate and thus provides the load “ancillary services”. For achieving the ancillary services effectively, the aggregator communicates with a large fleet of EVs. The function of maintaining the frequency in order to satisfy the generation and load demand is done by the power grid regulation. The spinning reserve has a fast response that responds in 10 minutes for compensating the outage of generation. Most V2G demonstrations in Europe and North America are focusing on the spinning reserve, even for applications requiring faster response, such as fast demand response (DR) [2, 3]. The solution to the issue of RES by storing energy in the form of a fleet of EVs is represented in Reference [4]. The V2G EVs acts as a “backup” for renewable energy sources (RES) such as solar and wind by providing alternative production. In the case of high production by RES the centralized power plants should reduce their production. To match the generation and consumption, excess energy is stored in EVs from RES and used when the demand is higher. In fact, it is most reasonable to use the V2G EV as a backup power source in areas where natural disasters occur frequently. The distribution or customer operator can use the stored energy of EVs to perform “load management”. This goal is achieved only by bi-directional V2G. The main objective of this service includes the flattening of the grid load profile by “peak load shaving” and “load shifting”. At the time of peak load, it is economical to take supply from V2G EVs. By applying this method, we can easily minimize the burden on power system [5]. To implement this service, the forecast based optimal day-ahead operation planning procedure is mainly used in Reference [6].
This study also deals with load management of microgrids with V2G EVs. This paper also focuses on maximizing profit and utilizing renewable energy efficiently. Section II describes the V2G EV-MG. The energy management strategy and detailed algorithms are described in Section III. The HILS test results are represented in Section IV. The contents and daily operation results of the demonstration site are introduced in Section V. The conclusion is described in Section VI.
2. V2G EV-integrated microgrid
The V2G EV-MG generally refers to a microgrid with bi-directional chargers for V2G EVs. The V2G EV-MG can be equipped with typical chargers (standard/fast), renewable energy sources, ESSs, etc. as shown in figure 1 to perform various purposes while charging EVs. If the purpose of introducing an EV is to solve environmental problems caused by the use of a fossil fuel, the source of EV charging should be renewable. In reality, it is difficult to generate all the electric power of an EV as renewable energy. However, it is possible to increase renewable energy production in the electricity mix by installing sufficient renewable energy resources and the ESS at V2G EV-MG. And the EV can also be used like the ESS because it has a battery. Therefore, various functions of energy management as well as storage of renewable energy can be implemented flexibly using the ESS and V2G EVs. The energy management discussed in this paper aims to perform load management such as energy charge minimization, peak-cut and reverse flow prevention of the V2G EV-MG at the same time as charging V2G EVs and general EVs.
The V2G EV-MG generates profits by the difference between EV charging fees and electricity charges. EV charging fees vary by charger are noted on the screen, Mobile app. EV charging fees are set by kilowatt-hour, session depending on what is permitted by state and charger ownership but the unit price rarely changes with time. In this study, it is assumed that the V2G EV-MG is charged every month by the combined amount of energy charge and peak demand charge for the month under TOU pricing. TOU is the segregation of energy rates based on the time in which the energy is being consumed. TOU is a way in which utility providers attempt to alleviate demand during peak periods by enforcing a tariff structure that charges an increased rate within the typical peak consumption time periods. The ESS and V2G EVs can reduce electricity charges by managing loads using unit price differences of TOU. Peak shaving has the effect of reducing the peak demand charge, and load shifting can reduce the energy charge. PV power generation systems reduce the energy charge by reducing the amount of electricity received from the grid. The ESS or V2G EVs are essential to perform load management for profitability and operation reliability.
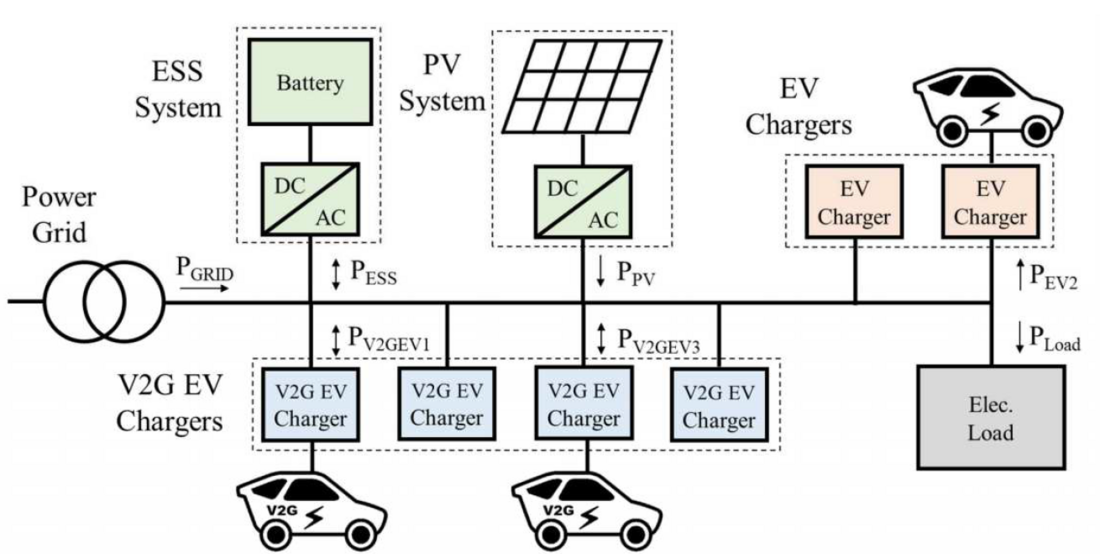
Figure 1 - Concept of V2G EV-MG
3. Energy management strategy
A two-level energy management strategy is employed for operation of the V2G EV-MG that consists of the optimal scheduling and real-time control. The proposed energy management strategy basically uses previously scheduled set points as reference values in expected conditions. Here, an expected condition means that a peak or reverse power flow does not occur even if the operation is performed with scheduled set points. The scheduled set point has some uncertainty because it is an optimized value based on forecast values (EV charging, load, PV power output patterns). This uncertainty triggers real-time control as system constraints become more likely to be violated. The real-time control algorithm takes into account the current system conditions and derives new set points every second, which overrides scheduled set points.
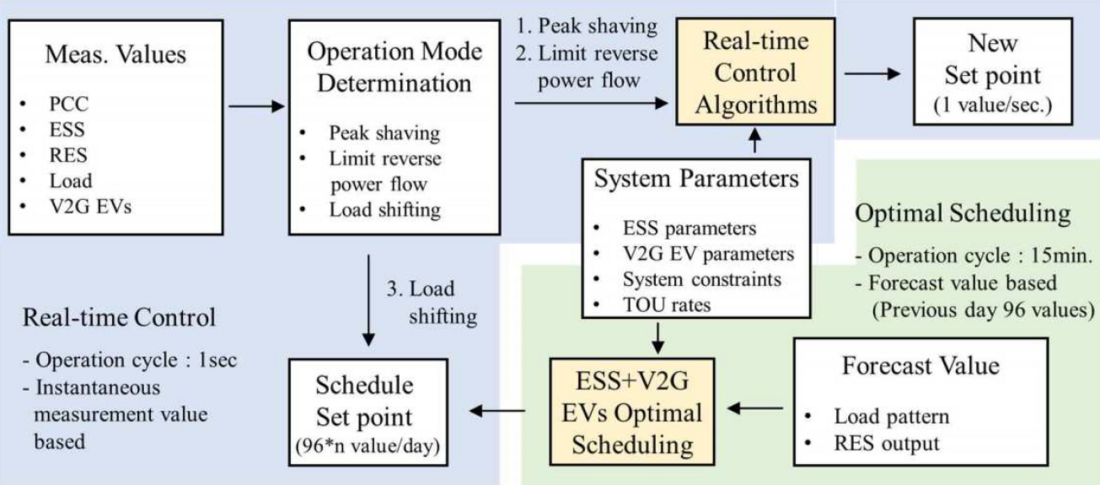
Figure 2 - Energy management strategy for V2G EV-MG
3.1. ESS & V2G EVs Optimal Scheduling
The simple structure of a V2G EV-MG equipped with the PV, ESS and V2G EVs is shown in figure 3. The goal of optimal scheduling of the ESS and V2G EVs is to minimize the energy costs of the V2G EV-MG while providing charging services to EVs and supplying electric power to loads. The scheduling process repeats every 15 minutes. At the execution of the kth order, the scheduler receives ESS and V2G EVs parameters, predetermined system constraints, TOU rates and forecast values. The optimization technique is used to derive ESS and V2G EVs power output set points that minimize the electricity charge from the present (kth order) to the 24 o'clock (96th order). The scheduling optimization is formulated as follows.
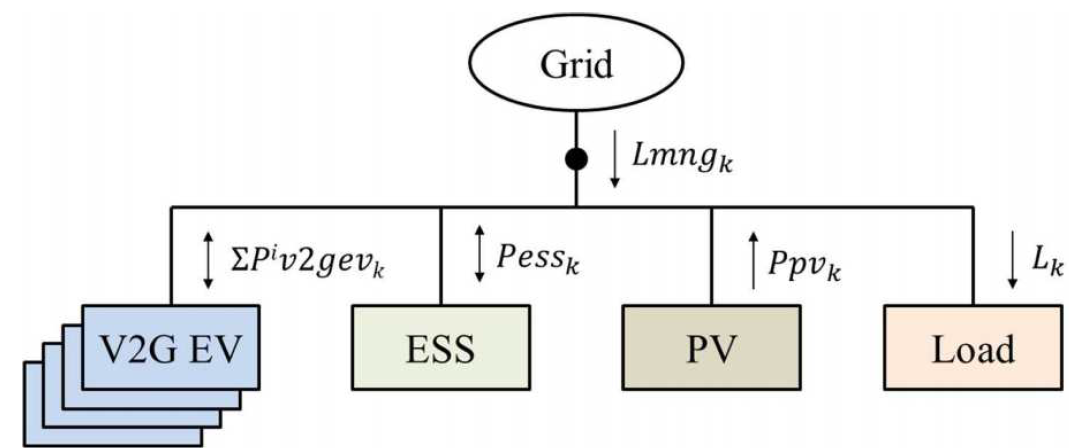
Figure 3 - V2G EV-MG configuration for optimization formula
At kth 15min. For k ∈ {1, 2, … , 96}
Minimize:
(1)
Subj. to:
(2)
(3)
(4)
(5)
i ∈ {1, 2, … , n}
(6)
(7)
where k represents the sequence number of 15 minutes of the operation day, i represents the sequence number of V2G EVs, Pessk,Piv2gevk scheduled outputs of the ESS and ith V2G EV at the kth order of the day (positive sign indicates discharging and negative sign charging), Tk electricity price for the kth order, Lmngk the receiving power from the grid at the kth order, Lk is the sum of forecast EV charging power and electric load at the kth order.
where Pessmink and Pessmaxk represent the charging limit and discharging limit of the ESS inverter at the kth order, SOCmink , SOCmaxk and SOCk the lower, upper operation limits of SOC and estimated SOC of the ESS at the kth order, Lpccmink and Lpccmaxk the lower and upper limits of V2G EV-MG’s receiving power from the grid at the kth order, Piv2gevmink and Piv2gevmaxk represent the charging limit and discharging limit of the ith V2G EV charger at the kth order, the lower, upper operation limits of SOC and estimated SOC of the ith V2G EV at the kth order.
3.2. Real-time control algorithms
There is no system that can fully predict the future, so real-time algorithms are needed to modify the results every moment if necessary. If it is likely that a situation will occur that violates the criteria based on current measurements, recalculate set points by selecting the appropriate mode. When a peak occurs, the system calculates the discharging power and checks SOC to derive final set points. Since the peak value is calculated as a mean value over a period of time, the discharge power should be calculated so that the mean value of the period is less than the peak limit. If the PV power output is greater than the charging power of the EVs and electrical load consumption, the surplus power will flow into the grid. The system must calculate this surplus power accurately and store it in the battery in real time. If the peak or reverse power flow does not occur, check whether the pre-calculated schedule set points are available, and then determine final set points. All processes must operate on a minimum operating unit of the actual operating system in which the energy management strategy will be implemented and are referred to here as real-time control. In this study, the minimum operating unit of the system is 1 second.
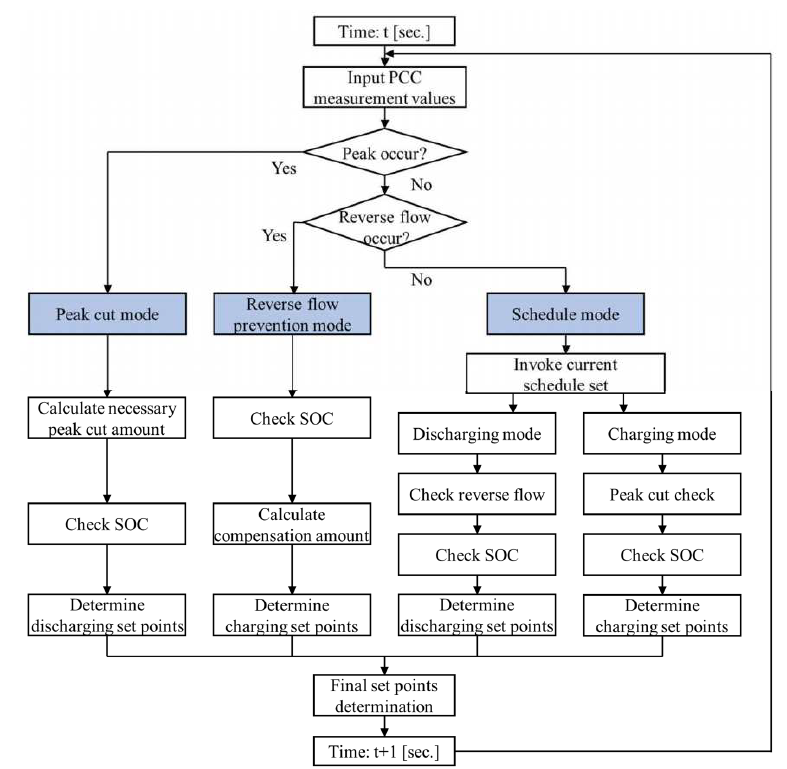
Figure 4 - Flowchart of real-time control algorithm
4. HILS verification
4.1. Energy Management System
The energy management system consists of one server and one software. The server is equipped with a database that collects and stores measurements from the grid, PV power generation system, V2G & other EV chargers, ESS and measuring instruments. The software with energy management strategies is MS .NET based and has an optimal scheduler, real time control module and graphical user interfaces. The optimal scheduler was implemented in MATLAB and loaded into the software in the form of a dll. The real-time control algorithms were implemented in the script module using the C# language.
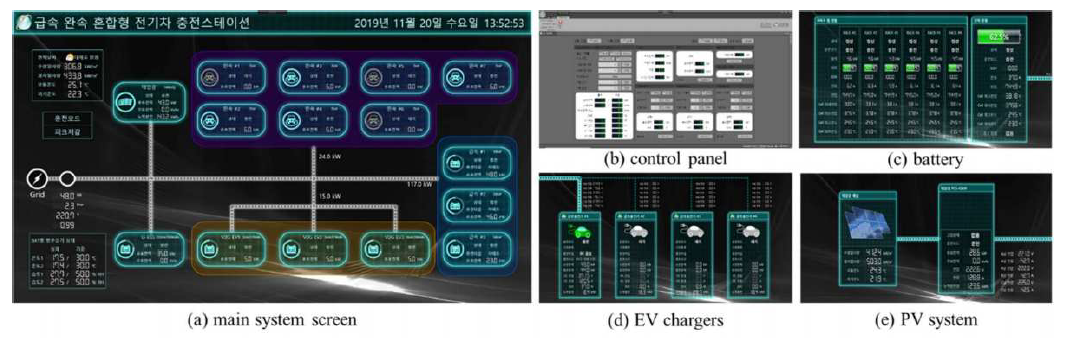
Figure 5 - Energy management system software
4.2. HILS System
Before the demonstration test, the HILS test was performed to check the operation of main functions of the EMS. In order to apply situations to the EMS as close to reality as possible, realtime simulation environment using RTDS was built. The components are modelled using RSCAD very similar to the demo site specification. The ESS, all EVs, PV system and load are designed with PQ sources and SOC is implemented as a power accumulation formula considering efficiency. To create non-artificial input variables, data from the real customer, PV system and EV station was transmitted to RTDS in real time.
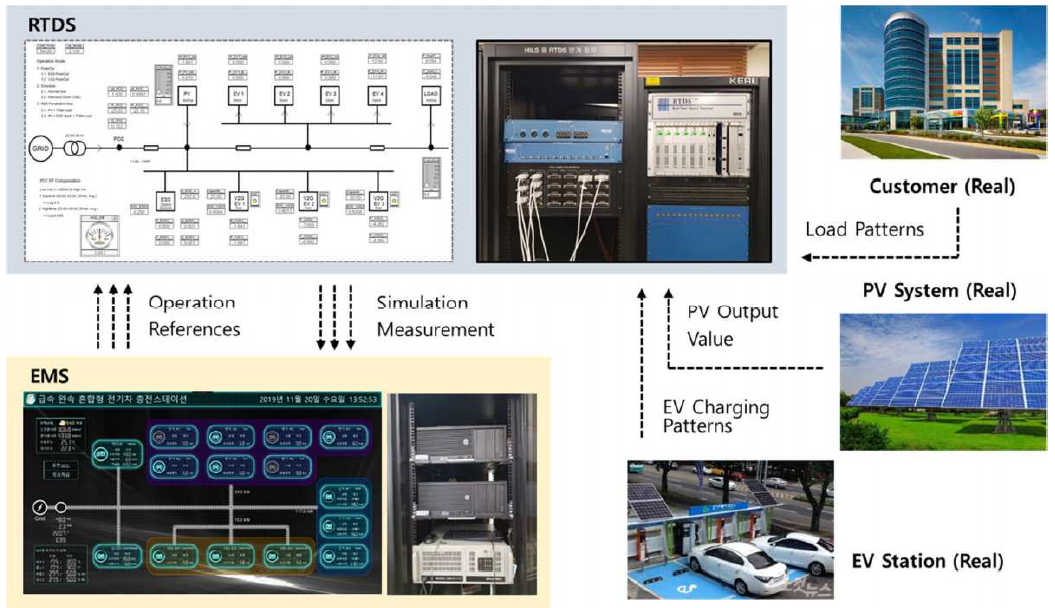
Figure 6 - HILS system for EMS function tests
4.3. Function Test Results
The HILS test confirmed and upgraded the performance of peak-cut and reverse flow prevention mode, which are main functions of the EMS. In figure 7, parts of daily operation results are shown to focus on function tests. The first and second graphs from above show the active power output and SOC (every 15 minutes) of distributed energy resources (DER) in the V2G EV-MG and the third graph shows the operating mode of the EMS over time (every 1 seconds). In the first graph from above, the light blue line indicates the active power of the PCC (receiving power from the grid), the yellow line indicates the PV power output, the light green line indicates the electric load, and the green line indicates the charging power of EVs. The blue, orange, yellow, purple bars indicate the charging/discharging power of the ESS and V2G EVs. The negative value indicates charge and positive value indicates discharge. In the third graph, 1.1 and 1.2 indicate that the EMS is operating in the peak-cut mode, 2.1 is in the schedule mode, 3.1 and 3.2 are in the reverse flow prevention mode at the time.
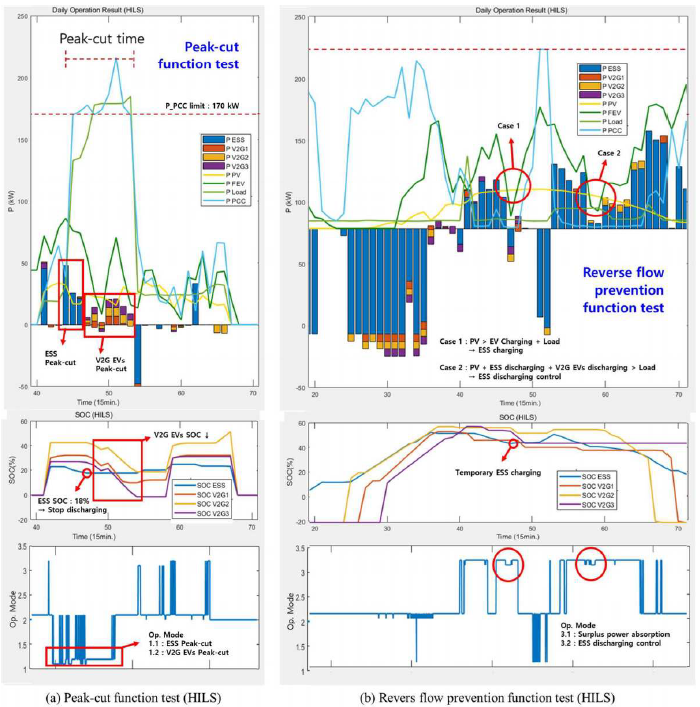
Figure 7 - EMS function test results (HILS)
In figure 7 (a), From time 45 to 53, the active power of PCC (P_PCC) violates the peak limit (170kW). To lower the receiving power below the limit, the EMS changes the operation mode to 1.1 and the ESS starts discharging. Because the ESS SOC was already low, the ESS stops discharging when SOC is 18% (lower SOC limit). After that, the operation mode changes to 1.2. V2G EVs participate in the peak-cut and discharge to each lower SOC limit. Due to the low SOC of the ESS and the small capacity of V2G EVs, peak reduction was not successful in this case. However, it was confirmed that the sequential peak-cut function from the ESS to V2G EVs works well. In figure 7 (b), the PV power output is greater than sum of charging power and load consumption. If there is no control, the surplus power flows into the grid. To be precise, there are two cases; One is when the PV power output is greater than the total power consumption of the V2G EV-MG (Case 1) and the other is when the sum of discharge power of the ESS, V2G EVs and PV output is greater than the total power consumption of the V2G EV-MG (Case 2). In case 1, the EMS changes the operation mode to 3.1, accurately calculates the power to be charged and delivers the set point to the ESS every second. The ESS charges the surplus power accurately and keeps the active power of PCC at zero. In case 2, the operation mode changes to 3.2, the EMS controls the discharge power of ESS and keeps the active power of PCC at zero. The active power of PCC is not negative during all simulation time, and it can be seen that the reverse flow prevention function works well.
5. Demonstration
5.1. Demonstration Site
Demonstration tests began in November 2019 at Sports complex of Willings Co., Ltd. in Yongin, Gyeonggi-do, South Korea. In the parking lot, 3 fast, 7 standard and 3 V2G EV chargers were installed. PV panels were installed next to the tennis court and the ESS was built in the container. Due to the absence of merchandise, V2G EVs were replaced by emulators that have lithium-ion batteries and bi-directional on-board charger (OBC). The EMS was installed in the control room and communicated with devices. Detailed configuration and specification of the demonstration site are shown in figure 8, 9.
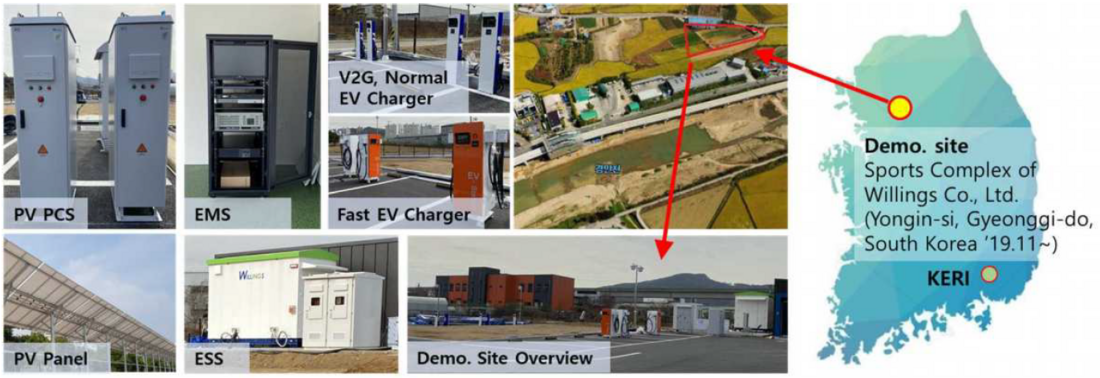
Figure 8 - Location and installation pictures of demonstration site
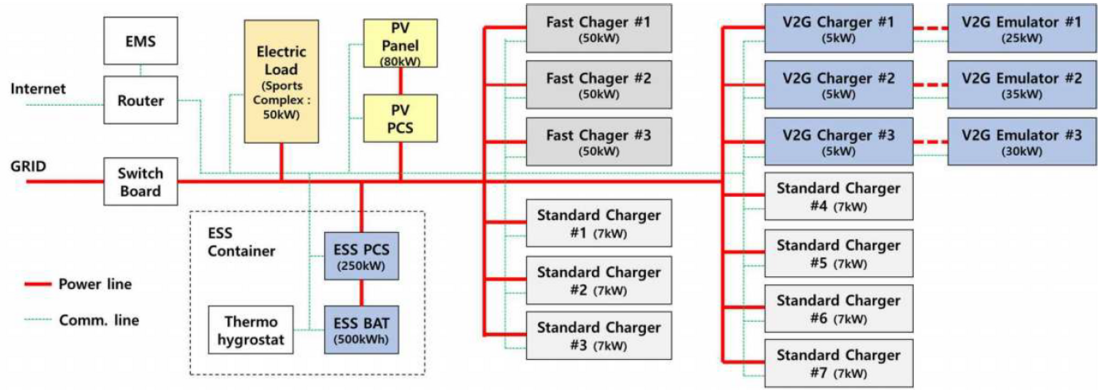
Figure 9 - Configuration and specification of demonstration site
5.2. Actual Operation Result
An actual daily operation result is shown in figure 10. This screenshot is captured from the daily operation result module of the EMS. In common with HILS test result graphs, the first and second graphs from above show the active power output and SOC of DERs and the third graph shows the operating mode of the EMS. Except for the colors of the V2G EVs, the line and bar colors of the other components are the same as HILS test result graphs. The charging power of standard and fast chargers is expressed as summation (green line). Here, the orange, pink, purple bars indicate the charging/discharging power of V2G EVs. In the first graph, the background color represents the unit price of the electricity charge. Green is low, yellow is medium, and red is high-price. To reduce the energy cost, the EMS charges the battery at the early morning hours. From 6 to 8 o'clock, all V2G EVs connect and start charging. The ESS and V2G EVs discharge it to charge standard/fast EVs and electric loads at a time when the unit price is high (10~12, 13~17 o'clock). This is the behavior by optimal scheduling (Op. mode 2.1). If necessary, the ESS absorbs the surplus power or controls the discharging power to prevent reverse flow at this time (Op. mode 3.1 or 3.2). It also controls the discharging power when the receiving power of PCC exceeds the peak limit (Op. mode 1.1). From 18 to 21 o'clock, all V2G EVs disconnect. In a typical microgrid or consumer, the ESS is the first option for load management. And, the V2G EV can also be used for load management as a supplementary measure. Accurate forecasting techniques and optimal scheduling and real-time algorithms that reflect the uncertainty of EVs are technical requirements for V2G EV-MGs.
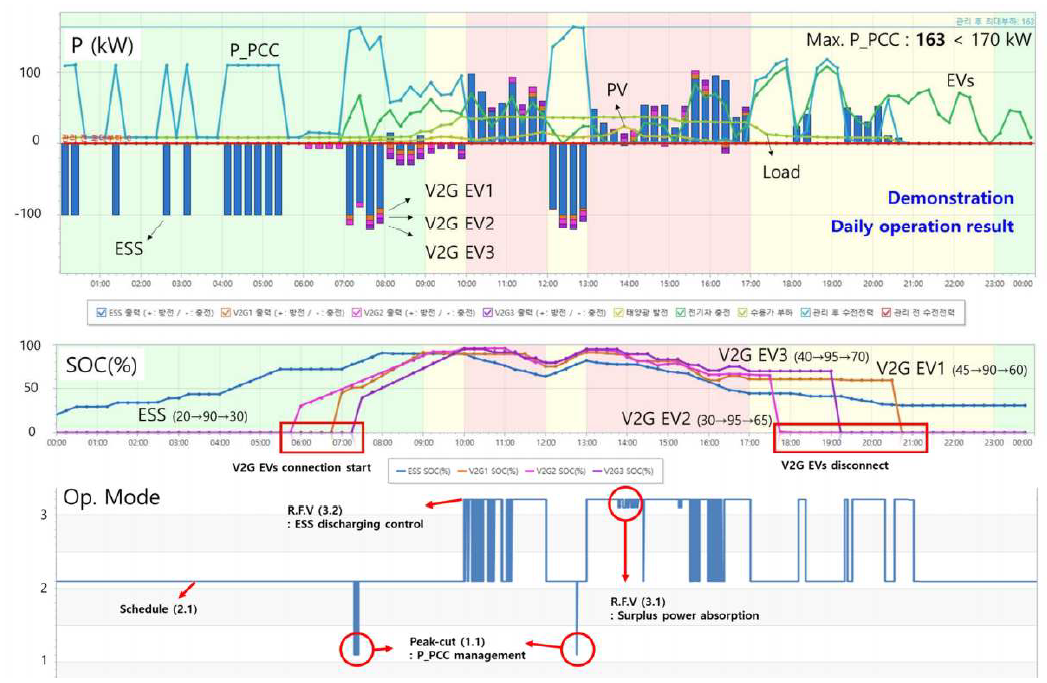
Figure 10 - Actual daily operation result
Daily energy charge saving is calculated using KEPCO's electric rates for EV charging services (lowvolt., opt.1, summer) and is shown in Table 1. Without the ESS, V2G EVs, and PV system, the daily energy charge of the V2G EV-MG is a total of 138,360 won (1 US dollar ≅ 1,150 won). The PV system reduced the daily energy charge by 12,894 won on this day. And the ESS reduced the daily energy charge by 23,591 won. However, since SOC of the ESS has risen from 20% to 30% during the day, the total cost of 27,051 won has been reduced considering the charging cost of 3,460 won. In this way, the total savings of V2G EVs can be seen as savings of 790 won for V2G EV 1, 991 won for V2G EV 2 and 784 won for V2G EV 3. However, considering the degradation costs of ESS and EV batteries and incentives to participate in load management, actual profits will be less. Since the capacity and available range of V2G EV batteries are smaller than those of the stationary ESS, the cost savings seem to be small. Therefore, it is effective to aggregate the number of V2G EVs and participate in the business. From an economic point of view, V2G EV applications for load management are not yet profitable. However, if the following policies, technologies and subsidies are supported, they can be fully profitable.
- Increasing capacity of EV batteries and decreasing manufacturing costs
- Subsidies for active dissemination of V2G EVs and sufficient bi-directional charging infrastructure
- Increasing the deviation between high unit price and low unit price of TOU
- Increasing demand charge saving incentives due to peak-cut
- Technologies to aggregate numerous V2G EVs
- Studies on battery degradation cost function and calculating appropriate Incentives
- Changes in negative perception of self-owned battery usage
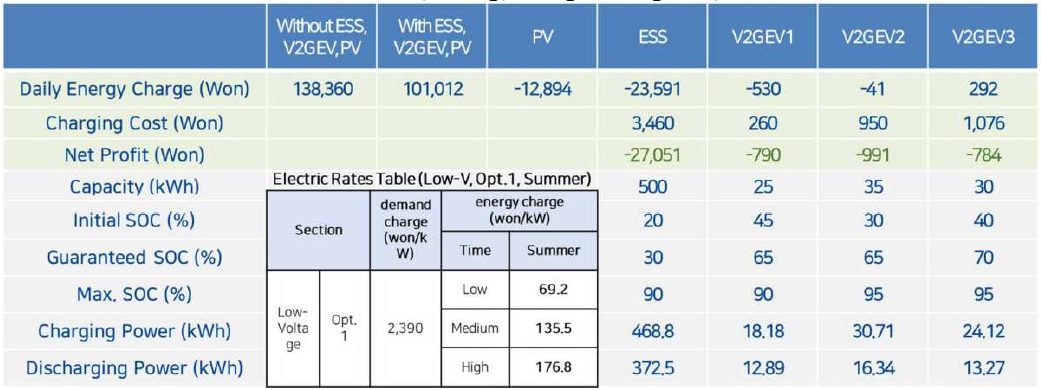
Table 1 - Daily energy charge saving analysis
6. Conclusion
Energy management strategies for the V2G EV-MG that provide EV charging services and simultaneously performs load management are proposed. V2G EV applications are forward-looking business models that contribute to solving environmental problems and provide flexibility in power system operation. To implement the ESS & V2G EVs based load management, optimal scheduling techniques and real-time algorithms are described. The HILS and demonstration verification tests are performed to show reliability and effectiveness of proposed operation strategies. Since V2G EV applications have many possibilities, the support measures for business must be needed.
References
- Y. Tu, C. Li, L. Cheng, and L. Le, “Research on vehicle-to-grid technology,” Proc. - Int. Conf. Comput. Distrib. Control Intell. Environ. Monit. CDCIEM 2011, pp. 1013–1016, 2011.
- Nissan International, “Nissan, Enel and Nuvve Operate World's First Fully Commercial VehicletoGrid Hub in Denmark, ” 29 August 2016. [Online].
- Everoze and EV Consult, “V2G Global Roadtrip: Around the world in 50 projects. Lessons learned from fifty international vehicle-to-grid projects,” 2018.
- F. Fazelpour, M. Vafaeipour, et al, “Intelligent optimization to integrate a plug-in hybrid electric vehicle smart parking lot with renewable energy resources and enhance grid characteristics,” Energy Convers. Manag., vol. 77, pp. 250–261, 2014.
- G. Byeon, T. Yoon, et al, “Energy management strategy of the dc distribution system in buildings using the EV service model,” IEEE Trans. Power. Electron., vol. 28, no. 4, p. 1, Apr. 2013
- B. Aluisio, A. Conserva, M. Dicorato et al, “Optimal operation planning of V2G-equipped microgrid in the presence of EV aggregator,” Electr Power Syst Res., 152:295–305, 2017