System strength, inertia and network loss factors - implications for power networks and renewable generation
Authors
Dr. S. HINCHLIFFE - Mott MacDonald, Australia
Dr. J. EGGLESTON - ADigSILENT PACIFIC, Australia

Summary
The retirement at end of economic life fossil fuel synchronous generation in Australia and its replacement by variable renewable energy (VRE) non-synchronous generation is leading to a reduction in system strength (the sensitivity of the voltage on the network to network disturbances).
The physical operating characteristics of synchronous generation inherently contribute to system inertia and fault level contribution to maintain network stability following network disturbances. Inverter or induction generator based non-synchronous generation does not provide these benefits and, in fact can lead to a reduction in system strength due to their mutual interaction. Therefore, in the transition from fossil fuel to renewable generation, inherent mechanisms to maintain grid stability are being removed.
At the same time, generation replacing centralised fossil fuel generation is being developed remote from load centres. This inevitably increases system losses and hence triggers market pricing mechanisms that reward generators that are close to loads and penalise those that are built remote from loads. Finally, the transition to renewable generation, as a result of its intermittent nature, has increased the need for Frequency Control Auxiliary Services (FCAS) to maintain system frequency within prescribed limits. All of these factors are placing a cost impost on VRE generation.
These factors have significantly increased return on investment volatility, and risk for VRE projects. This has arisen for a number of reasons, such as significant falls in Marginal Loss Factors, and increased FCAS charges. The Australian Energy Market Commission, Australian Energy Market Operator, and transmission network system operators have identified system strength as a major challenge to the ongoing development and integration of renewable energy projects.
System strength is a local phenomenon on the network, with the propagation of system strength limited by the natural impedance of the network. Perceived wisdom is that fault level contribution (to preserve or restore system strength) must be supplied locally within an identified weak network. However, this may not be the most efficient way to maintain system strength when considering the distances to the sources of system strength and the economies of scale of their provision.
In the National Electricity Market (NEM), ‘do no harm’ provisions were introduced in December 2017 that place an obligation on generation proponents to ensure that their project does not result in network strength falling below a level that causes system security issues. This may result in the need to install additional capital equipment to meet this obligation, reducing the commercial viability of some projects.
The main conclusion of analysis is that a centralised (centrally planned) approach to system strength provision using a few larger synchronous condensers appears to work better for low impedance networks with high levels of redundancy. Whereas a larger number of smaller synchronous condensers appears to work better in networks with high impedance and low interconnectivity under N-1 contingencies.
For developers, the best mitigation is to undertake or commission network loss factor projection studies and network system strength and constraint studies early in the project evaluation phase. These factors can potentially be riskier in terms of economic performance of a project than the renewable energy resource (solar or wind) itself.
Keywords
System Strength - System Loss Factors - Renewable Generation - Network losses - Marginal Loss Factors - Variable Renewable Energy - VRE1. System strength
1.1. What is system strength
The primary purpose of the transmission is to transport electricity from generators to bulk supply points (transmission to distribution system interfaces) and or transmission connected loads. To do this in a secure manner, ensuring that generators are able to stay connected and that loads are properly supplied, the transmission networks must operate within certain technical parameters. Meeting these conditions is a critical component of a secure power system – one that can continue operating despite the occurrence of network disturbances such as:
- Network conductor phase to phase and phase to earth faults
- Sudden disconnection of, or rapid reduction in, large loads or generating systems
- Switching of large reactive devices or breaker tripping.
System Strength is a measure of the sensitivity of the voltage on a network to disturbances. It relates to the network’s ability to keep voltage within limits during and immediately following a disturbance. Synchronous generators contribute to system strength. Inverter based non-synchronous generators can interact with other electrically proximate inverters in such a way as to reduce the security and stability of the system. Network voltage fluctuations may affect the stability and dynamics of generating systems’ control systems, and the ability of the power system to both remain stable and to return to system normal conditions, following a disturbance.
The voltage on a network with high system strength has low sensitivity to disturbances, with the fluctuation in voltage being small and held within normal operating voltage limits. Conversely, voltage on a network with low system strength is more sensitive to network disturbances. This may result in voltage fluctuations outside voltage/time duration limits. This can cause generators and or loads to trip, exacerbating the initial network disturbance. Without a system having a minimum level of system strength, electricity cannot be delivered securely to consumers, resulting in a higher risk of supply interruptions and or generator disconnections. Network system strength, in areas of the National Electricity Market (NEM)[1], has declined due to the retirement of fossil fuelled synchronous generation and the transition to inverter-based VRE generation. An overview of the system security needs and roles of market participants is provided in Figure 1:
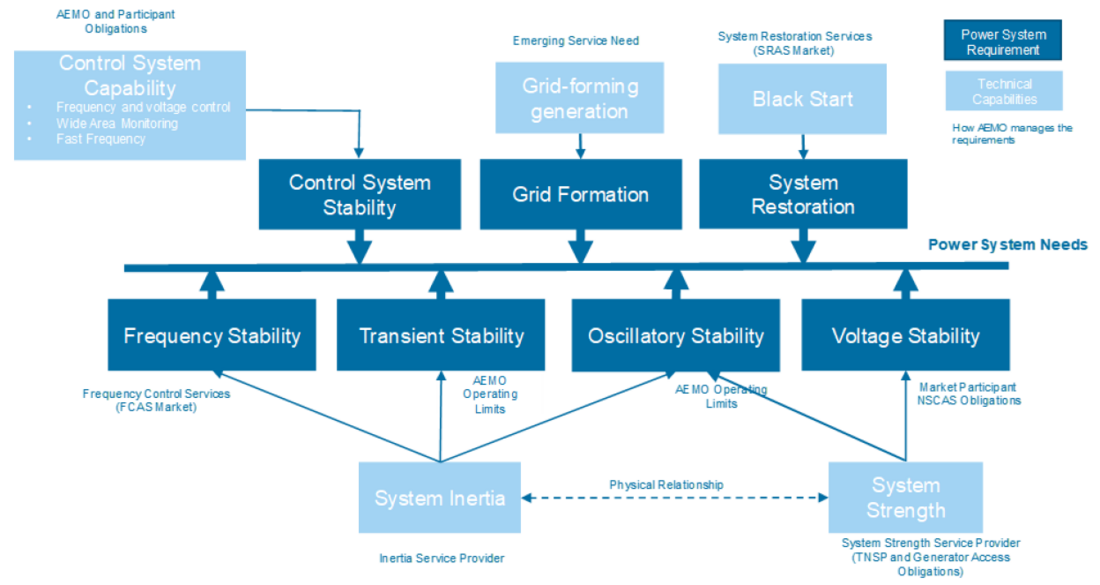
Figure 1 - Overview of power system requirements in the Australian National Energy Market
1.2. Impact on VRE generation proponents
The National Electricity Rules (NER) that govern the NEM defined the system strength requirements with which generation proponents must comply. The Australian Energy Market Operator (AEMO) has observed an increasing number of VRE generation proponents making commercial commitments before confirming network connection requirements, which can result in poor investment decisions [1]. Not only can a failure to appreciate system strength challenges result in project delays, it can also result in significant unanticipated expenditure. It is critical for VRE generation proponents to understand the obligations imposed on them to mitigate their system strength impacts, the ways in which these obligations can be fulfilled, and the impact this has on investment and project planning decisions.
In 2017 the Australian Energy Market Commission (AEMC), the rule maker for the NER, made a rule placing obligations on market participants to maintaining system strength. This was in response to declining levels of synchronous generation in the energy mix [2], contributing to a reduction in system strength. The rule has two limbs setting out obligations of Transmission Network Service Providers (TNSPs), and generator proponents seeking a network connection:
- The “minimum fault level” limb places an obligation on TNSPs to maintain system strength above minimum system strength levels set by AEMO (in terms of fault level) where the reduction in system strength is as a result of broad changes in the electricity system, generally the retirement of synchronous generation.
- The “do no harm” limb places an obligation on a generator proponent seeking to connect to the transmission network to, as part of its connection application, provide information to the TNSP to enable that TNSP to undertake a system strength assessment (along with other system security studies). Where the study demonstrates that the proposed generator connection will cause a reduction in system strength that risks system security, the generation proponent is required to propose actions to remediate the system strength. This may be either through a system strength scheme, e.g. including a suitable synchronous condenser in the project, or paying for agreed network upgrades by the TNSP.
The do no harm obligation was included so that AEMO and the TNSP could continue to operate the power system in a secure manner following the connection of a new generator to the network. This puts an incentive on connecting generators to seek to connect to the NEM in a location where there is sufficient system strength. This is intended to reduce the overall costs imposed on the system of that generator connecting.
1.3. Impact of low system strength on VRE generation proponents
A location weak in system strength is more at risk of voltage levels transitioning outside of prescribed limits following a network disturbance, which increases the likelihood of VRE and other generators being forced to disconnect from the transmission system, or else risk costly equipment damage. Not only could generators lose revenue, consumers could experience supply interruptions. The curtailment of output for five solar farms in North-Western Victoria and South-West New South Wales from potential voltage oscillations due to low system strength demonstrates this point [5]. This is shown in Figure 2.
Victoria has a renewable energy target of 40% by 2025. The introduction of more VRE generation is leading to network voltage stability issues in certain areas of the transmission system due to the relative low levels of system strength. In 2018, 480 MW of VRE generation was connected to the north-western Victoria transmission system. This has substantially lowered the relative system strength in the region impacting voltage stability. AEMO studies show that voltage control issues could arise under certain scenarios. As a result, AEMO has constrained the output of five solar farms by approximately 50%. To uncover the root cause of the problem AEMO is undertaking a detailed assessment of the performance of this part of the power system. This is resulting in delays in connection of new solar farms until these issues have been resolved.
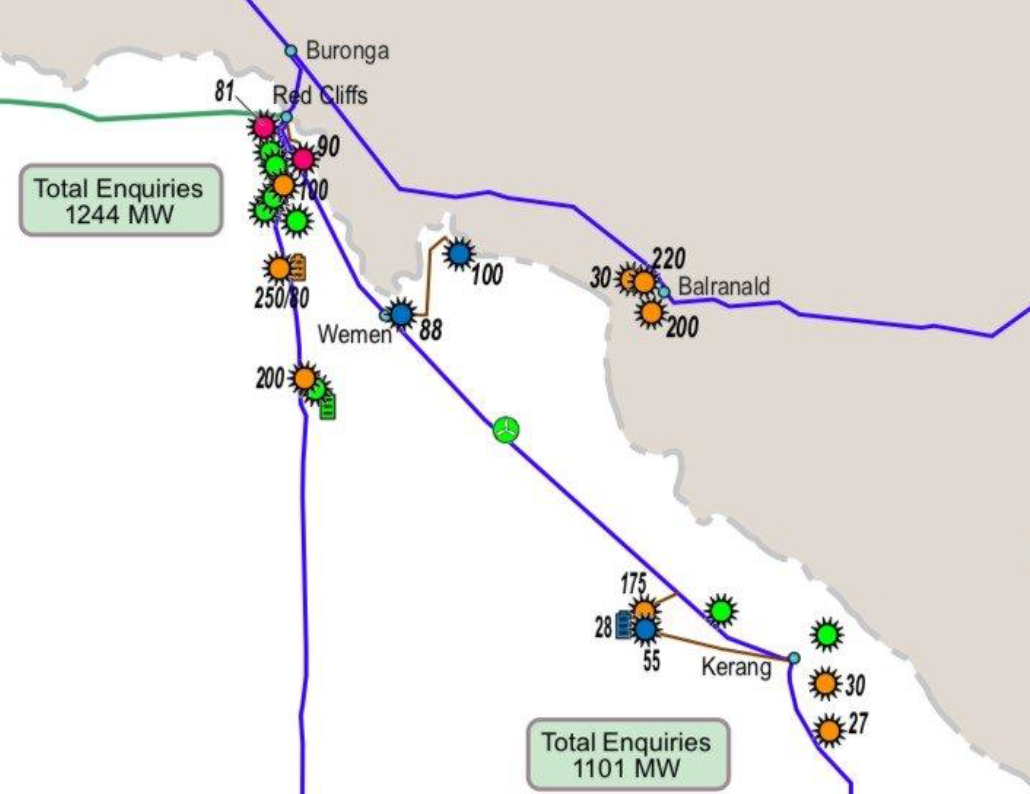
Figure 2 - Affected areas in the North West loop of Victoria
[Source: Renew economy, ‘Victoria wind and solar farms warned of curtailment’, retrieved 10 December 2019, from https://reneweconomy.com.au/aemo-warns-of-added-costs-and-delays-to-new-solar-projects-in-victoria-nsw-33530/]
VRE generation in the NEM uses grid-following inverters that require a relatively clean and stable voltage waveform with voltages within set limits to operate stably. I.e. they take their voltage and frequency reference from the network. Disturbances to the voltage waveform can result in an unstable response from these inverters. For a given level of system strength, the greater the number of grid-following inverters in an area, the greater the potential for these inverters to work in counterpoise rather than unison to stabilise the voltage. This can lead to a positive feedback effect in which one inverter affects the network voltage in a manner which subsequently impacts the behaviour of other inverters. This results in the sensitivity of the network voltage to a disturbance to be higher than would be the case absent these inverter-based generators.
This undesired interaction between inverters can result in some generators tripping due to their protection systems activating, thereby increasing network disturbance. Thus, the system strength is reduced by each VRE inverter that connects within an area. In the extreme, this can lead to a cascade event of generators disconnecting and, ultimately, a power network black system. Figure 3 shows an un-damped network voltage modulation on a collective of 300 MW of wind farms following a network event. The network event and interaction of VRE inverters significantly reduced the available system strength in the region. It took some 13 s before the voltage returned to a stable condition. If the voltage had not returned to a stable level, and continued to increase, then wind farms would have begun to trip in accordance with their protection settings [6].
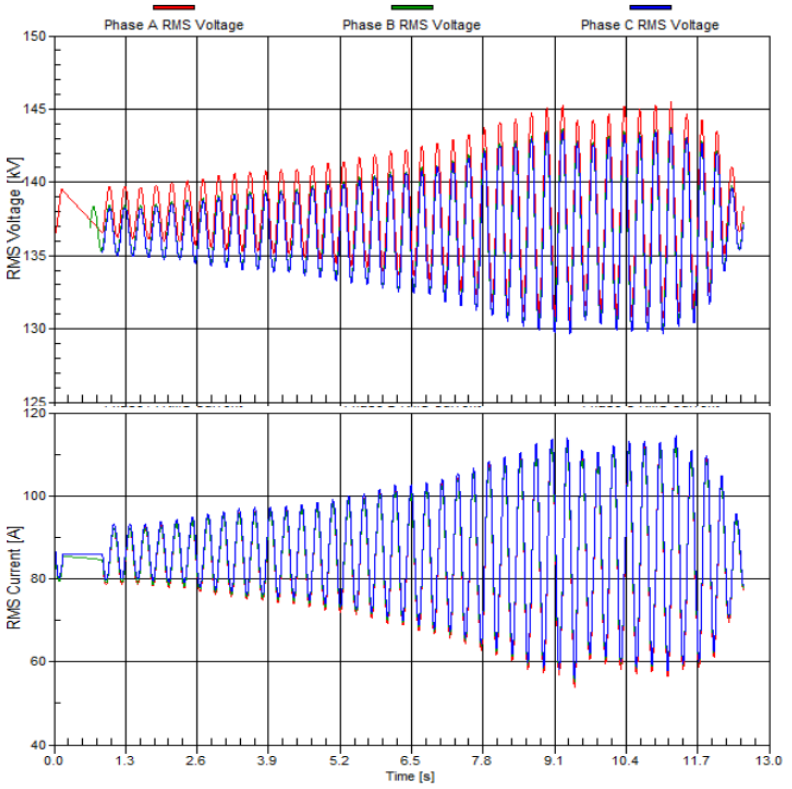
Figure 3 - Wind power plant controls cause instability under low system strength
[Source: NERC, ‘Reliability Guideline’, BPS-Connected Inverter-Based Resource Performance, retrieved 9 December 2019, from https://www.nerc.com/comm/OC_Reliability_Guidelines_DL/Inverter-Based_Resource_Performance_Guideline.pdf]
1.4. Modelling of centralised versus de-centralised approach to system strength provision
GHD has undertaken network modelling to compare a centralised (centrally planned by TNSP or AEMO) versus a de-centralised, non-planned, approach where generator proponents install synchronous condensers to meet their individual system strength obligations. This work has been undertaken on behalf of Powerlink (the Queensland TNSP) under an Australian Renewable Energy Agency (ARENA) funded study of approaches to maintaining system strength to identify the most efficient increase in system strength per dollar spent. Other members of the ARENA funded study team are Pacific Hydro and Sun Metals both of whom have large solar farm installations planned or installed in Queensland for which system strengthening is required. Network modelling was performed under for the following network topologies:
- Low impedance, good contingency (worst case N-1) 275 kV multi circuit network
- Low impedance, poor contingency (worst case N-1) 275 kV multi circuit network
- High impedance, good contingency (worst case N-1) 132 kV circuits (double single circuit)
- High impedance, poor contingency (worst case N-1) 132 kV circuits (double and single circuit).
The modelling considered installation of centralised (centrally planned by TNSP) synchronous condensers: 1 x 400 MVA, 2 x 200 MVA, 4 x 100 MVA at key points of each network topology versus decentralised, generator proponent installed, 8 x 50 MVA synchronous condensers in renewable energy zones. The study considered the effect of declining system strength with distances and the economies of scale of synchronous condenser installations. Noting:
- System strength provision decays rapidly with electrical distance according to network impedance and exacerbated by a low level of network redundancy;
- Economy of scale arise with large single synchronous condensers versus multiple smaller units to achieve the same effect arising from:
- Lower cost per MVA with size of synchronous condenser
- Lower overall connection costs
- Lower maintenance costs – lower critical spares holding, commonality of parts, fewer trained technicians, ease of control and integration with network operation).
Results of the study show that:
- A centrally planned approach installing single large synchronous condensers located at key parts of the network provides the most efficient (technical and commercial) solution in low impedance networks with good network redundancy under N-1 contingencies;
- A centrally planned approach with multiple smaller units located at key parts of the network provides the most efficient solution for low impedance networks with low N-1 redundancy;
- A decentralised approach of multiple smaller units randomly spread throughout a high impedance transmission network (132 kV) with low N-1 redundancy is most efficient.
Typically, in the NEM, low impedance networks with high interconnectivity have high system strength and limited requirement system strength providing synchronous condensers. However, this may change as the transition from fossil fuelled, synchronous generation to VRE non-synchronous generation progresses. The network types most likely to exhibit system strength issues are high impedance networks with low network redundancy under N-1 contingencies. It is these network types where new VRE generation proponents are most likely to be required to install synchronous condensers to maintain system strength above minimum levels set by AEMO. The following diagrams show the effect of an N-1 contingence event on system strength provision using a single synchronous condenser installed at a key location on the network.
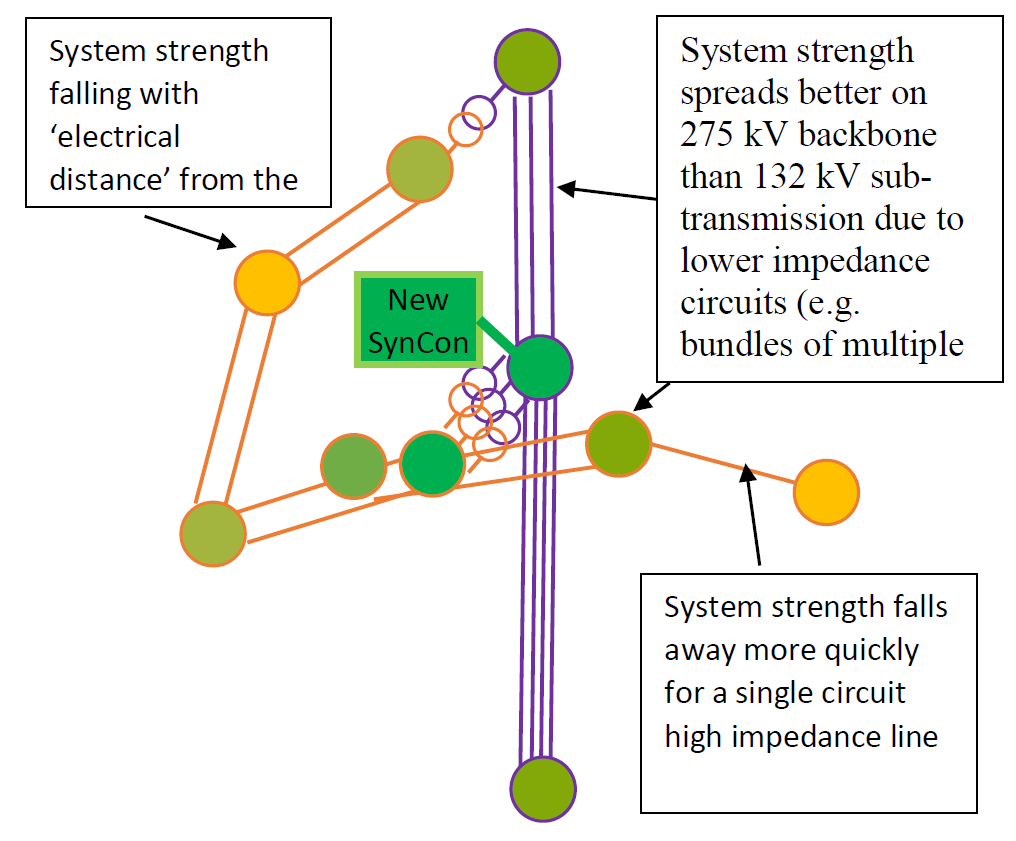
Figure 4 - System strength improvement provided by a single synchronous condenser before network contingencies
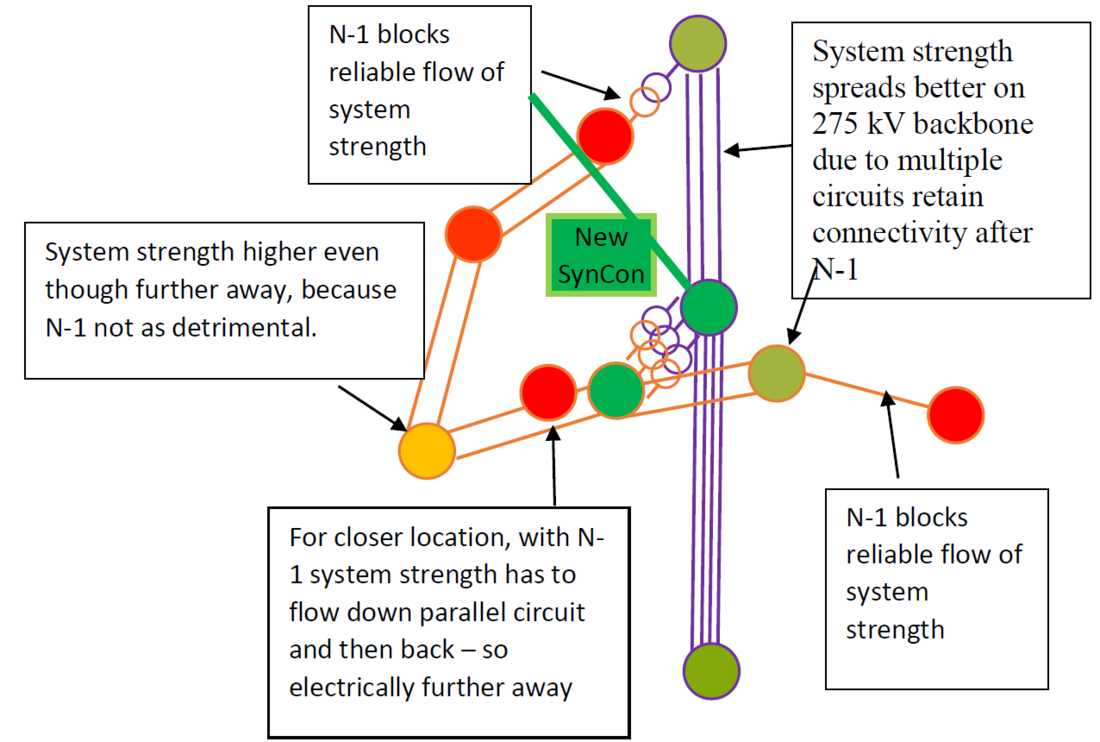
Figure 5 - System strength improvement provided by a single synchronous condenser following network contingency (N-1)
[Figures courtesy of Powerlink Queensland]
A further conclusion is that the cost of meeting system strength provision for renewable developers is lower the closer a VRE generation proponent is to a low impedance, and good N-1 contingency transmission system. This is because any system strength provision may be met by a lower economic cost, centrally planned single larger synchronous condenser, installed to meet the needs of multiple connecting generators [7].
2. Marginal loss factors
2.1. What are Marginal Loss Factors?
The NEM is a zonal (regional) gross security constrained dispatch market with 5 interconnected zones. The prices received by generators, and paid by loads, in a given trading interval (30-minutes) are the product of the price calculated at the regional reference node (RRN) (located at the largest load centres in each state) in which the generator is located and the static marginal loss factor (MLF) for that connection point. The prices at the regional reference nodes are calculated from the offers submitted by the generators and represent the cost of meeting an additional MW of load at each of the regional reference nodes. Thus, when comparing an increment of output from a generating system it is necessary to also consider its marginal impact on the losses in the transmission network, hence the use of MLFs. As well as promoting efficient dispatch and pricing, the use of MLFs also provides longer-term locational investment signals that incentivise generators to locate near loads where there is a strong connection between the generation and the load, and vice versa. Similarly, the power flows on the interconnectors between regions also include the impact loss equations when comparing the cost of an increment of generation within a region with the cost of importing that power from another region.
Rather than recalculating loss factors for each 5-minute dispatch interval, a single static MLF value is calculated representing an estimate of incremental impact on losses arising from a given generator supplying the RRN for the financial year (July to June). Static MLFs are calculated annually by AEMO using the generation and load patterns anticipated for the next financial year, volume weighted by the generation or load pattern of the zone in question. Use of annual static MLFs, rather than dynamic real-time loss factors, aims to increase the liquidity of the markets for financial derivative contracts against the NEM Spot Price and facilitate efficient investment in new generation. However, annual static MLFs can compromise the efficiency of dispatch and locational pricing.
The revenue earned by a generator for a given trading interval is the product of its output in that interval, the regional reference price (RRP) and the static MLF for that generator. Thus, the MLF, and the future MLF values, are an important part of a generator’s business case (RRNs in the NEM are shown in Figure 8 further below). Figure 6 displays the losses associated with the transport of electricity from the supply to the RRN with a total line resistance resulting in a total loss of 3 MW.
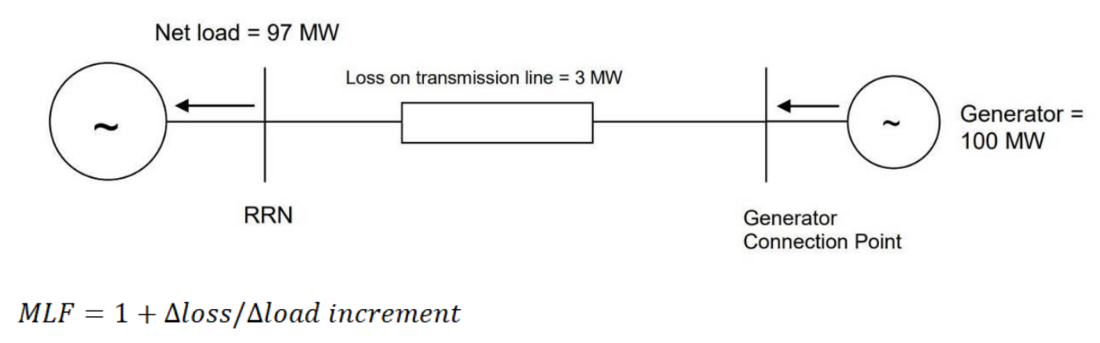
Figure 6 - Generator outputting 100 MW into a radial network, to supply a 97 MW load
In the example in Figure 6 a 1 MW increment of load at the generator would reduce the losses on the line to 2.94 MW, or a change of 0.06 MW. This gives a MLF value of 0.94. [3] If a second 100 MW generator connects at the same, or neighbouring, connection point then the flow on the transmission line would increase to 200 MW, with the losses increasing to 12 MW. This would give a MLF value of 0.88, which would reduce the income for both generators (from 0.92 multiplied by the RRP price to 0.88 multiplied by the RRP).
2.2. MLF Volatility
Much of the new generation in the last few years has connected in the lower voltage network and distant from the major load centres, compared to the existing generation. This change to the generation mix has resulted in a significant increase in the losses in the transmission network, with an associated decrease in the MLFs (and hence the revenue received) for this new generation. For example, the MLFs for south-western New South Wales and north-western Victoria fell significantly for 2019/20 due to the dramatic increase in solar and wind generation in this area and absence any upgrade to the network to reduce losses and increase capacity. In one case, the MLFs of a new solar generator dropped by approximately 25%, with a corresponding decrease in the generator’s revenue. This has become a serious concern for many renewable generator developers and investors. As an example, the most significant changes in Queensland driving reduction in MLF between FY18-19 and FY19-20 were:
- Materially more committed generation FY19-20 versus FY18019;
- QLD committed generation up 1.4 GW nameplate, 420 MW on a capacity factor basis;
- Reduction in FY19-20 consumption forecast from -1% growth to -2.8% growth.
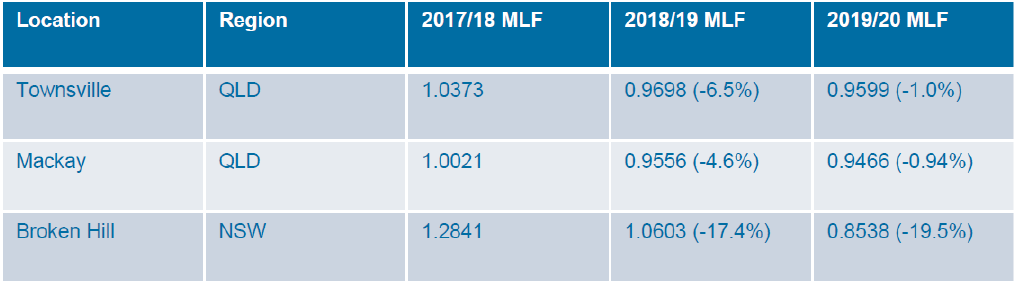
Figure 7 - Examples of areas in the NEM with significant MLF reduction and changes FY18 to FY19
[Source: Information drawn from AEMO Annual MLF reports [8]]
It is very difficult for a VRE generation project to withstand the 33.5% reduction in revenue experienced by VRE generation at Broken Hill in the last three years. Adani Renewables recently submitted a Rule change request to change transmission loss factors from marginal to average as means of reducing the impact of loss factor cost impact on renewable generation remote from load centres. In its draft determination, the AEMC did not propose making this change to the loss factor specification. [9].
2.3. MLF risk mitigation
Early identification of MLF resilient areas, that is, with low likelihood of MLFs declining with increased generation is critical. This is more important, in terms of financial risk, than many other factors e.g. renewable resource, capital cost. GHD has produced a heat map of the NEM showing areas of high MLF resilience (other project risks more important), medium MLF resilience (early MLF study recommended) and low MLF resilience (avoid) Figure 8 right hand side. The central images show example AEMO projection of MLF reduction with increasing VRE generation [10].
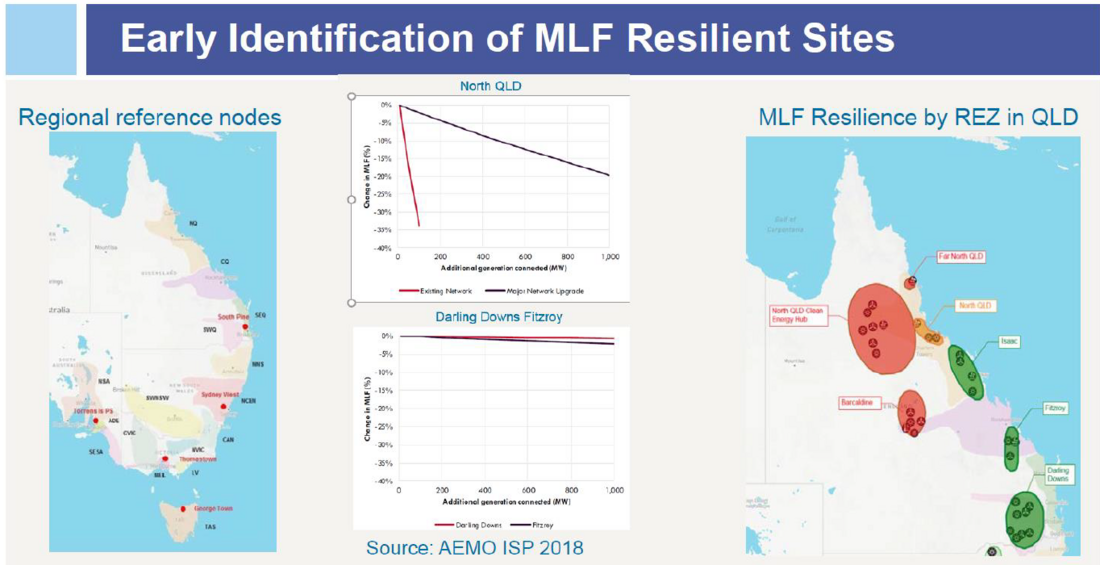
Figure 8 - Early identification of MLF resilient sites is key to reducing risk
[Source: AEMO 2018 ISP and GHD]
Once a site has been developed, measures to improve MLF are limited and expensive. GHD has assessed options to improve the MLF of a portfolio of VRE projects. The results of that study are:
- Attracting or developing new load proximate to the VRE generator is the most cost effective in terms of MLF improvement/$ spent. Particularly if a revenue stream can be captured from that load such as from sale of hydrogen from electrolysers.
- Battery installations make little impact on MLFs unless they have prohibitively expensive (at current cost) high storage capacity. Battery installations are more effective at reducing network constraints than reducing MLF.
- Alternative network connections, e.g. to a higher voltage and lower loss part of the network, may be possible in some circumstances but can be very expensive for generators that are locating in a remote part of the network.
3. Conclusions
The transition from fossil fuelled powered synchronous generation to VRE non-synchronous generation is resulting in a system strength that is deteriorating over time. This needs to be addressed to prevent loss of security of supply. The AEMC rule change with its ‘do no harm’ provision places a requirement on VRE generator proponents to install system strength supporting plant if required by the TNSP as part of the connection process. This can place additional costs on projects, for which no additional revenue accrues, when the generator is connecting in weak parts of the network.
Similarly, increased VRE generation at fringes of the grid away from load centres is resulting in a decline in MLFs, again impacting VRE project revenues. In all cases the proponents of VRE generation should undertake system strength and MLF forecast studies early on in a project’s development and to repeat these studies annually until financial close. Implementing mitigation measures post construction is costly and, for MLFs, largely ineffective.
References
- Australian Financial Review, ‘AEMO imposes tough conditions on new wind and solar in Victoria’s ‘full’ transmission system’. Available at: https://www.afr.com/politics/aemo-imposes-tough-conditions-on-new-wind-and-solar-in-victorias-full-transmission system-20181012-h16l0h
- The Demise of Coal, Energy Networks Australia, Dr M Narayan, 18 July 2019, https://www.energynetworks.com.au/news/energy-insider/the-demise-of-coal/ last accessed 24 January 2019
- AEMO Generation Information Page, 14 November, 2019, https://www.aemo.com.au/-/media/files/electricity/nem/planning_and_forecasting/generation_information/nov-2019/generationinformationpage_20191114.xlsx last accessed 24 January 2020
- AEMO, 2020 Integrated System Plan (Draft), 12 December 2019, https://www.aemo.com.au/-/media/files/electricity/nem/planning_and_forecasting/isp/2019/draft-2020-integrated-system-plan.pdf?la=en last accessed 24 January 2020
- AEMO, Planned Outages in the North Western Victoria & South West New South Wales Transmission Network, February 2019. Available at: https://www.aemo.com.au/-/media/Files/Electricity/NEM/Security_and_Reliability/Congestion-Information/2019/Planned-outages-in-the-North-Western-VIC-and-South-West-NSW-transmission-network-industry-communique.pdf
- NERC, ‘Reliability Guideline’, BPS-Connected Inverter-Based Resource Performance, retrieved 9 December 2019, from https://www.nerc.com/comm/OC_Reliability_Guidelines_DL/Inverter-Based_Resource_Performance_Guideline.pdf.
- Jia, Jundi et al. Synchronous Condenser Allocation for Improving System Short Circuit Ratio (Proceedings of 5th International Conference on Electric Power and Energy Conversion Systems, 2018)
- AEMO, Updated Regions and Marginal Loss Factors. Available at: https://www.aemo.com.au/energy-systems/electricity/national-electricity-market-nem/market-operations/loss-factors-and-regional-boundaries
- AEMC, Transmission loss factors, Draft rule determination, 14 November 2019 (Appendix B)
- AEMO 2018 Integrated System Plan, June 2018
- [1] The NEM is a zonal (regional) gross security constrained dispatch market with 5 interconnected zones in eastern and southern Australia, including Tasmania
- [2] Since 2016 some 2.8 GW of synchronous generation has been retired from the NEM [2] with a further 5.4 GW (peaking and base load) planned to retirement between 2020 and 2035. This has been replaced with some 6 GW of commercial scale wind and solar plant with a further 6.3 GW committed or commissioning and a further 43 GW maturing or publically announced as at January 2020 [3][4] and some 3.2 GW of roof top solar PV out of a total base load generation capacity of circa 23 GW [4]. AEMO has stated in its draft 2020 Integrated System Plan that over 30 GW of new VRE generation is required to replace retiring synchronous generation by 2040 [4]
- [3] An analogous calculation is undertaken for loads and typically results in MLF greater than 1.