The impact of distributed generation intensive development on ecological performance of remote power supply centers
Authors
S.A. EROSHENKO, V.O. SAMOYLENKO, A.I. KHALYASMAA
Ural Federal University named after the first President of Russia B.N. Yeltsin, Russia

Summary
The presented study is interdisciplinary and addresses the preferential subjects of Study Committee C3 “System Environmental Performance” (PS2 “Environmental impact of energy transition”) and Study Committee C6 “Active distribution systems and distributed energy resources” (PS2 “Enabling technologies and solutions for distribution systems”).
The paper presents the results of the assessment of distributed generation systems impact on the economic and environmental performance of remote microgrids and bulk power systems in general. The focus is made on cumulative technological and economic performance of remote microgrid energy infrastructure as well as cumulative environmental damage arising from manufacturing, implementation and operation of power supply systems within the lifecycle of the power and energy production assets.
Implementation of distributed energy resources, including renewable and non-conventional energy sources, is one of the priorities to reduce power supply shortages and diversify fuel balance, which makes it possible to provide remote and hard-to-reach areas with thermal and electrical energy. Often the problem of meeting the energy needs of the population in remote areas is solved by the construction of long-distance distribution feeders. However, this leads to the higher investment costs and big concerns regarding land allocation issues and power supply reliability. The construction and operation of long-distance distribution feeders can often take place in terrain with difficult access, which leads to additional increase in operating costs. From another point of view, in the majority of cases distribution feeder connection is still needed as a backup source to provide power supply in case of energy shortage in the microgrid or for the purpose of load curve peak shaving to provide more efficient operation conditions for power generation facilities.
In order to provide uninterruptable power supply for remote customers the following alternatives of the power generation infrastructure can be considered:
- distributed generation based on fossil-fuels;
- distributed generation based on local fuels;
- distributed generation based on renewable energy sources;
- hybrid systems that provide power supply depending on the availability of primary energy sources, including fossil fuels, renewable energy, and, as a rule, energy storage.
The task of life cycle assessment addresses all possible economic and environmental effects resulting from the production of generation equipment, installation and commissioning of power supply systems, the operation of power equipment and decommissioning. In the paper, the lifecycle analysis is carried out on the basis of life-cycle equivalent CO2 emissions (complied with ISO 14040 and ISO 14044) for the microgrid power generation fleet, determined as a result of levelized cost of energy (LCOE) comparison for different scenarios.
An essential factor for ensuring the adequate lifecycle assessment is the intended operation mode of power generation units and power network equipment, which are evaluated depending on the electrical load of the microgrid under consideration, averaged climatic indicators and other parameters taken into account by simulating various operation conditions for the power supply system under consideration.
Practical part of the study focuses on the problem of power supply system implementation for a remote community located in the Far North region, which characterizes the corresponding geographical and climatic conditions. At the moment, power supply of the community is carried out by 10 kV overhead distribution feeder with a total length of 56 km. The line route passes through inaccessible territories, all the way through the forest belt, which makes it difficult for maintenance and repair. In order to make the more accurate estimation of the lifecycle of existing and alternative options, the measurements of electrical load curves were carried out and electrical energy losses were estimated.
As a result of the calculations, by taking into account the behavior of microgrid electrical load, a final assessment of power supply scenarios in terms of environmental damage and economy was made.
Keywords
Renewable energy - microgrid - remote consumers - economic feasibility - environmental impact,interconnected operation mode - energy balance
1. Introduction
1.1. Different power generation technologies and the corresponding environmental effect
The analysis of the environmental aspects of the power systems is started with the description of fossil fuel power generation effects, providing the greatest ecological impact.
Fossil fuels
The main way of reducing the environmental impact of energy utilities is to reduce the amount of harmful emissions and to reduce the volume of waste productions. However, Power and Energy sector of many countries demonstrate the trend of hydrocarbon generation development associated with the implementation of gas-fired generation, including combined cycle gas turbines and small-scale gas-fired distributed generation. At the moment, it is mostly conditioned by the wide range of rated gas-fired generation capacities, high availability of gas fuel infrastructure, and the lower requirements for land allocation.
Compared to the existing bulk power generation facilities (traditional coal- or gas-fired condensing power plants), new generation equipment impose different environmental impact that must be taken into account in strategic plans of the industry. Table 1 provides generalized information on different fossil-fuel power generation technologies [1], taking into account the characteristics of worn-out power generation equipment. As it can be seen from the Table 1, newly introduced bulk power generation facilities, using advanced filtration and energy utilization technologies, outperform the worn-out power plants, but all the listed technologies have poor or satisfactory environmental performance, providing high emissions of CO2.
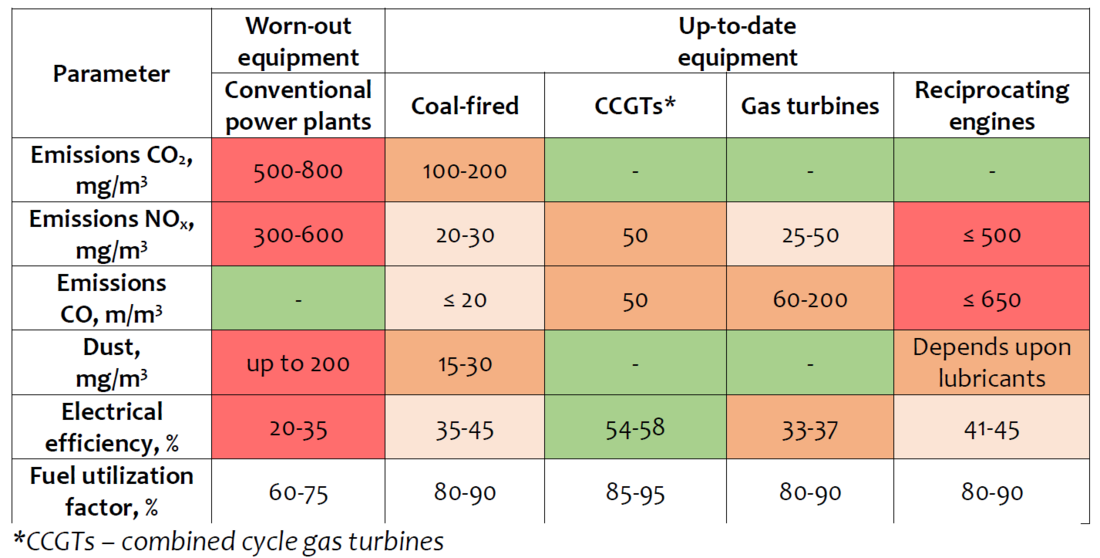
Table 1 – Generalized parameters of fossil-fuel power generation technologies
Fossil-fuel small-scale distributed generation, typically based on gas turbines or reciprocating engines, has better environmental characteristics compared to the existing worn-out traditional power generation facilities. Given the absence of electrical energy losses due to proximity to the energy consumer, small-scale distributed generation provides 5-15% of energy efficiency improvement and reduces the emissions by 1.7-2.5 times.
Nevertheless, it should be taken into account that from environmental point of view small-scale fossil-fuel distributed generation underperforms up-to-date bulk generation facilities. This concerns the efficiency factor and fuel-consumption rates (for gas turbines), emissions of CO and NOx (for gas turbines) and it is associated both with economy of scale and with structural and technological features. So, in case the share of the electric load, which could be covered by new high-capacity power plants, would be substituted by small-scale distributed generation, the global figures of noxious emissions will certainly grow. Taking into account that distributed generation facilities are typically scattered over the territories, small-scale fossil-fuel generation “naturally” reduces the concentration of non-cumulative harmful emissions. In terms of CO2 emissions and the fuel-consumption rates, small-scale generation is less efficient due to the economy of scale of bulk power plants, but, being implemented near the consumer site, it gives the opportunity to eliminate energy transmission losses.
Renewable energy sources
The environmental aspect of renewable energy development is associated with “zero CO2 emissions” produced by solar, wind, hydro or other power plants using renewable energy sources (RES). Indeed, electrical energy is generated without burning hydrocarbon fuel resulting in zero greenhouse gases emissions. However, the situation turns out to be more complicated if investigated from the point of the entire production life cycle, which takes into account preliminary stages associated with the RES-based power generation implementation and secondary effects of the energy production process. In order to produce electrical energy, manufacturing, transportation and installation processes of the power equipment as well as preparation of raw materials and upgrade of related infrastructures take place. That requires the operation of industrial enterprises, and, subsequently, the use of electrical energy, produced by fossil-fuel generation facilities.
While the operation of solar power plants is environmentally friendly, the pollution is caused by the industrial plants producing semiconductor elements. For the wind power plants, harmful effects are characterized by mechanical and aerodynamic noise, supplemented by powerful infrasonic vibrations. Biomass energy producers reduce environmental pollution by utilizing the harmful waste, however, in the course of biomass processing, many harmful by-products do arise. A comprehensive consideration of the environmental impacts at all stages shows that global transition to renewable energy does not always lead to a decrease in environmental pollution, including the emissions of CO2 and other greenhouse gases.
In order to scrutinize the environmental effect of both fossil-fuel and renewable energy sources, the given paper introduces a synthetical indicator, describing the greenhouse gas emissions related to the life-cycle energy production process [2] – the gramequivalent of CO2 per 1 kWh, [gCO2 eq / kWh]. Harmful emissions of various types of power plants within the life cycle are presented in Table 2.
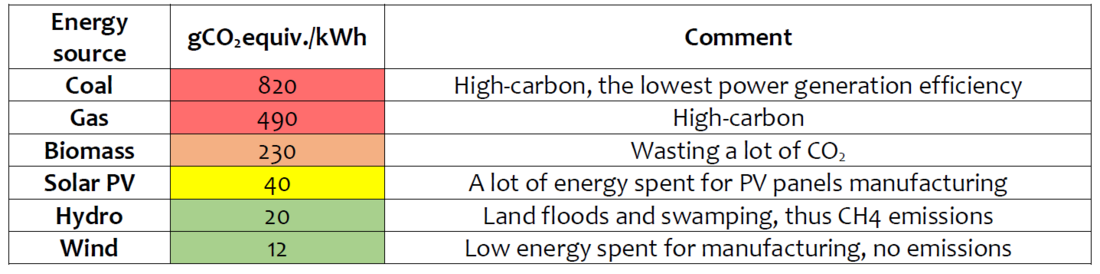
Table 2 – Gram-equivalent emissions of greenhouse gas for different types of generation
units
The power generation lifecycle analysis gives the following emission indicators [gCO2 eq / kWh]: wind generation - 12; small hydropower plants - 20; photovoltaic plants - 40; biofuel generation - 230. This, however, is significantly lower than the indicators given for fossil-fuel power generation: coal-fired - 820; gas-fired - 490. At the same time, the most “environmentally friendly” are wind and nuclear power plants, providing the lowest gram-equivalent emission factor – 12. It is obvious that the distribution of greenhouse gas emissions between the stages of electrical energy production lifecycle is dramatically different too.
Given the idea of lifecycle emissions assessment, the economic and ecological comparison of fossil-fuel and renewable energy development scenarios require further investigation. The result of the comparison depends greatly on the problem statement as well as the peculiar features of the bulk power system and the remote microgrid under consideration, providing specific external and internal scenarios of power generation commitment problem, while meeting the environmental constraints and the energy demands of the customers.
1.2. Remote customers power supply: on-grid versus off-grid operation mode
From the point of view of providing sustainable power supply, power generation fleet of remote energy districts is typically presented by a substantial share of local energy resources. For remote areas one of the promising fields is the application of waste products of wood processing industry. Sawdust, wood chips, pellets used for a gas generator, as well as other types of biofuel can be economically feasible for small-scale local power generation facilities.
With regard to renewable energy sources, an important role is given to the primary energy source characteristics, which depend on many factors, including the technological, geographical, climatic and other features of the region under consideration. Renewable energy-based power plants’ feasibility analysis is typically based on the estimated capacity utilization factor ultimately affecting the cost and environmental performance of the system.
From the point of view of the power network infrastructure, the problem of uninterrupted power supply is especially relevant for the power networks supplying remote customers. Due to the considerable length of the distribution feeders (medium voltage, 6-10 kV) and excessive electrical energy losses, the problems associated with the voltage levels do occur. In addition, due to the insufficient current-carrying capacity of the existing 110 (35) kV power networks facilities, new consumers are often restricted for power network connection, which leads to the necessity of local generation sources development [3].
In consideration of the foregoing the given study addresses the problem of remote areas power supply in accordance with the following scenarios:
- on-grid (tied) operation of the microgrid: power generation fleet is presented by renewable energy sources and/or local biofuel generation, working in parallel with the bulk power system or backing up the tie-line connection;
- off-grid operation of the microgrid: power generation fleet is presented by renewable energy sources and/or local biofuel generation, fully meeting the energy demands of the consumers.
Microgrid operation mode optimization is required to address technological constraints related to current-carrying capacity of the power network equipment, electric load curves of the electric power system and the microgrid itself, the energy market signals, providing hourly energy cost values [4]. However, the key role in justifying the operation mode of the microgrid belongs to the share of the power transmission component in the final cost of electric energy for the consumers. Given that the ratio of the external network and local generation costs can be different, the dominating source of electrical energy is associated with significant fluctuations in the environmental impact of the microgrid.
2. Problem statement formulation
The main goal of the study is to determine the types of local power generation, participating in the energy demand coverage of the remote microgrid based on the economic indicators of both the microgrid and the adjacent power system, taking into account the cumulative environmental impact.
As far as the environmental effect is calculated for the power generation lifecycle period, thus giving the opportunity to stand for ecological impact of renewable energy sources, the economic performance of the microgrid is correspondingly analyzed by utilizing the levelized cost of energy, estimated for different energy sources and time periods.
2.1. Levelized cost of energy
The study of the power equipment life cycle includes determination of the environmental impact as well as the calculations of the normalized cost of produced energy. The cost of electrical energy production determined for the entire life cycle of the electric power system, covering the period between the stages of power system design and disposal is referred to as Levelized cost of energy (LCOE):
(1)
where t=1...n is the year inside the power plant life cycle period n; lt indicates the power plant investment costs; Mt stands for power plant operational costs; Ft represents the fuel costs; Et corresponds to the mean annual energy production value; r is the discount rate.
As it can be seen from (1) LCOE is directly influenced by the installed capacity of a particular power plant, its operational efficiency and the expected installed capacity utilization factor. It is important to note that even for similar types of power generation LCOE in different countries may significantly vary. The ununiform allocation of the energy resources throughout the territory of the country, the level of technological progress, specific features of the power system (regulation, industry structure, etc.) - all these reasons lead to significant differences in the cost of electrical energy. Figure 1 summarizes the results of Lazard’s LCOE [5] calculations plotted versus LCOE assessment for United Power System of Russia [8].
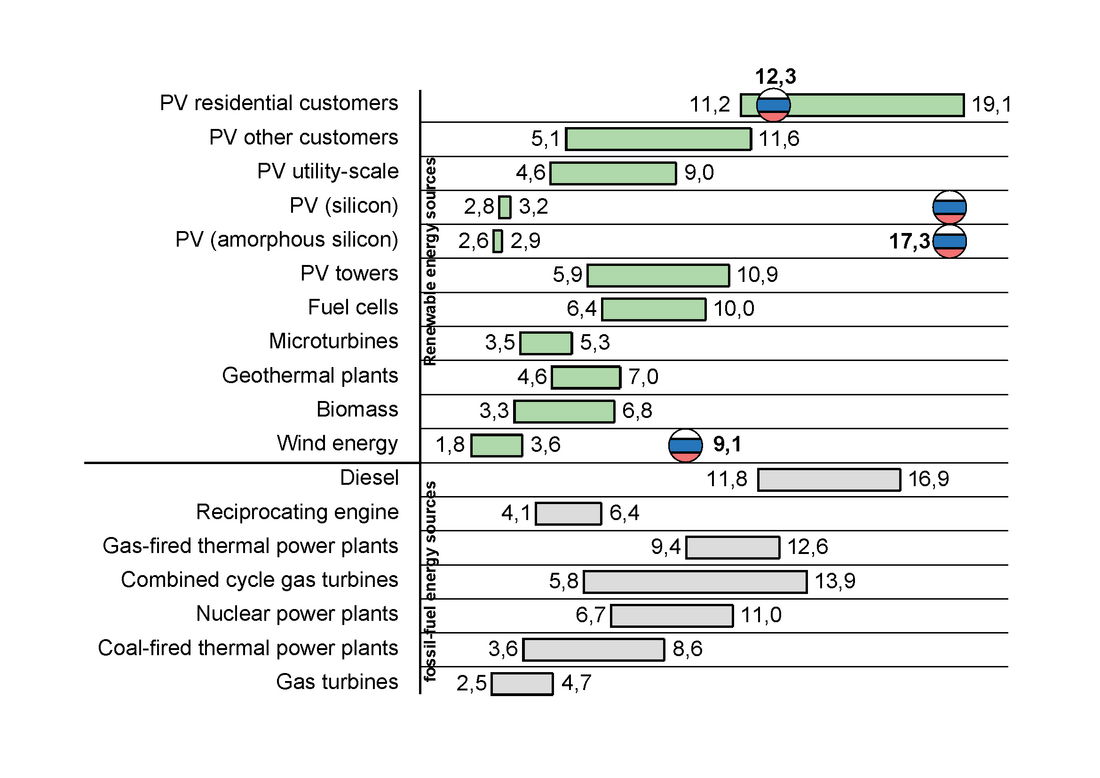
Figure 1 – Lazard’s LCOE in USA plotted versus LCOE is Russia according to NP Market Council
LCOE analysis is carried out by multiple institutions, including Fraunhofer institute for solar energy systems (ISE) [7], International Renewable Energy Agency (IRENA) [6], US Energy Information administration. For the given study the LCOE values are taken as the median ones between the LCOE from different studies (see Table 3).
| Power generation type | LCOE, EUR/kWh |
|---|---|
| Wind onshore power plants | 0,05 |
| Solar PV power plants | 0,18 |
| Small Hydro plants | 0,09 |
| Large Hydro plants | 0,08 |
| Biomass power plants | 0,07 |
| Gas-fired generation | 0,05 |
| Coal-fired generation | 0,06 |
| Nuclear power plants | 0,07 |
2.2. Power system and the microgrid
Within the framework of the presented paper, the remote energy district with an approximate winter peak load of 500 kW, powered by 10 kV single-circuit distribution feeder, was taken as a case study. The feeder is connected to 35/10 kV MV substation, integrated into the bulk power system. In order to illustrate the procedure of economic and ecological justification of microgrid operation modes, the following power system generation fleet was taken into account:
- Bulk power system: wind – 10%, PV generation – 10%, coal-fired – 20%, gas-fired generation – 20%, hydro power generation – 20%, nuclear power generation – 20%.
In order to align the power system operation modes with the microgrid, the typical power balance conditions are considered – base load, half-peak load, peak load. It is known, that in accordance with technological features different power generation facilities do participate the loading curve coverage in a different extent. From the point of view of the given problem statement, that means different equivalent LCOEs of electrical energy production and gram-equivalent CO2 emissions, corresponding to different timesteps of the loading curve:
(2)
where LCOEt eq is an equivalent LCOE for a loading curve zone t, EUR/kWh; LCOEi is the levelized cost of electric energy for a given type i of power generation facilities, EUR/kWh; is the share of electrical energy generated by a given type i of power generation facilities; n is the number of different power generation types.
(3)
where is a CO2 gram-equivalent for a loading curve zone t, gCO2/kWh;
is the share of electrical energy generated by a given type i of power generation facilities.
The sample-day loading curve of the bulk power system plotted together with the loading schedule of remote microgrid in per-unit values is presented in Figure 2. It can be seen from the figure, that loading curve zones of the power system correlate with the microgrid, so subsequent calculations are carried out with the assumption that the loading curve zones of the microgrid are aligned with the corresponding loading curve zones of the power system.
Given the seasonal measurements of the microgrid loading conditions, pessimistic perspective load growth scenario, and the form of the loading curve, one can make an estimation of the annual electric energy consumption – 1 741 680.68 kWh as well as the microgrid lifecycle energy demand (for 25 year period) – 43 542 017 kWh. Moreover, by implementing the form of the typical loading curve, the energy consumption for the entire life cycle period of the microgrid can be distributed among the loading curve zones:
- base load electrical energy share: 27 191 334.63 kWh;
- half-peak load electrical energy share: 13 105 860.91 kWh;
- peak load electrical energy share: 3 245 461.88 kWh.
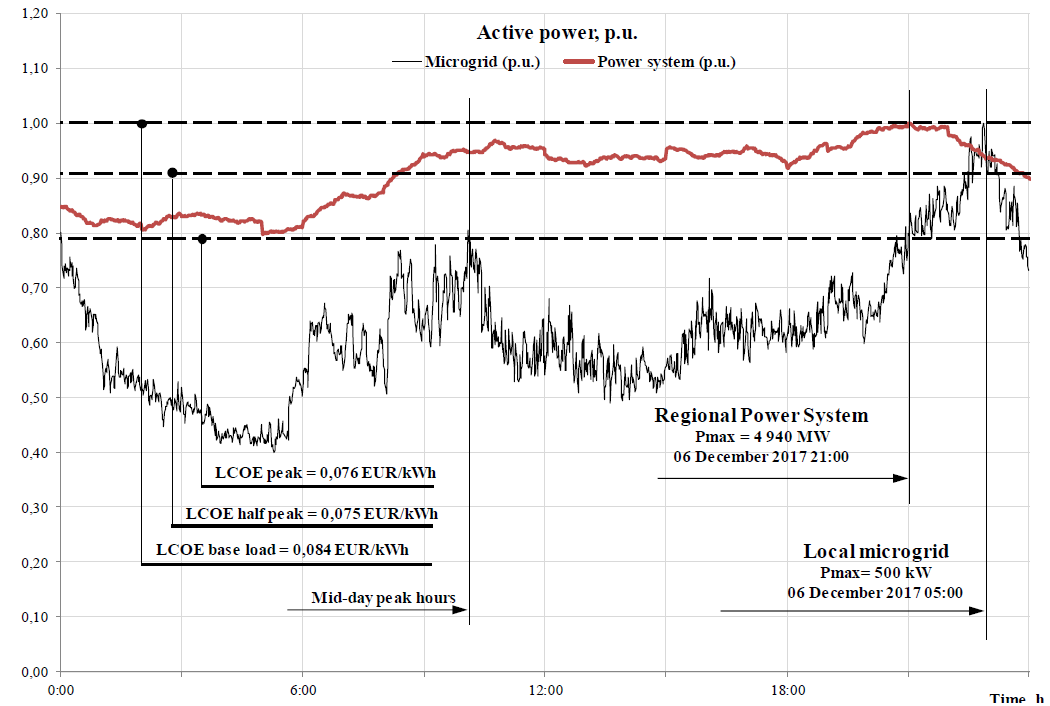
Figure 2 – Sample-day loading curves of the power system and the microgrid
As far as the case study under consideration has the basic scenario – the long-distant distribution feeder (10 kV, about 50 km), the comparison of all of the alternatives is carried out relating to the basic one. The technical and economic parameters of the existing power distribution line are summarized in Table 4.
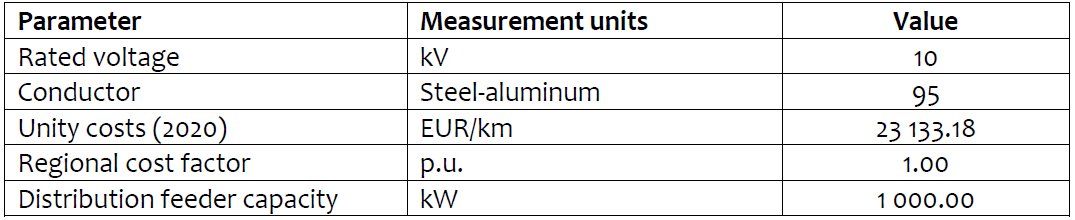
Table 4 – Distribution feeder
When dealing with power system interconnection, electric energy losses should be taken into account in LCOE calculations in the form of the operational expenses. In the basic scenario of 50 km distribution feeder, the relative value of electric energy losses are equal to 12%.
Given the linear relation between the energy losses and the length of the transmission line, distribution system LCOE can be evaluated for any potential location of the microgrid, thus, providing an effective tool for preliminary estimation of on-grid/off-grid operation efficiency. In the table below, the orange cells correspond to the LCOE, provided for the extreme-case network scenario. Rapid increase in LCOE indicates the technological limit of electrical energy transmission distance for 10 kV voltage class, resulting in the necessity of increasing the distribution network voltage rating and MV substation upgrade.
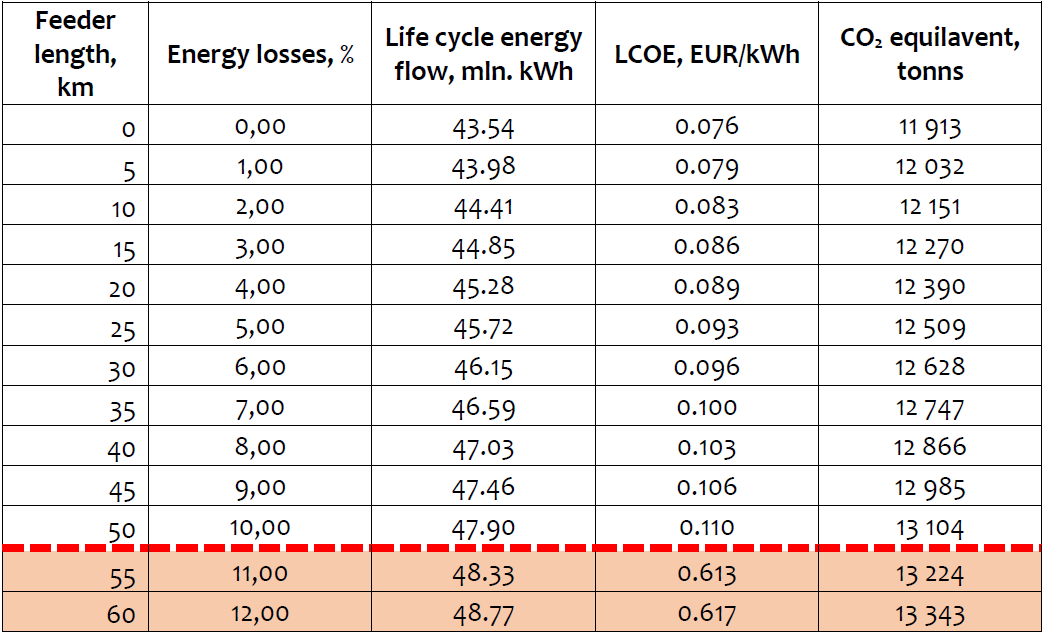
Table 5 – Microgrid network scenario calculations
When applying the proposed methodology to identify the equivalent LCOE and the corresponding gCO2 equivalent emissions for islanded operation mode of the microgrid, one should take into account the availability and technological constraints of the energy source under consideration to act as a base-load, half-peak or a peak generator. Table 6 and Figure 3 illustrate technologically feasible scenarios with the corresponding LCOEs and gCO2 for the remote microgrid under consideration.
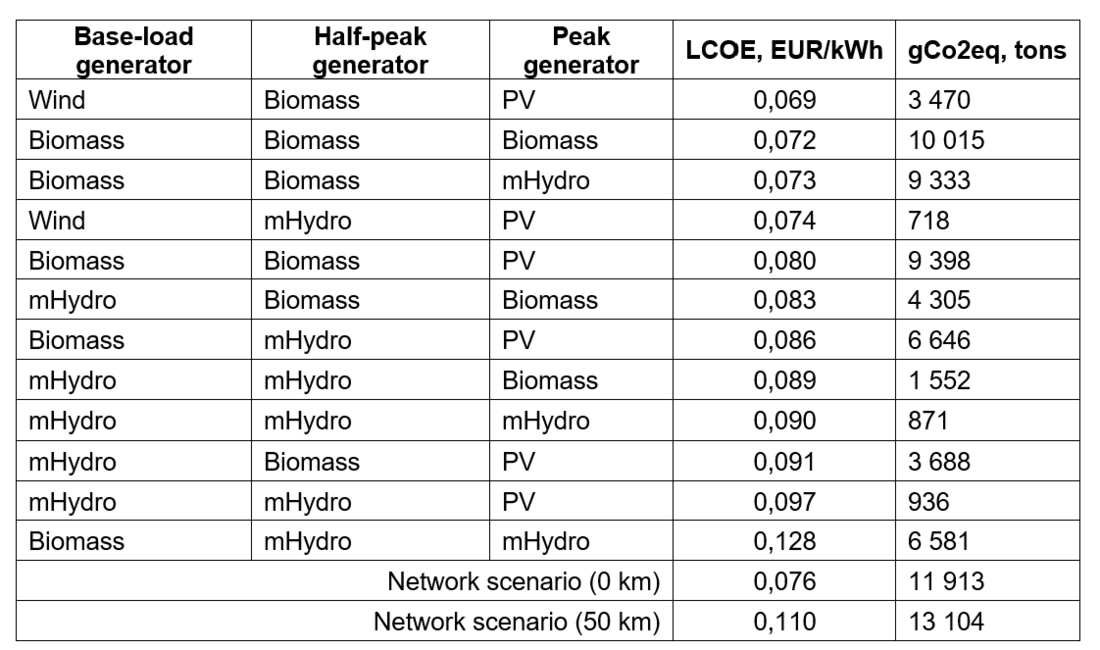
Table 6 – Microgrid islanded scenarios calculations
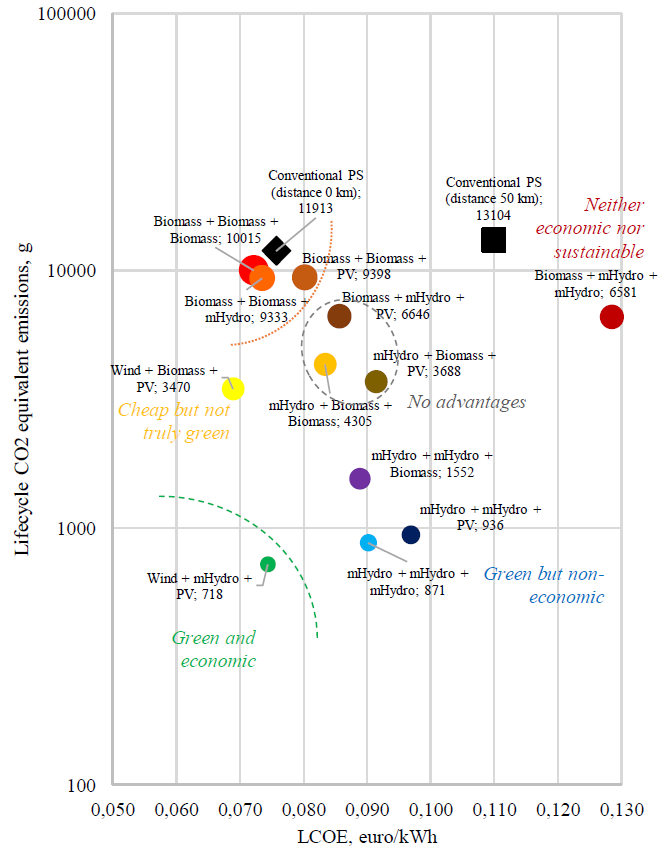
Figure 3 – Microgrid operation strategies with the corresponding LCOEs and gCO2
3. Conclusions
- The main argument for baseload paradigm is the technical one, and neither economic nor environmental. Power system baseload generation is not the cheapest if the total lifecycle is considered. Due to historical rise of coal prices, sufficient costs for increasing environmental performance of carbon plants (like air pollution filtering) and low electrical efficiency, nowadays LCOE for baseload generation is not the lowest. Nuclear power plants (where available) and gas power plants partially improves these statistics. Environmental performance of power system baseload generation dramatically differs from sub-par for coal and gas to satisfactory for nuclear power plants.
- The borders of off-grid power supply typically lay at 25-45 km of distance from power supply center to the remote customer, if comparing the solutions by LCOE. Nevertheless, a microgrid construction often provides more environmental-friendly solution.
- A sophisticated analysis is required during design and scheduling of a microgrid to determine the proper function of an embedded generation. Depending upon the environmental performance, it is possible to rearrange the alternatives with close LCOEs and reduce lifecycle CO2 equivalent emissions.
- A combination of wind, micro- and mini- hydropower (if available), biomass and photovoltaic power from base to beak provides both economic and environmentalfriendly power supply for remote customers in most of cases.
Acknowledgment
The reported study was supported by Russian Foundation for Basic Research RFBR, research project No. 20-010-00911.
References
- Sverdlovsk region regulation act “On approval of a regional strategic power industry development plan for the period of 2019-2023”, URL: http://docs.cntd.ru/document/543558516 (in Russian)
- Andersen O., Unintended Consequences of Renewable Energy. Problems to be solved. Springer Verlag . London. 2013
- F. Gonzalez-Espin, V. Valdivia, D. Hogan, D. Diaz and R. F. Foley, "Operating modes of a commercial and industrial building microgrid with electrical generation and storage," 2014 IEEE 5th International Symposium on Power Electronics for Distributed Generation Systems (PEDG), Galway, 2014, pp. 1-5
- Faisal Mumtaz, Islam Safak Bayram, Planning, Operation, and Protection of Microgrids: An overview, Energy Procedia, Vol. 107, 2017, pp. 94-100, ISSN 1876-6102, URL: http://www.sciencedirect.com/science/article/pii/S187661021631726X
- Analytical report. Levelized Cost of Energy and Levelized Cost of Storage. URL: https://www.lazard.com/perspective/lcoe2019
- Statistical report. IRENA Levelized Cost of Energy for renewable and conventional energy sources. URL: https://www.irena.org/Statistics/View-Data-by-Topic/Costs/LCOE-2010-2017
- Analytical report. Levelized Cost of Electricity- Renewable Energy Technologies: Fraunhofer ISE. URL: https://www.ise.fraunhofer.de/en/publications/studies/cost-ofelectricity.html.
- Development of renewable energy sources in Russian Federation: governmental support. URL: https://www.np-sr.ru/ru (in Russian)