B1 - Best practices for Partial Discharge Monitoring of HVDC Cable Systems and Qualification Tests
Authors
F. ÁLVAREZ, C. VERA, A. CAMUÑAS, E. ARCONES - UPM, Spain
Á. RAMIREZ, J. ROVIRA, P. SIMON - FFII-LCOE, Spain
F. GARNACHO, A. KHAMLICHI - FFII-LCOE, UPM, Spain
J. ORTEGO - UPM, DIAEL-AMPACIMON, Spain
Summary
Transmission and distribution networks using HVDC cable systems play an increasingly important role in the electrical energy of the future. Offshore wind power generation facilities also require multi-kilometre long HVDC cable systems. Despite this, the usual insulation condition monitoring systems that are based on partial discharge (PD) measurements are generally not suitable for detecting defects in HVDC cable systems. For this reason, it is necessary to analyse what should be the specific requirements of PD measuring instruments to be requested for PD monitoring of isolated HVDC cable systems.
On the one hand, the cables used for HVDC transmission lines have a low signal attenuation and therefore the sensitivity in the acquisitions is higher than in HVAC cables. However, on the other hand, it is known that the PD rate of an internal insulation defect (cavity type) in HVDC cables is very low and depends on the applied voltage and on the temperature variations. This low PD activity in HVDC cables means that these types of pulses can easily be mistaken with electrical background pulse-type noise signals. The presence of strongly pulse-type electrical noises is very common in the AC/DC converter installations located at the ends of HVDC cable systems, making it difficult to discriminate the PD pulses generated in the insulation defects.
The pulses behaviour in the time domain, generated in various defects of a HVDC cable system (cavity, surface and corona), are analysed. After analysing the evolution of the PD activity related to the previous defects, the necessary tools for the monitoring systems required to tackle with PD measurements in HVDC cable systems are specified. The technical requirements to be faced by the PD monitoring systems implemented in HVDC cables monitoring are described from the point of view of hardware, signal processing and intelligent diagnostic tools.
The qualification tests for PD monitoring applications used in HVDC cable systems were developed according to the results obtained in the research carried out inside the European project EMPIR “FutureEnergy”. These tests were intended to determine the measurement sensitivity, the electrical noise rejection capability, the defect location error and the ability to identify defects (cavity, surface, corona and floating electrode) using DC-type PD patterns. The qualification procedure presented is implemented in a synthetic PD calibrator. In this synthetic calibrator a large set of representative digital files with PD pulse trains are stored. These time series of pulses are from the four different PD sources mentioned and can be mixed with various types of electrical noises. The digital files are converted to analogue signals using a 50 MHz and 16-bit D/C converter. The results of a qualification test are also presented.
Keywords
PD in HVDC cable systems - Qualification tests - Synthetic PD calibrator - noise rejection - PD sensitivity - PD recognition - PD clustering - PD location1. Continuous PD Monitoring of a HVDC cable system
The partial discharge (PD) monitoring approach for HVDC cable systems must be different from that used for HVAC cable systems. Sustained partial discharge activity of several hundred pulses per second for hours or days typically occurs when there is a cavity defect in the insulation of HVAC cable systems, however, when an insulation defect occurs in an HVDC cable system, only a few PD pulses are produced per minute. Furthermore, many thousands of pulses per minute linked to external phenomena such as noise disturbances or corona effect can appear simultaneously. Therefore, PD measuring systems used for HVDC measurements must be able to remove noise and to discriminate different types of impulsive signals to recognize them. Classic phase resolved PD patterns are not available in HVDC measurements, more complex artificial intelligence tools are required to recognize HVDC PD patterns. Numerical sequential series of PD pulses, which amplitudes and time intervals between consecutive pulses, are the only input data to identify what PD defect is involved in a PD measurement. PD clustering by the waveform is needed; otherwise, incorrect numerical sequential series could be considered leading to incorrect diagnostics.
A set of tests are proposed for the qualification of PD measuring systems to be used for monitoring the insulation condition of HVDC cable systems. The concept of apparent charge, qIEC, defined by IEC 60270 [1] as the largest PD magnitude that occurs repeatedly is not applicable to HVDC cable systems. The PD measuring approach according to IEC 60270 is not either applicable for continuous on-line PD monitoring. When a cable system must be tested in service unconventional PD techniques should be applied according to TS IEC 62478 [2]. If you want to monitor a complete cable system along its entire length, the use of HFCT sensors placed, depending on the cable attenuation every few kilometers, is the most suitable solution [3] to reduce the number of sensors to be used. A recommended measurement procedure for PD monitoring of cable systems using HFCT sensors is described in [4], which flowchart is shown in Figure 1. After the data acquisition of step 1, denoising tools are useful to reject non impulse noise (step 2) [5] and [6]. When non impulse noise is removed, only impulsive signals will remain in the filtered data. Then, PD pulse location tools, based on traveling impulsive signals, can be applied to obtain the corresponding PD mapping. These tools will allow to determine where PD sources are placed along cable length (step 3). If a PD source is located between the two cable ends (steep 4), for example in a cable splice, then the PD source will correspond to an internal defect and an alert signal should be triggered. However, if PD source is not located along the cable system, then it could be placed in one of the two cable ends or outside the cable system. PD clustering tools using pulse waveform parameters (step 5) are useful to distinguish different PD sources [7] and [8] that were detected at the cable ends. Then PD recognition tools can be also applied to each PD source to identify any PD pattern associated with an internal defect (step 6). If that happens, and the pulse polarity of this PD pattern shows that it is associated with a PD source at the cable termination (see step 7), then an alert signal should be activated. Finally, when the PD amplitude and PD rate related to an internal defect increases above threshold values (step 8) an alarm signal should be generated. The PD rate (PD pulse repetition frequency) related to an internal HVDC defect is very low compared to other impulsive signals from other sources of PD (such as corona effect or surface defect) or pulse noise. For this reason, PD pattern recognition is very important to trigger an alert signal.
A standardized qualification procedure for HVDC and HVAC cable system PD monitoring systems is needed to define the requirements and the tests that must be met. Different research institutes collaborate in the “FutureEnergy” project [9] trying to contribute to this international standardization.
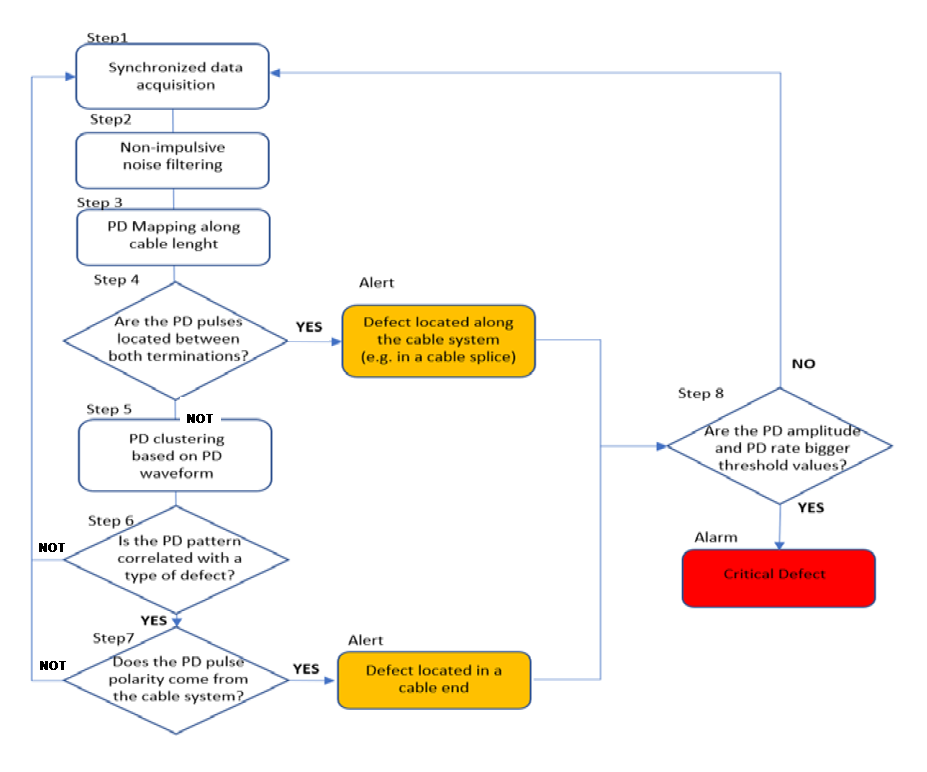
Figure 1 - Flux chart for continuous PD monitoring of HVDC cable systems using HFCT sensors
2. Technical basis for characterization PD measuring systems that use HFCT sensors
2.1 Measuring system using HFCT sensors
A measuring system using a HFCT sensor as coupling device includes a coaxial cable as signal transmission system and a PD measuring instrument operating in high frequency range up to 30 MHz (figure 2). According to IEC 60270 the transfer impedance Z(f) of any PD measuring system is the ratio of the output voltage amplitude, Vout, to a constant input current amplitude, Iin, as a function of frequency f, when the input is sinusoidal. The transfer impedance Z(f) has a direct relationship with the sensitivity of the entire measuring system, since the higher the output signal Vout for 1 mA of the input PD current pulse, the higher the sensitivity of a PD measurement. When the coupling device is HFCT sensor, the transfer impedance is given by the rms output voltage divided by the rms input current, (mV/mA), which should be determined from 0.5 kHz to 50 MHz. The rated transfer impedance, Zr, is defined as the transfer impedance value that does not changes more than ±5% in the HFCT bandwidth. The rated transfer impedance must remain constant within ±5% in operation frequency limits fA ≤ 1 MHz and fB ≥15 MHz (Figure 3) to assure reproducible measurements, because for HVAC and HVDC cable systems the frequency PD impulse components between 1 MHZ and 15 MHz are the most representative.
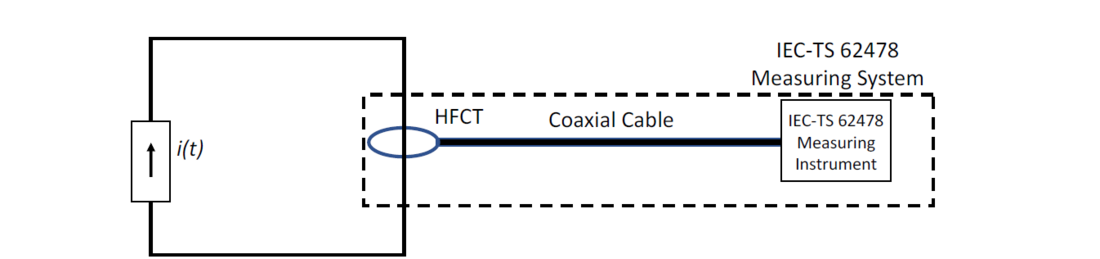
Figure 2 - Measuring system using a HFCT as coupling device (IEC-TS 62478)
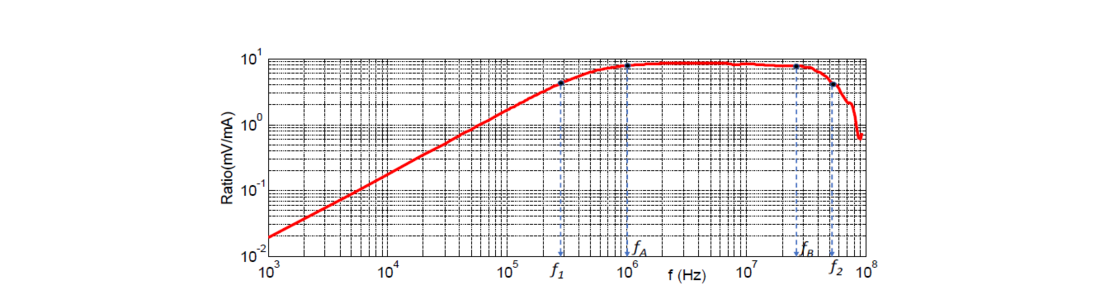
Figure 3 - Transfer impedance Z(f) of a HFCT sensor used as coupling device of a measuring system:
Bandwidth defined by f1 and f2; operation frequency range defined by fA and fB
2.2. Synthetic generator of PD pulse trains
For qualification tests a current pulse generator is used. This pulse generator emulates PD current pulses trains, whose individual PD current pulse waveforms are synthetically generated at instants where PD pulses were recorded in PD event train. The synthetic PD generator of PD current pulse trains can operate in “PD calibration mode” generating known PD pulses, q, with a known pulse repetition frequency, N or in "PD pattern generation mode” generating PD current pulses according to a selected PD event train linked to a type of defect. A wide set of PD event trains representative of type defects are available in a reference database. In addition, different electrical noises can be also superimposed on the PD current pulse train to be generated. The synthetic generator is built by means of an arbitrary function generator (AWG) reproducing digital waveforms to emulate real PD current pulses and representative impulsive noises. The injected charge of each current PD pulse is measured by a pulse integrator placed at its output, which is used to adjust the voltage amplitude of the AWG to achieve the target injected charge (Figure 4).
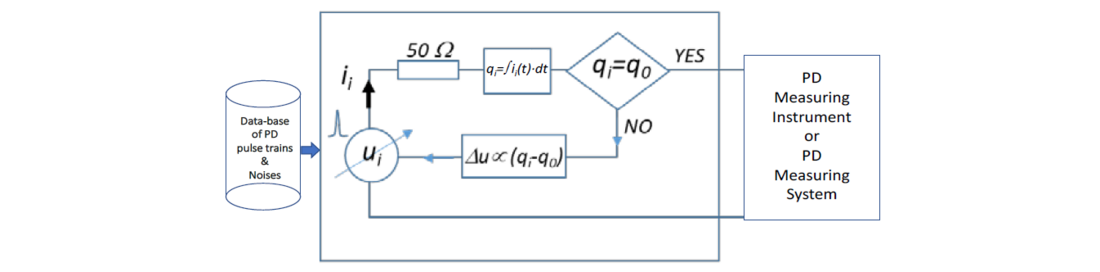
Figure 4 - Conceptual circuit of a synthetic PD calibrator on the basis of an AWG with a current integrator
2.3. PD current pulse waveforms
An inverse double exponential function of α, β parameters is used to emulate unipolar PD current pulses.
(1) ; where:
(2)
The equivalent width of a rectangular PD pulse with the same charge value as the doble exponential PD current pulse is named TPD parameter.
(3)
Replacing formula (1) in the expression (3) TPD can be expressed by:
(4)
The TPD value is closely related to the upper frequency limit of the PD pulse frequency spectrum. The shortest equivalent rectangular current PD pulse to be measured with an admissible error is related to the bandwidth of the HFCT sensor. Therefore, the amplitude error versus TPD value should be determined in the characterization of a PD measuring systems using HFCT sensors.
Although unipolar PD current pulses are used in “calibration mode” when the synthetic generator operates in “PD pattern generating mode” corresponding to PD current pulses acquired in field measurements, damped oscillating current PD pulses are more appropriate waveforms to emulate real PD pulses. A sinusoidal waveform with an oscillation frequency, f, and a phase shift, , damped by an inverse double exponential function are chosen applying the following formula:
(5)
Both unipolar and damped sinusoidal waveforms in time and frequency domain are shown in Figure 5.
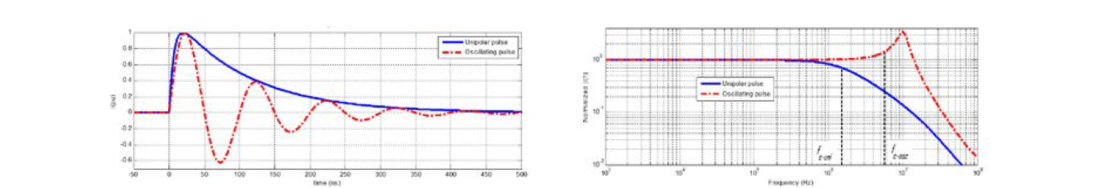
Figure 5 - Unipolar and damped oscillating pulse waveforms:
a) Amplitude-time evolution; b)Amplitude-frequency spectrum
2.4. Type of electrical noises
Noise rejection tools should operate in two steps. The first step is focused to reject non-impulsive components of the background noise, for example by means of band-rejection filters or wavelet filters [5]and [6] and the second step to remove the impulsive components by means of pulse clustering tools[7]and [8]. An example of a raw data acquisition in a HVDC converter plant is shown in table 1. Theraw data was filtered by means of an iterative wavelet filter, to remove non-impulsive component of thenoise (second raw of the table 1). Consequently, only the impulsive components (impulsive noise + PDpulses) remain after filtering out the non-impulsive components. Then, the PD clustering tool should beapplied to separate different impulsive signals in such a way than impulsive noises and PD sources canbe discriminated by identification theirs PD patterns.
2.5. Scale Factor of a PD Measuring system that uses HFCT sensors
The goal of a measuring system using HFCT sensors is to acquire most frequency components of the original PD pulse so that it could be reconstructed if desired. For this reason, unlike an IEC 60270 measuring system, the upper cut-off frequency f2 of the transfer impedance of an IEC TS 62478 measuring system using HFCT must be much greater that the upper frequency limit of the PD current impulse. Assuming the transfer impedance of the measuring system Zr remains constant for all PD pulse amplitude-spectrum the scale factor of a measuring system is given by:
(6)
Formula (6) shows two influence parameters on the Scale Factor, k: the transfer impedance, Zr, and the PD time TPD of the PD current impulse to be measured. Taking into account that the transfer impedance Zr does not remains constant for all PD pulse spectrum, the cut-off frequencies, f1 and f2 of the measuring system also affect the scale factor.
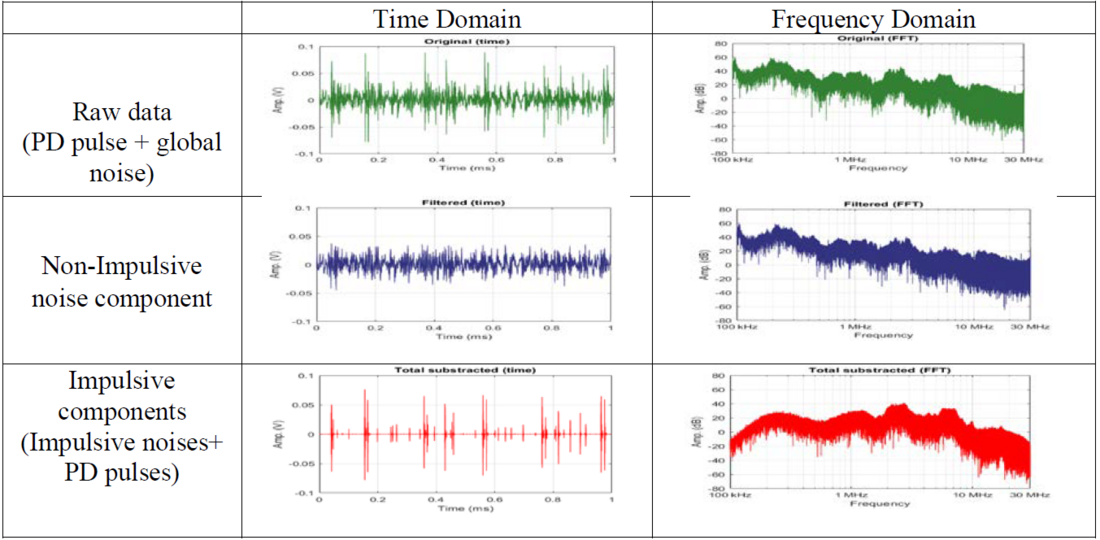
Table 1
The smaller the scale factor the greater the sensitivity of the measurement system is achieved; therefore, the rated transfer impedance should be as high possible. Usually, it is found between 4 Ω and 10 Ω to get a flat frequency response. Small values of TPD (very narrow pulses) correspond to a higher upper frequency limit in its amplitude-spectrum, so to acquire all frequency components of the original PD pulse, the upper cut-off frequency limit, f2, of the measuring system should be greater than upper frequency limit of the PD pulse. TPD values around 75 ns are the most representative of the PD measurements in HV cable systems. The standardized PD current pulse of 75 ns using an inverse DE function in the time and frequency domains is shown in Figure 6.
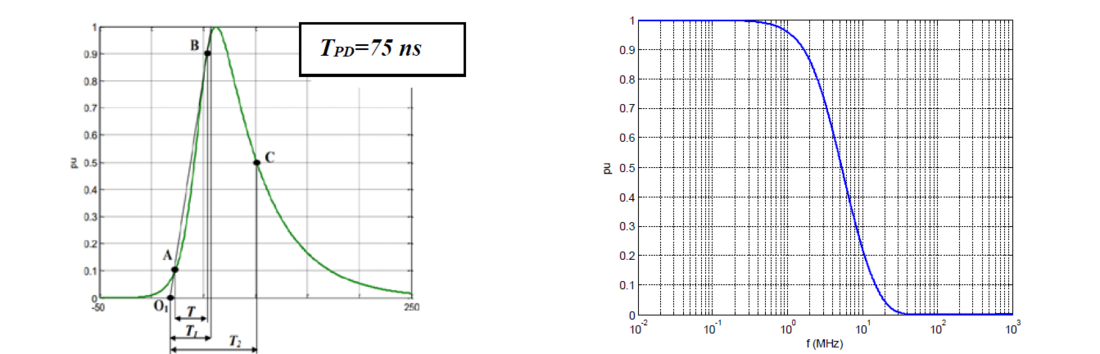
Figure 6 - Standardized PD current pulse of TPD=75 ns using the inverse DE function formula (1):
a) in the time domain; b) in the frequency domain
3. Representative PD pulse trains in HVDC cable systems
PD current pulses generated by a type of insulation defect, such as corona, surface and cavity under high voltage stress (positive or negative polarity) are saved as reference trains of PD current pulses in a database. For the cavity defect, PD activity appears when a voltage change occurs (e.g. 30 kV with a time constant of 16 s). This reference database of PD event trains acquired in laboratory tests provides an experimental and traceable reference of insulation defects in HVAC and HVDC to evaluate the efficiency of PD analysers. Each data couple of a pulse of a PD train is defined by its individual charge value, qi, and its starting instant, ti. On the basis of more than 2000 tests carried out for each defect type three representative PD curves can be displayed: a) accumulated charge curve, b) monotonous decreasing histogram and c) PD histogram distributed in levels, as they are shown in table 2.
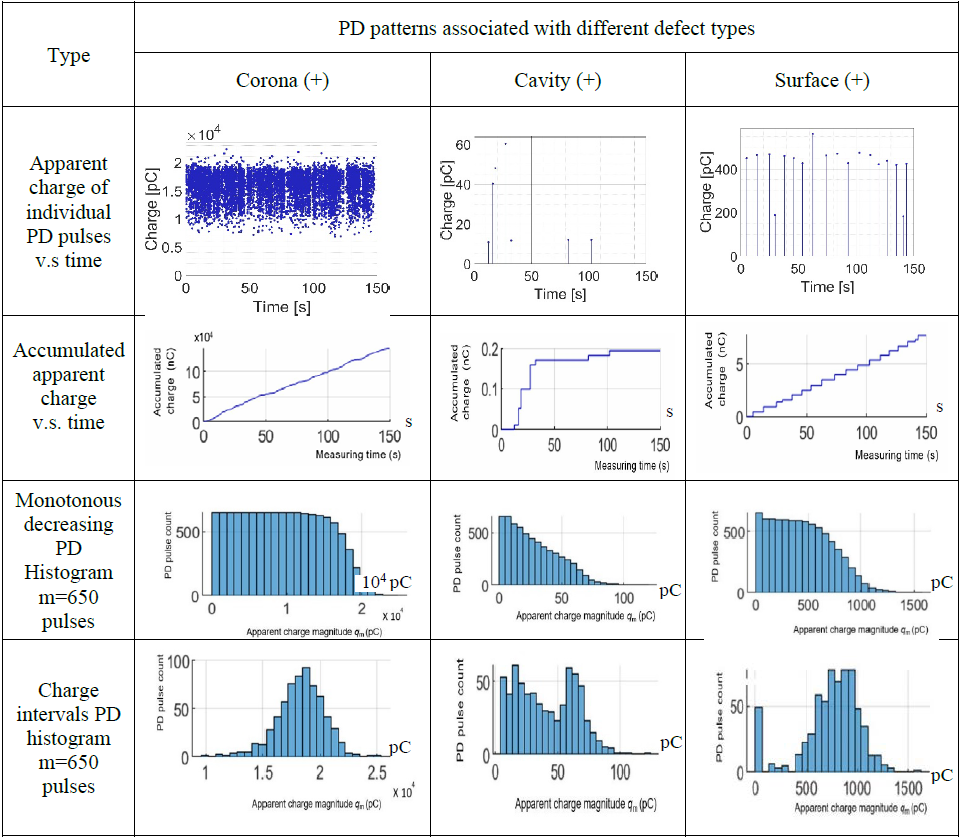
Table 2
4. PD calibration setup to check PD analyser performances
The calibration setup to check PD analyser performances is shown in Figure 7. It is composed of a Synthetic PD generator connected to a 50 Ω load resistor through a coaxial cable of 50 Ω characteristic impedance. The PD current pulse trains will be injected in a current loop where the HFCT sensor of the PD analyser under characterization is installed. A reference PD measuring instrument connected at the 50 Ω load resistor through a transmission coaxial cable can be used to carried out calibrations by comparisons measurements.
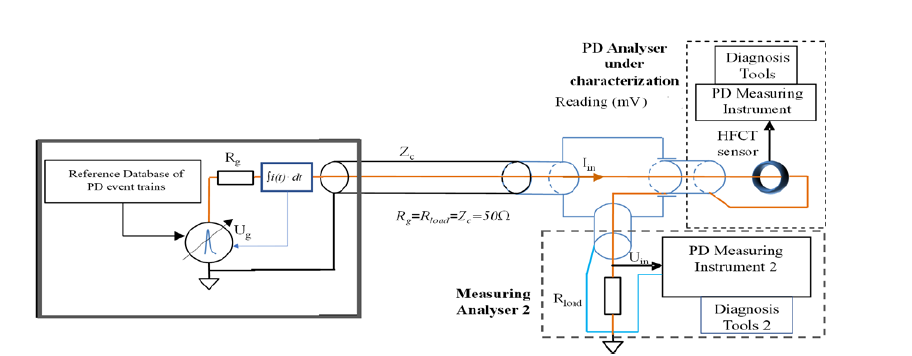
Figure 7 - Calibration setup to check a PD analyser and to perform calibrations by comparison measurements
5. Qualification procedure to check a PD analyser using HFCT sensors
A PD analyser is a PD measuring system with additional hardware or software tools to get an automatic or semi-automatic evaluation of insulation condition (PD clustering, PD recognition, and PD location tools). The qualification tests are summarized in Figure 8. Tests 1 and 2 are related to the PD Measuring System and tests 3, 4 and 5 to specific abilities of their software tools. A Round Robin test is planned between research institutes from Spain, Finland, Sweden and the Netherlands.
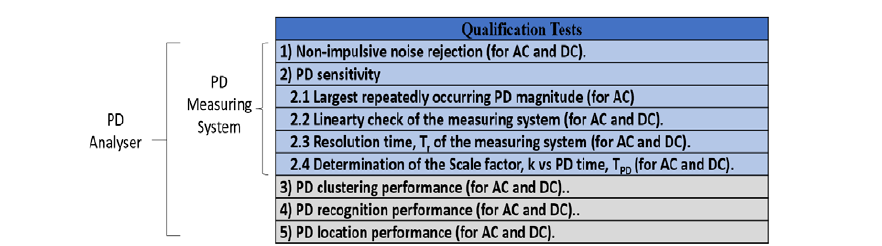
Figure 8 - Summary of the qualification procedure of a PD analyser
5.1. No impulsive Noise-rejection Test
A PD pattern related to a defect is all the more difficult to recognize the greater the number of erroneous pulses it contains. Filtering techniques are used to reject erroneous PD pulses but, at the same time, they remove pulses belonging to the original pulse train related to the defect. A filtering tool should remove noise by sacrificing the fewest number of PD pulses belonging to the original PD pulse train. To evaluate the efficiency of a noise-rejection filter, the PD repetition rate error, εn, is determined when a white noise superimposed to a Math PD current pulse train is filtered. The curve of PD repetition error vs different amplitude levels of the white noise is determined. The measurement error refers to the reading of the measuring instrument without noise. The noise level is expressed in pC measured with a wideband PD measurement system operating between the upper and lower frequencies of 100 kHz and 500 kHz, respectively.
The Synthetic PD Calibrator injects mathematically generated PD current pulses of TPD =75 ns, mixed with different levels of white noise. Four PD pulse trains of 10 pC, 50 pC, 100 pC and 200 pC will be generated to analyse the influence of the noise rejection tool against the PD charge amplitude. Each pulse train is made up of consecutive bursts of 10 pulses with decreasing amplitude from 100% to 10% in steps of 10%, as shown in Figure 9.a), separated by 1 ms between them (N = 1000 pulse/s). White noise is superimposed, whose amplitude will be applied in a decreasing manner, from the highest level of noise to no noise. Figure 9.b) and 9.c) shows the PD repetition rate error curves for two different noise rejection tools: b) Noise rejection tool based on selection of measurement frequency and noise threshold level, c) Rejection tool based on automatic wavelet filtering.
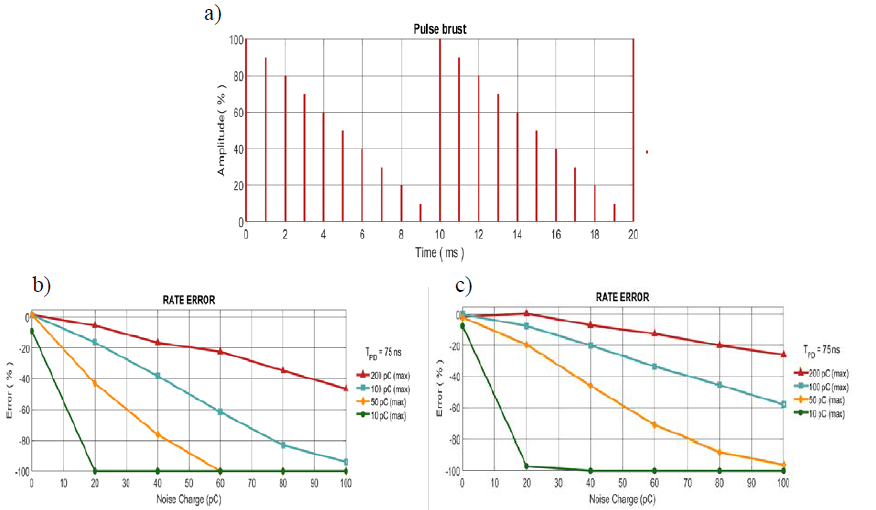
Figure 9 - a) PD current pulse train used for the Noise Rejection Test Noise Rejection Test.
PD repetition rate errors of two Filters based on:
b)Selection of the measuring frequency; c) By automatic wavelet filtering
5.2. IEC 60270 Tests
The objective of IEC 60270 tests is to check the compliance of the IEC 60270 requirements to be satisfied by a PD analyser used for on-line PD monitoring of HVDC cable systems, which are the following: a) Linearity Test, b) Resolution Time and c) Scale factor Test. The testing procedure of the Scale factor Test is explained in detail in the next paragraph due its particularities, the others are well defined in the IEC 60270 standard.
Three different PD current pulse waveforms with TPD =37,5 ns; 75 ns and 150 ns respectively will be generated by the Synthetic PD calibrator to analyse the influence of the TPD value on Scale Factor, k. A math PD current pulse train to be used for of this test is composed of six 10-seconds intervals, ΔTi. PD current pulses with the same TPD are applied for each 20-seconds varying the charge amplitude from 100 pC to 1000 pC each 10-sencond interval. The repetition frequency, Ni at 100 pulses/s shall remain constant during all test, as shown in Figure 10. So, in the 60-seconds sequence the three pulse waveforms (TPD = 37,5 ns, 75 ns and 150 ns) are generated. The Scale Factor for each 10-second time interval, it should not change for different charge amplitudes, but it will change for different TPD values.
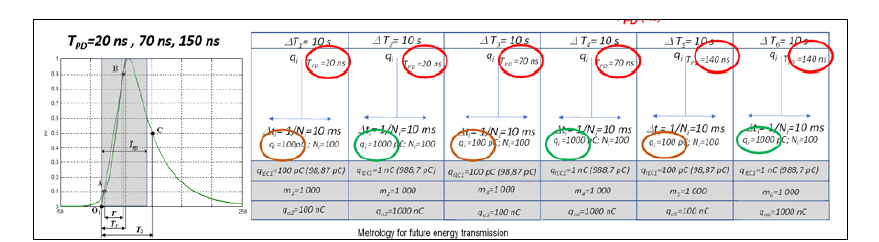
Figure 10 - Testing procedure to determine the Scale Factor vs TPD value
5.3. PD clustering performance
The ability of a PD analyser to separate different PD trains linked to different insulation defects or impulsive noises is carried out using the synthetic PD calibrator in the "PD defects generation mode". The test consists of superimposing two trains of PD current pulses linked to different type of insulation defects, that are mixed with two types of impulsive noises. Each pulse train (PD defect train or impulsive noise train) will have different waveforms and amplitude values. A different dampened sinusoidal waveform is used for each pulse train to simulate the specific traveling condition of each impulse source. The two noises will have the biggest PD amplitude values (100% and 75% respectively) and the two PD current pulse trains the two the smallest (50% and 25%). The amplitude PD level of each train will be measured by a wide-band IEC 60720 measuring system. The test is repeated to cover all possible combinations between type defects, type noises and the two amplitudes for each one.
5.4. PD defect recognition
The ability of a PD analyser to identify at least five different PD current pulse trains of each insulation defect. The synthetic PD calibrator is used operating in the "PD defects generation mode". The test consists of generating PD current pulse trains taken from the reference database of representative of defects in HVDC cable systems. The PD analyser identification tool must identify which PD defect is linked to each PD current pulse train.
5.5. PD location performance
Evaluation of the ability of a PD analyser to determine the location of a PD source along a cable system is carried out using the synthetic PD calibrator in "PD Defect Generation Mode". The test consists of injecting a PD current pulse train at an unknown location, x, along a coaxial cable of known length L. PD current pulses will be injected by the synthetic PD calibrator between the conductor and the cable shield. The PD current pulse train will be taken from the reference database of the PD event trains.
6. Conclusions
For PD monitoring of HVDC cable systems a set of five qualification tests have been defined: noise rejection test, sensitivity test, clustering test, recognition test an PD location test. A reference database of PD current pulses linked to type defects has been generated by laboratory tests thanks to the “FutureEnergy” project. It is advisable that other research institutes develop more reference databases of "defect types" to make international comparisons that lead to international traceability of reference PD event trains linked to "defect types". Using synthetic PD calibrators and an appropriate testing setup a Round Robin Test is planned between six research institutes applying this qualification procedure.
References
- IEC 60270 “High Voltage Test Techniques- Partial Discharge Measurements”
- IEC-TS 62478 “High voltage test techniques - Measurement of partial discharges byelectromagnetic and acoustic methods”.
- F. Garnacho, J. Ortego, M. A. Sánchez-Urán “Approach for on-line monitoring of cables systemsusing the minimun number of PD sensors; 20th International Symposium on High VoltageEngineering – ISH 2017 Buenos Aires.
- E. Aracones, A Khamlichi et al.” Qualification tests for partial discharge instruments to be usedfor insulation condition monitoring of HVDC cable systems using HFCT sensors” Liege Belgium JICABLE Nov. 2021.
- S. Sriram, S. Nitin, K. M. M. Prabhu, M. J. Bastiaans “Signal Denoising Techniques for PartialDischarge Measurements” IEEE Transactions on Dielectrics and Electrical Insulation,Vol.12, No.6; December 2005.
- Wenjie Li, et al. “Research on Extraction of Partial Discharge Signals Based on WaveletAnalysis”; 2009 International Conference on Electronic Computer Technology ; DOI: 10.1109/ICECT.2009.57 ; Macau, China
- Ardilla-Rey, J.A.; Rojs-Moreno, M.; Martinez-Tarifa, J.M.; Robles, G. “Inductive sensorsperformance in partial discharges and noise separation by means of spectral power pints” Sensors;Vol. 14, No 2; pp. 3408-3427; doi: 10.3390/s140203403408; feb 2014.
- F. Álvarez, J. Ortego, F. Garnacho, M.A. Sánchez-Urán. “A clustering technique for partialdischarge and noise sources identification in power cables by means of waveform parameters”. IEEE Transactions on Dielectrics and Electrical Insulation.
- 19ENG02 FutureEnergy “Metrology for future energy transmission” EURAMET H2020 Project,EMPIR Program.