B3 - Online Monitoring and Data Analytics Enabling LV Network Investment Optimisation for a Low Carbon Future in Ireland
Authors
J. HERRING - ESB, Ireland
J. FITZGERALD, E. SILKE, H. CUNNINGHAM, F. PIENAAR, C. POWER, D. CATANASE

Summary
In Ireland, the Government’s Climate Action Plan [1] sets out ambitious targets with respect to the electrification of both transport and heat, with almost 1 million Electric Vehicles (EVs) and 600,000 Heat Pumps (HPs) targeted by 2030.
In particular, and in respect of EV uptake, challenges are foreseen in relation to the ability of the LV network to accommodate this increase in Low Carbon Technology (LCT) usage.
It is therefore anticipated the use of home charging will significantly change the load characteristics and requirements of domestic customers, challenging fundamental assumptions made in the design of the LV network. A proactive strategy of network reinforcement is now required to avoid undervoltage or overloading issues, as EV penetration and the use of home chargers increases.
This paper focuses on the anticipated issue of likely overloading of MV/LV transformers due to such a change in domestic load and will detail the approach ESB Networks (the Irish Distribution System Operator (DSO) and Distribution Asset Owner (DAO)) has taken to move to a proactive strategy for the uprating of these transformers, as opposed to an alternative reactive “wait and see” strategy.
This paper describes the approaches taken to forecast load, identification of at-risk units and finally the monitoring (current and temperature) of those units. It details the Internet of Things (IoT) solution implemented, in relation to both hardware and software. Various analyses carried out on the data are presented, including loading on the fleet, development of a model to improve load estimation, analysis of customer After Diversity Maximum Demand (ADMD), load factor, annual load patterns, as well as transformer temperature/load modelling.
Keywords
Electrical Installations - Online Monitoring - Data Analytics - Low Voltage Network - Electrification of Transport - Electric Vehicles1. Introduction
Ireland has committed to reducing Greenhouse Gas (GHG) emissions by 2030 through the government’s Climate Action Plan (CAP) [1] and this will create significant change in how we generate and use energy across every sector of society. To this end, in Ireland, the CAP sets out ambitious targets with respect to the electrification of both transport and heat, with almost 1 million Electric Vehicles (EVs) and 600,000 Heat Pumps (HPs) targeted by 2030.
The ability of electricity networks to adapt and innovate in this changing and uncertain environment will be crucial to enabling successful energy transition and decarbonisation of every sector of society. ESB Networks, the Irish Distribution System Operator (DSO), will play a leading role in making this a reality, ensuring that the electricity distribution network, which serves 2.3m electricity customers, is prepared and equipped to adapt to meet the changing needs of our customers and to support the achievement of Ireland’s climate action targets [2].
This paper focuses on the challenges posed by the significant increase of plug-in hybrid (PHEV) and battery electric (BEV) vehicle sales, specifically in relation to domestic charging.
It is anticipated the use of home charging will significantly change the load characteristics and requirements of domestic customers, challenging fundamental assumptions made in the design of the LV network to date. A proactive strategy of network reinforcement is now required to avoid undervoltage or overloading issues, as EV penetration advances in the national fleet and the use of home chargers increases. This paper focuses on a proactive monitoring strategy to combat this issue on MV/LV substations.
1.1. Overview of MV/LV transformer fleet and the LV system
An MV/LV substation contains a transformer with MV and LV switchgear. It takes power at 10 kV or 20 kV and transforms it to 400 V 3-phase / 230 V single phase. An MV cable exits from the MV busbar of a HV/MV substation and is then split in and out of each MV/LV substation along the circuit. Customer numbers on an MV feeder are typically between 2,000 and 4,000 in dense urban areas, and less than 2,000 outside these areas. Figure 1 shows a typical Ground Mounted Substation. Rural areas are more typically serviced by smaller Pole Mounted Transformers, either 3-phase or single phase. An example of a 3-phase model is shown in Figure 2. Table 1 shows the number of each transformer type managed by the Distribution Asset Owner (DAO) and DSO, ESB Networks.
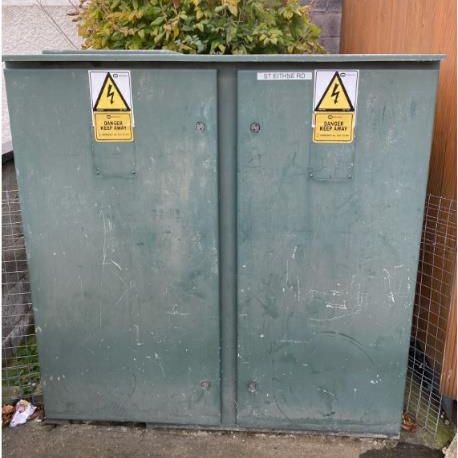
Figure 1 - 630 kVA Unit Substation
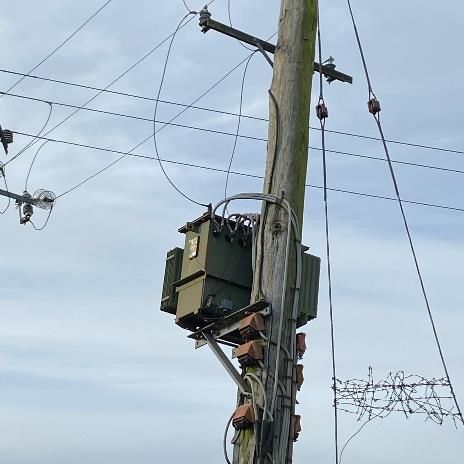
Figure 2 - 200 kVA Pole Mounted Substation
| Rated Load (KVA) | Building structure | Kiosk substation | Pole substation | TOTAL |
|---|---|---|---|---|
| 15 | 0 | 0 | 176172 | 176172 |
| 33 | 0 | 0 | 33295 | 33295 |
| 50 | 0 | 0 | 11906 | 11906 |
| 100 | 39 | 12 | 5453 | 5504 |
| 200 | 490 | 4152 | 3680 | 8322 |
| 400 | 2429 | 7326 | 0 | 9755 |
| 630 | 2721 | 2282 | 0 | 5003 |
| 1000 | 1405 | 64 | 0 | 1469 |
| TOTAL | 7118 | 13848 | 230460 | 251426 |
1.2. Analysis of uptake of electric vehicles in Ireland
Figure 4 shows a summary of overall car sales in Ireland by fuel type for 2021 and 2020. The EV uptake trend is very clear and shows a decrease in petrol and diesel engines sales, alongside a notable increase in both BEVs and PHEVs.
This growth in EV adoption is echoed across the wider market with the European Automobile Manufacturers’ Association reporting that electrified vehicles made up one third of EU vehicle sales with pure electric models seeing sales figures growing by 57% in Q3 in 2021.[5]
Figure 3 shows a map of small areas in Ireland, coloured by the percentage of households in that area who have applied for a home charger grant [6]. Electric vehicle uptake is heavily weighted towards the east of the country, in particular Dublin and surrounding counties, as well as the larger cities of Cork and Galway. This analysis aids selection of transformers to monitor, as areas more at risk from an EV charging viewpoint can be easily identified.
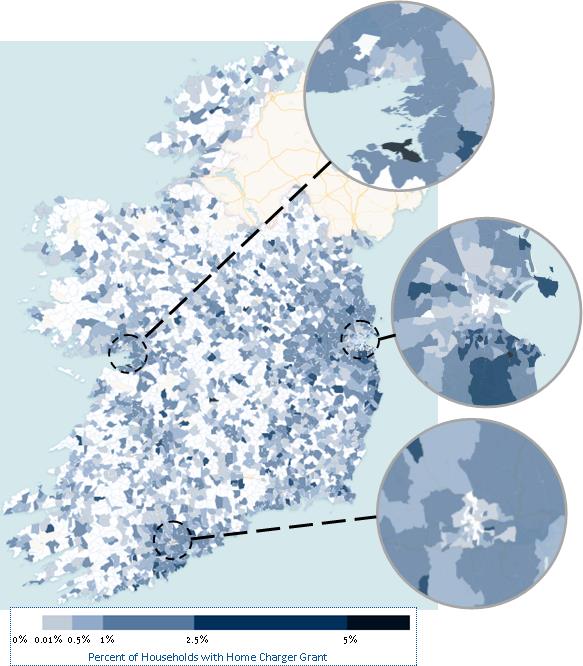
Figure 3 - Percentage of households in Ireland with EV chargers
Figure 5 shows the numbers of new BEVs and PHEVs registered in Ireland per year since 2015. These purchase rates can both be modelled as exponential functions. If this uptake continues, there is a strong indication that Ireland will likely meet its target and see close to 1 million EVs on its roads by the end of 2030. To predict future BEV sales, the rate of increase is 1.73 times the previous years’ number (R2=0.94). For PHEVs this rate is 1.94 (R2=0.96).
This scale of EV ownership, in particular the impact on domestic charging, will fundamentally change LV network design assumptions and challenge existing infrastructure, which this work seeks to address.
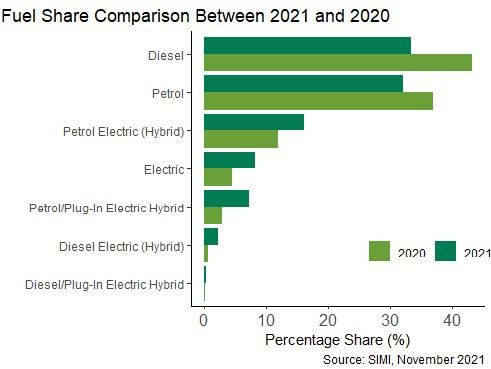
Figure 4 - Car sales by fuel type 2020 and 2021 [3]
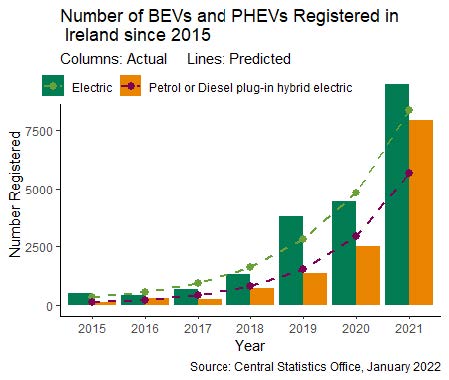
Figure 5 - BEV and EV sales in Ireland since 2015 [4]
1.3. Overview of the process applied
The approach formulated to solve this challenge can be defined in 5 main stages, shown in Figure 6:
Forecast: estimate the load on a transformer using all available datasets, primarily customer kWh readings.
Identify: based on the forecasted load results, identify transformers considered ‘at-risk’, also considering likely LCT uptake in the local area.
Monitor: install monitoring devices, to record current and temperature data on the identified transformers. This allows identification of overloaded transformers.
Smart Solutions: where monitoring results indicate overloading risk, the approach in the first instance considers that smart solutions (e.g. managed EV charging) will be sought and implemented, where possible.
Strengthen Network: we then move to prioritise network uprating where required.
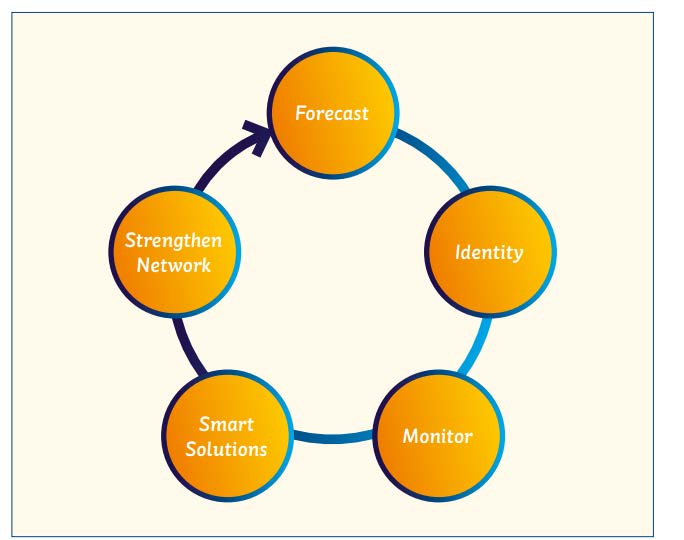
Figure 6 - Proactive Process Diagram
The Forecast and Identify steps are described in Section 2. The Monitor step is described in Section 3, including the monitor hardware, installation and Microsoft Azure based IT platform. Section 4 details the results of analysis carried out on the monitoring data received for the 2021 Winter Peak load.
2. Forecasting and identification of units to monitor
The maximum load on each transformer is estimated using the sum of 2020 kWh readings from the connected customers. Equation (1) was developed to facilitate this.
(1)
Various assumptions are taken in the formula:
- Days: 339 days estimated where residential buildings use electricity
- Hours: 24 hours per day. The Load Factor adjusts electricity usage to the estimated hours per day.
- Load Factor (LF): It is generally assumed that the LF for residential buildings is 0.5
- Power Factor: assumed to be 0.9.
- kWh dg12 24HR: Total annual electricity consumption of domestic customers on 24-hour tariff
- kWh dg12 day: Total daytime electricity consumption of domestic customers on day/night tariff
- kWh dg56 24HR: Total annual electricity consumption of commercial & industrial customers on 24-hour tariff
- kWh dg56 day: Total annual electricity consumption of commercial & industrial customers on day/night tariff
When this formula is applied to the fleet of 250,000 transformers, a distribution of results is shown in Figure 7. The proportion of transformers estimated to be overloaded is very small (2%). The results of this estimate are used along with data on EV purchases and affluency in the local area to identify units to monitor. In total 1,003 transformers were identified to monitor, and 821 monitors (136 Pole Mounted and 685 Ground Mounted) were installed to gather current and temperature data for the 2021 Winter Peak. As a first proof of concept, 91 of these were installed in 2020, therefore contain data for an entire year.
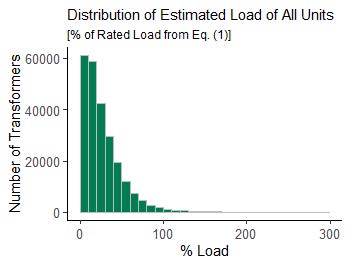
Figure 7 - Distribution of estimated load (kVA) for all units
3. Monitoring solution
An investigation was completed into suitable technologies to employ to monitor a sample number of transformers. When specifying the device, we had many, sometimes competing, criteria. It was decided that the device had to be capable of measuring the current and surface temperature of the transformer. It had to be capable of transmitting the data back to a server. It also had to be quick and easy to install safely. We quickly discounted using traditional CTs to measure the current due to safety concerns with potential open circuit voltages, the installation time, and the fact that an outage would be required. We also wanted to avoid devices which required connection to a local LV power source. The device we eventually selected was manufactured specifically for our defined needs and set criteria. It was a battery powered device, with a long-life battery, which would last for over 7 years. Current measurement was done using Rogowski coils. The device was attached magnetically using very strong Neodymium magnets, thus eliminating the requirement to use power tools to affix the device, which meant that the device can be attached instantly. The device measures each current and the temperature every 60 seconds and transmits two readings for each current and temperature every hour. The first reading is an average of the previous 60 readings and the other is the maximum recorded value of those readings. The transmission medium is a low power secure radio service in the 868 MHz band, which has good national coverage. Figure 8 shows an example of an installation on a 200 kVA Pole Mounted Transformer.
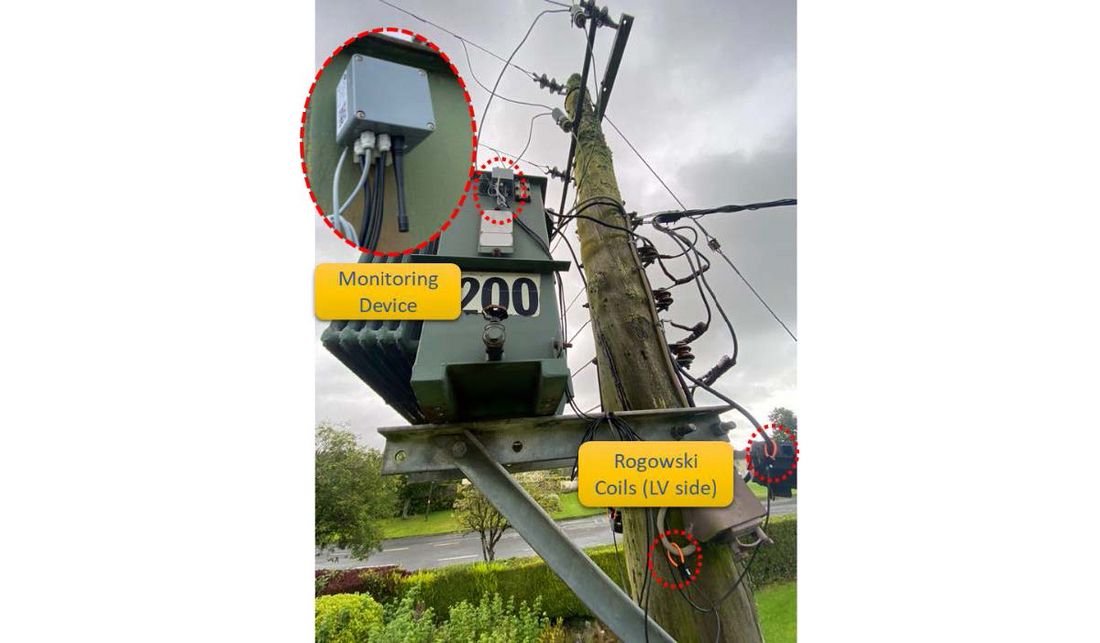
Figure 8 - Example of Installation
3.1. IT architecture and processes
A visualisation of the data flow is shown in Figure 9. The monitors communicate data at hourly intervals to a vendor platform. The vendor provides an API to allow data to be read into a central system using Microsoft Azure Data Factory and SQL Server. Weather data is also processed daily to allow the inclusion of local temperature in analysis. This allows the data to be visualised and analysed using Microsoft Power BI software, in a near real time fashion. The data can be combined with other data sets to aid analysis, e.g. kWh consumption, EV charging grant data, geospatial data of local area, and more.
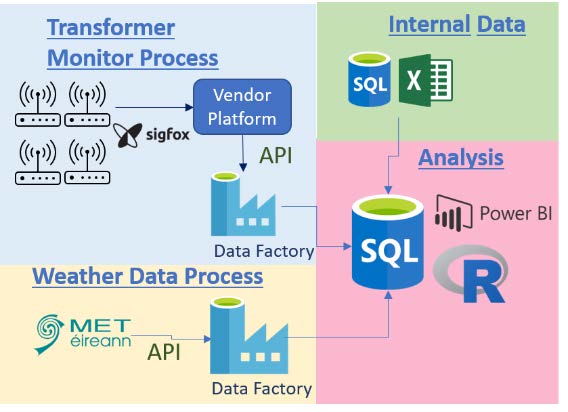
Figure 9 - IT Processes
4. Anlaysis
In this section we discuss how we have used, and visualised, the data to gain greater insight on the LV system and our key findings to date on this work.
4.1. Dashboard visualisation
Data is integrated and made available to stakeholders in a Power BI dashboard which has near real time data. Screenshots of an overview page and a transformer detail page are shown in Figure 10. This dashboard allows the user to analyse monitoring data to identify highly loaded transformers. It also applies the model detailed in Section 2 to allow the user to identify potentially highly loaded units where the installation of monitors should be considered.
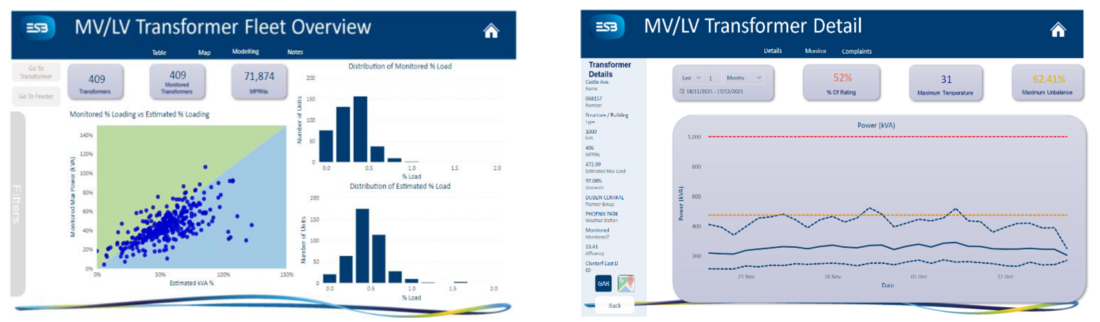
Figure 10 - Screenshots of Dashboard developed
4.2. Statistical analysis
R statistical programming language was used to analyse data in this section.
4.2.1. Validation of load estimation
The following analysis is based on the results obtained from 770 monitored 3-phase transformers. The distribution of maximum load reached for the winter of 2021 (percentage of rated load) for all transformers is shown in Figure 11. This indicates that at this stage there is reasonable available capacity on MV/LV transformers, especially considering the concerted effort made to identify and monitor transformers likely to be highly loaded. Of these transformers, 16 (2%) exceeded their rated load in the period of monitoring.
As this distribution is approximately normal, statistical inferences may be made about the population (approximately 40,000 3-phase transformers). The sample has mean of 0.49 and standard deviation of 0.2. A 95% confidence interval for the mean of this distribution is calculated as follows:
A 95% prediction interval for the maximum load of a 3-phase transformer selected using defined criteria may be calculated as
This indicates that a 3-phase transformer selected from the population using these criteria will have a maximum load of between 9% and 89% with 95% confidence.
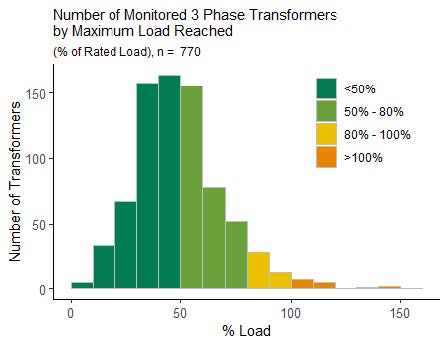
Figure 11 - Distribution of Maximum Load for monitored 3 phase transformers
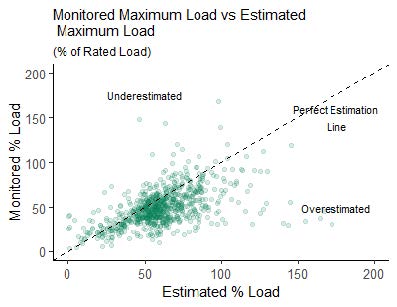
Figure 12 - Monitored maximum load vs the estimated maximum load for 618 3 phase transformers
The monitored results may be compared with the maximum load estimate described in Section 2. A scatter plot of the monitored maximum load vs the estimated maximum load for each transformer is shown in Figure 12, indicating some overestimation of load by Equation (1).
Root Mean Square Error (RMSE) is a metric which can be used to quantify the accuracy of the initial estimates by comparing them to maximum monitored load. When calculated for all monitored 3-phase units, the RMSE is 0.25. This is a reasonably good first estimate but could be improved upon with data-based models.
4.2.2. Improvement of load estimation
A regression model is computed to improve upon the estimate model described in Section 2 to allow us to accurately predict load for non-monitored 3-phase transformers based on customer kWh consumption data.
The following model is obtained:
A second model was developed to account for apparent non-linearity in the data as the total GWh increases. This model included a polynomial term to account for this.
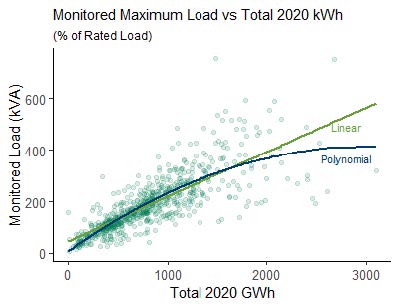
Figure 13 - Regression Models
Both regression lines are shown in Figure 13. The linear model has RMSE of 0.17 and the polynomial model has RMSE of 0.15, both improvements on the initial estimates.
4.2.3. ADMD estimation
In traditional LV design, a value of 2.5 kW per domestic connection after diversification (After Diversity Maximum Demand (ADMD)) is assumed. However, as LCT uptake increases it will become necessary to adjust this key assumption. The monitor data obtained in this work, may be used to verify the current design assumption of 2.5 kW and be the basis for adjustments in respect of future design considerations.
For this section, the dataset is filtered to only include monitored units with domestic Maximum Import Capacity (MIC) greater than 90% of total MIC and with greater than 20 customers, totalling 403 units. The maximum load divided by the number of customers can be calculated for each transformer to give the ADMD value. A histogram of the ADMD values for the 403 transformers is shown in Figure 14. A 95% confidence interval can be computed for mean ADMD based on the data. This is computed as
A 95% prediction interval can also be calculated as
This can be interpreted as a randomly selected domestic customer will have ADMD of between 0.17 and 2.18 with 95% confidence. It should be noted that this finding is based upon a relatively mild winter of 2021. A severe winter weather event could cause this value to be higher and the DSO must design for the worst case scenario.
Figure 15 shows the hourly ADMD for each transformer, showing the peak ADMD occurs between 6:00pm and 7:00pm. A notable unit is also highlighted in red which is discussed in Section 4.2.4.
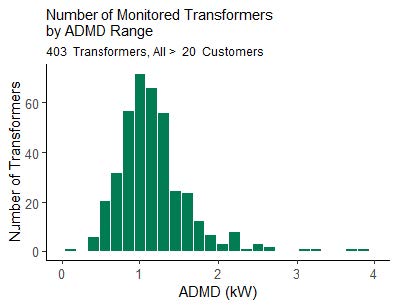
Figure 14 - ADMD Distribution
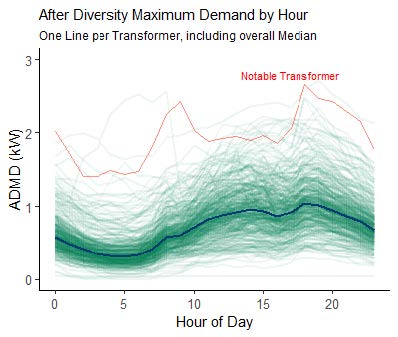
Figure 15 - Hourly ADMD for each Transformer
4.2.4. Case study of LCT impact on ADMD of an individual transformer
The highlighted transformer in Figure 15 is in a new housing estate. The estate has a large penetration of rooftop PV, heat pumps and several electric vehicles. The transformer is a 400 kVA unit with 169 connected customers, almost entirely domestic. Of the 169 connected customers, 13 are known to have BEVs or PHEVs. It has reached a peak load of 425 kVA (106% of rated load). This is equivalent to an ADMD of 2.5 kVA per customer, far exceeding the mean ADMD of 1.18 kVA found in the fleet of monitored units. This demonstrates the challenge presented by low carbon technology uptake. Also notable is the presence of a morning peak almost equivalent in magnitude to the evening peak, demonstrating again how traditional LV design assumptions are now being challenged.
4.2.5. Load factor
The load factor can be calculated for each transformer as follows:
When the load factor is calculated for all transformers the distribution of results is plotted in Figure 16.
The load factor results have a mean of 0.5 and a standard deviation of 0.1. A 95% prediction interval may be calculated as follows:
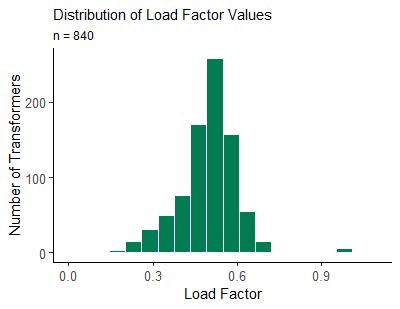
Figure 16 - Load Factor Distribution
Therefore, if a transformer is selected at random from the population, there is a 95% probability that the load factor will be between 0.29 and 0.7. The mean value of 0.5 is in agreement with the assumption made in Section 2.
4.2.6. Seasonal load variation
In winter 2020, 91 transformer monitors were installed and therefore have over a year of data. This allows the load pattern for the entire year to be analysed. Figure 17 shows a boxplot of maximum percentage of rated load for each month for these 91 transformers. July has the lowest median maximum load (31%) and January has the highest (58%).
As a rule of thumb, maximum winter load for a transformer in Ireland may be estimated by doubling the peak load in July. This is demonstrated in Figure 18 where the maximum load in January 2021 for each transformer is plotted vs the maximum load in July 2021 along with a linear regression line.
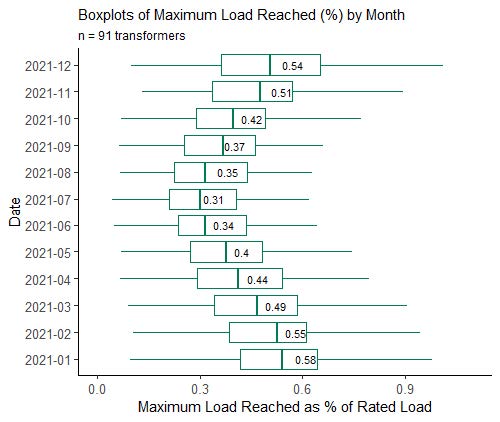
Figure 17 - Boxplot of maximum load reached per month
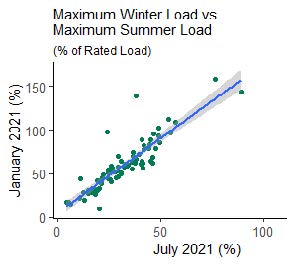
Figure 18 - Winter Peak Load vs Summer Peak Load
4.2.7. Temperature modelling
The relationship between load and temperature has been investigated. Figure 19 shows the temperature above local ambient versus the load for the previous hour of each unit for the month of November, for the 16 most highly loaded units (each point is an hourly reading). Each unit has a specific pattern – the more “circular” plots are Ground Mounted Transformers, whereas the “flatter” plots are Pole Mounted which have better cooling performance. The lag between load and temperature is clear, particularly in unit 281013.
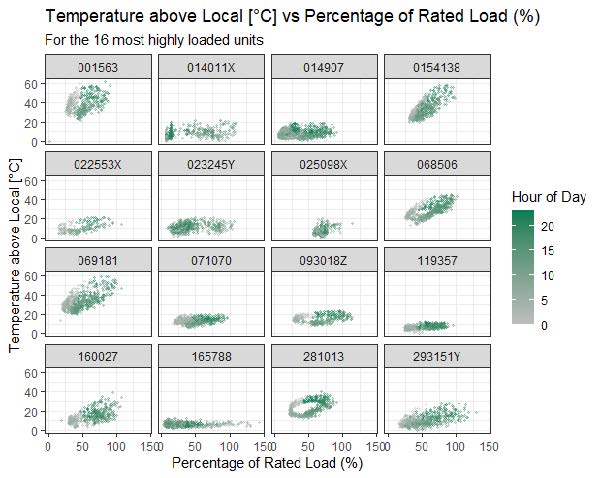
Figure 19 - Temperature above Local vs Load for 16 highly loaded transformers
Figure 20 shows R2 values for linear regressions of temperature above local versus the mean load for the preceding number of hours, which is varied. The best models for Ground Mounted Transformers are with the mean of the preceding 9 or 10 hours of load and the R2 values are very good. For Pole Mounted Transformers, a shorter window seems more appropriate, for example 5 or 6 hours, and the load is a less good predictor than for kiosk substations. Figure 21 shows the same transformer temperatures, plotted versus the mean load for the preceding 8 hours. The relationship is much more linear and the regression model for each is also plotted.
The following conclusions may be made from this analysis:
- Ground Mounted Transformers are much more prone to heating from increasing load than pole mounted transformers
- For Ground Mounted Transformers, the best predictor of current temperature is the mean of the load for the previous 9 hours, whereas for Pole Mounted it is a much shorter period
- From the plots produced it appears that a general model to cover all transformers may not be suitable.
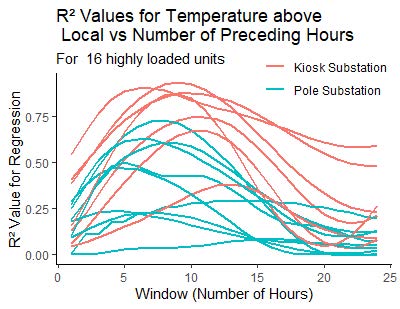
Figure 20 - R 2 values for varying window length
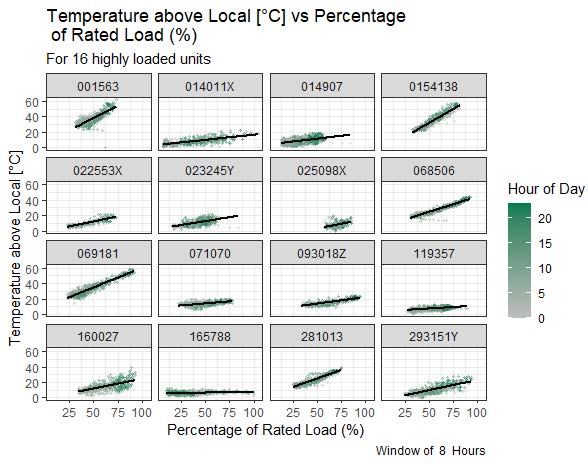
Figure 21 - Temperature above Local vs Mean Load for 16 highly loaded transformers
5. Conclusion
Through this work ESB Networks has gained valuable insight on the capacity of the transformers on the LV network in Ireland. While, at present, the LV network transformer capacity is sufficient to meet demand, the influx and uptake of LCT solutions are having an impact on our infrastructure and this impact will increase significantly over the coming years. This now necessitates changes in the way we look at and approach LV network design.
Our case study in Section 4.2.4 illustrates the impact that LCTs can have on our network with a mean ADMD 2.5 times that of the mean of the rest of our transformer asset base.
The following are the key findings from analysis detailed in Section 4 of this paper:
- Approximately 2% of transformers (5,211) are estimated to be overloaded.
- 16 of the monitored 3-phase transformers (2%) exceeded their rated load. These transformers may be identified by using a Power BI dashboard, and are located primarily (but not exclusively) in urban areas.
- A RMSE value of 0.15 was achieved when the monitored load was estimated from the 2020 kWh values using a polynomial regression model, an improvement from the value of 0.25 achieved with the original estimation.
- Average maximum load achieved for MV/LV transformers monitored is 49% of rated load. A transformer selected at random from the fleet of 3-phase units will have maximum loading between 9% and 89% (95% confidence).
- Mean load factor of the monitored transformers is 0.5. A transformer selected from the population at random will have load factor between 0.29 and 0.7 (95% confidence).
- Highest load occurs in January and is typically double that of July peak load.
- Temperature of Ground Mounted units is more effected by high load than in Pole Mounted units.
- The best indicator of a Ground Mounted units’ current temperature above ambient is the mean load for the previous 9 hours. For Pole Mounted it is 5 hours, although the relationship is seen to be more variable.
The above conclusions will facilitate more accurate load modelling in future and give valuable insights into the LV network that were previously unknown. The work described in this paper will facilitate ESB Networks in proactively ensuring LV readiness for LCT. The findings will be used to inform strategy on LV Network reinforcement from 2022, e.g. transformer uprating and network regrouping.
Currently we are focused on understanding the effect of Electric Vehicles on the LV Network in Ireland, however, we next need to consider the impact electrification of heat will have on our LV network. As Heat Pumps take a more prevalent position in the market, they will also impact on demand and have additional impact on the distribution system in conjunction with the already established and increasing load due to EVs.
Future work should consider improving on the work around temperature monitoring in relation to load and local weather conditions. Future work could also consider improvement on the load estimation model by different statistical techniques.
We have demonstrated that through monitoring and data analysis we can achieve a much more detailed understanding of our network. ESB Networks will use this for optimal asset investment in the future to enable and provide for a lower carbon society.
References
- Government of Ireland “Climate Action Plan 2019”
- ESB Networks, “Electrification of Heat and Transport Strategy” (2020)
- Society of the Irish Motor Industry, “National Vehicle Statistics”, (2022)
- Central Statistics Office, “TEM 12, New Vehicles Licensed for the First Time”, (2022)
- Reuters, “Electrified cars hit almost a fifth of EU Q3 vehicle sales” (October 2021)
- Sustainable Energy Authority of Ireland “Electric Vehicle Grants”, (2021)