B2 - Latest Design Standard on Structures for Overhead Transmission Lines in Japan
Authors
Y. KITANO, S. SUGIMOTO, Y. SATO, H. MATSUMIYA, N. SODA, Y. HATTORI, Y. SHIBA, T. ISHIKAWA - Central Research Institute of Electric Power Industry, Japan
S. HATAKEYAMA - Tohoku Electric Power Network Co., Inc., Japan
T. OSONO, M. YAMAZAKI, K. KURITA - TEPCO Power Grid, Inc., Japan
H. SHIGEMOTO - Kansai Transmission and Distribution, Inc., Japan
T. KITASHIMA - Furukawa Electric Power Systems, Co., Ltd., Japan
T. OHKUMA - Kanagawa University, Japan

Summary
Overhead transmission lines in Japan are exposed to natural disasters such as strong winds, heavy snow accretions, and huge earthquakes. The Japanese Electrotechnical Committee has published design standards on structures for transmissions, namely “JEC-127,” whose last edition was published in 1979. Since 1979, several disasters on transmission lines have occurred, which indicate the need to revise JEC-127-1979. Thus, transmission system operators and their research institute have made efforts to establish a new design method that could rationally estimate loads and strength of structures. In 2015, reflecting the outcome from these efforts, the committee published the technical report “JEC-TR-00007” (JEC-TR hereafter) as the expected revised version of JEC-127-1979. JEC-TR introduces a limit state design method and describes new equivalent static load methods. However, JEC-TR still has technical limitations in evaluating natural forces at construction sites and applying them to designs. Therefore, designers need a large amount of investigation to estimate natural forces, or employ too much conservative forces. As a result of further research, the committee has resolved the problems, and JEC-TR is expected to be standardized as JEC-5101. This report introduces the technical basis for Japan’s new design standard JEC-5101 focusing on the main changes compared to JEC-TR as follows:
- Directional wind load and new directional basic wind speed maps
JEC-TR and JEC-5101 employ the “directional” equivalent static wind load method applicable to arbitrary wind directions and stringing conditions. To estimate directional wind speeds, we developed new directional wind speed maps using observations and a long-term meteorological simulation.
- Developments of Snow accretion model, snow load map, and method to combine ice and wind loads
Using a new reliable snow accretion model and the peak-over-threshold method, we created a new snow load map that is consistent with meteorological features in Japan. Furthermore, we also developed a method to calculate snow accretion load combined with comparatively weak wind.
- Accuracy improvement of layer shear force coefficient method
JEC-TR is based on the layer shear force coefficient method that is originally employed for ultra-high-voltage transmission towers, but it has remarkable biases for general transmission towers. By introducing effects of secondary natural frequencies of structures and acceleration response spectra of seismic motions, we developed new coefficients that appropriately agree with dynamic analysis
Keywords
Overhead Transmission Lines - Wind Resistant Design - Equivalent Static Wind Load - Basic Wind Speed Map - Snow Resistant Design - Wet-Snow Accretion - Snow Load Map - Seismic Resistant Design - Layer Shear Force Coefficient Method1. Introduction
Overhead transmission lines in Japan are exposed to severe natural disasters such as very strong winds caused by typhoons, heavy ice/snow accretions in winter, and huge earthquakes. The Japanese Electrotechnical Committee (JEC) has presented structural design methods such as the JEC standard "Design standard on Structures for Transmissions" since 1926, whose last edition was published in 1979. Since 1979, several natural disasters on transmissions have occurred (see Table I), which indicate the need to revise JEC-127-1979. Thus, transmission system operators (TSOs) and their research institute in Japan have made efforts to establish a new design method reflecting the experience gained from damage/failure on overhead lines, and the latest in academic knowledge. In 2015, reflecting the outcome from these efforts, the committee published the technical report “JEC-TR-00007” (JEC-TR hereafter) as the expected revised version of JEC-127. JEC-TR introduces a limit state design method and describes new equivalent static load methods for transmission towers. However, JEC-TR still has technical limitations in evaluating natural forces at construction sites and applying them to designs. Therefore, designers need to estimate natural forces with great labor, or to employ too much conservative load values. Subsequently, in 2017, the Overhead Transmission Line Standardization Committee at the JEC established a new special committee (SC hereafter) to revise the JEC-TR and make it an official JEC standard by resolving the remaining challenges. As a result, the SC has already resolved all the challenges mentioned and new standard JEC-5101 will be published soon. This paper presents new standard JEC-5101 and its technical basis focusing on the main changes compared to JEC-TR. Note that JEC-TR and JEC-5101 show the verification method for damage limit states in detail. The basic value of the load is for a 50-year return period and return period conversion factors are also provided.
| Year | JEC publications / Natural disasters | Remarks (tower collapse/damage) |
|---|---|---|
1979 | JEC-127-1979 published |
|
1980 | 55-Gosetsu (wet-snow accretion in Tohoku district) | 62 collapses |
1986 | 61-Gosetsu (wet-snow accretion around Kanto-metropolitan area) | 8 collapses |
1991 | Typhoon Mireille (strong wind in Chugoku, Shikoku and Kyusyu districts) | 36 collapses |
1993 | Typhoon Yancy (strong wind in Shikoku and Kyusyu districts) | 19 collapses |
1995 | Great Hanshin-Awaji Earthquake (magnitude 7.3) | 1 collapse by landslide |
1999 | Typhoon Bart (strong wind in Kyusyu district) | 13 collapses |
2002 | Typhoon Higos (strong wind in Kanto district) | 9 collapses and damages |
2011 | Great East Japan Earthquake (magnitude 9.0) | 1 collapse by landslide |
2015 | JEC-TR-00007 (technical report) published |
|
2019 | Typhoon Faxai (strong wind in Kanto district) | 2 collapses |
2. Wind resistant design and new directional basic wind speed maps
2.1. Introduction
JEC-TR adopted a state-of-the-art wind resistant design method developed by a previous committee. This committee had been set up for over a dozen years since 1992 after severe damage to Overhead lines (OHLs) caused by Typhoon Mireille and a downslope windstorm named Yamaji-kaze in 1991, and consists of TSOs, researchers, and academic experts in Japan. The method is characterized by “directional” wind resistant design considering environmental conditions in Japan. The extreme wind climate in Japan is mainly caused by typhoons and monsoons of high- and low-temperature seasons, and each meteorological phenomenon has dominant wind directions. Furthermore, a substantial proportion of land in Japan is covered by complicated mountainous terrains, which yield acceleration rates by topography, generally depending on the wind direction. Notably, the wind loads acting on transmission towers vary rapidly with wind direction because of the structural characteristics. Therefore, the application of non-directional wind speed to the design may result in overestimation. Based on this background, a directional wind-resistant design method was proposed in JEC-TR.
Here, we explain the outline of the directional wind-resistant design method in JEC-TR [1]. To consider the wind dynamic effects, JEC-TR adopted the equivalent static wind load method by gust effect factors [2]. The unique idea, which is not introduced in standards of the International Electrotechnical Commission (IEC) and American Society of Civil Engineers (ASCE), is to elaborate formulae applicable to arbitrary wind directions and stringing conditions with similar accuracies. In other words, the JEC-TR method can estimate each sub-system wind load (wind force on tower, overhead wire and insulator, and tension force) for arbitrary wind directions and their combination by the formulae of non-simultaneity of fluctuating components. To achieve this, JEC-TR provides elaborate formulae for tension forces and non-simultaneity reduction coefficients theoretically introduced by correlation coefficients of the fluctuating components between forward and backward spans, which are not clearly shown in IEC and ASCE standards. Fig. 1 shows the schematics of the JEC-TR method. Designers first set 72 wind directions with a 5º-pitch (Fig. 1 (a)); thereafter, the mean and fluctuating components of each sub-system wind load are estimated (Fig. 1 (b)). Finally, transverse and longitudinal loads are calculated as the sum of the mean and fluctuating components multiplied by the non-simultaneity reduction coefficient (Fig. 1 (c)) to assess various wind loads for each wind direction. The method described above is also employed in JEC-5101.
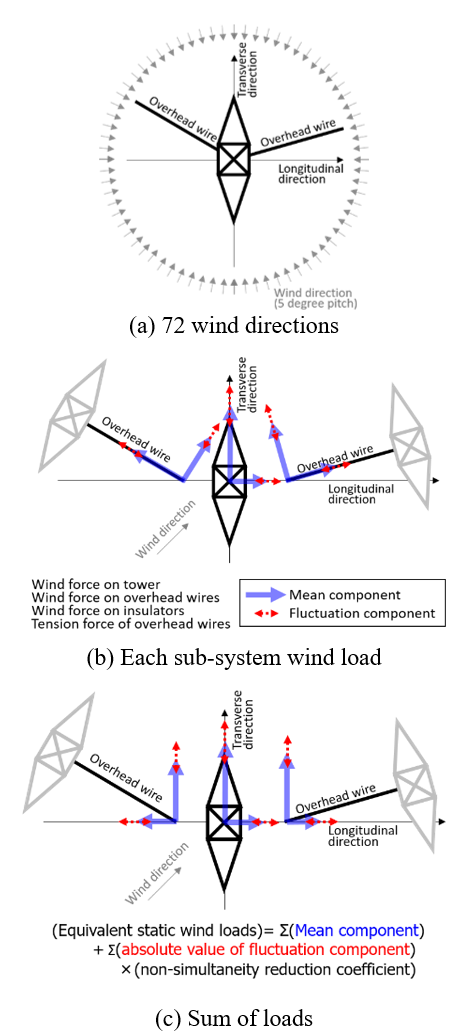
Figure 1 - Schematics of the wind resistant design method in JEC-TR
However, JEC-TR still has a technical problem in estimating directional wind speed values at a construction point. To address this problem, we developed new directional basic wind speed maps, including geographical effects of large-scale terrains and frequencies, and intensities of meteorological phenomena. In this chapter, we explain the definition, procedure, and features of the new directional basic wind speed maps [3] introduced in JEC-5101. In Section 2.2, the definition of directional basic wind speeds is introduced; in Section 2.3, we describe the procedure for drawing maps; and in Section 2.4, we explain the features of the new maps.
2.2. Definition of basic wind speeds
The directional basic wind speed in JEC-5101 is defined by a 150-year return period value of 10-min mean wind speed at 10 m above the ground in surface roughness category II (similar to terrain category B in IEC), which represents an extreme wind speed in an area of approximately 5 km × 5km. The basic wind speed is separately shown in eight directional sectors (N, NE, …, NW) and seasonal sectors (a high-temperature season from April to November dominated by typhoons, and a low-temperature season from December to March dominated by winter monsoons). The 150-year return period is determined by parametric calculations to maintain a probability of less than 0.02 [4]. This probability corresponds to a 50-year return period regarding the failure of structures. To calculate directional design wind speeds, designers interpolate eight-directional wind speeds to 72 directions and multiply basic wind speeds using coefficients of local terrain and topographic effects.
2.3. Procedures to make new directional basic wind speed maps
This section presents procedures for creating new directional basic wind speed maps [5]. An overview of the procedures is as follows: First, we obtained directional basic wind speeds at approximately 150 ground observation sites installed by the Japan Meteorological Agency. Second, we created spatial distributions of return period values using a long-term 5 km grid spacing meteorological database [6]. Finally, we modified the bias of the spatial distributions of the return period value using observational basic wind speeds. Consequently, we obtained the directional basic wind speed maps. Because of space limitations, we introduce here procedures only in the high-temperature season sector.
To calculate the directional basic wind speeds from quality controlled ground observation data that contain the influence of local terrains, we adjusted the wind speeds to equivalent values for roughness category II at 10 m above the ground, which do not contain local accelerations and decelerations by topographies near observation sites, and estimated the return period values. We evaluated roughness categories on sites utilizing land use mesh data published by the National Geographical Institute of Japan. Considering the vertical distributions of the on-site roughness categories, we estimated the upper wind speeds. From the upper wind speeds, equivalent values at 10 m above the ground were estimated by the vertical distribution of category II. We eliminated local topographic acceleration or deceleration effects by utilizing diagrams of the speed-up ratio [7] or an engineering model of computational fluid dynamics simulation [8]. To enhance the reliability of the maps, we conservatively evaluated the deceleration ratios at frequent occurrence areas of typhoon extreme winds near the Pacific coast. Finally, we estimated the return period values using Gumbel’s method of extreme statistics. For accurate probability estimates, we adopted a separate analysis of typhoon and non-typhoon wind speeds [9]. However, significantly severe typhoons are statistically rare events, and directional wind speed data contain statistical uncertainties. Thereafter, we produced large samples of wind data through “typhoon simulation” using a Monte Carlo technique [10]. Consequently, we achieved reliable directional basic wind speeds at the observation sites.
Next, we produced spatial distributions of return period values for interpolation between observation sites using a long-term 5 km grid spacing meteorological database named CRRCMEr2. CRRCMEr2 is a numerical weather simulation product in Japan from September 1957 to August 2019, calculated by the regional climate model NuWFAS-RCM, which is based on the weather research and forecasting (WRF) model [11]. Global reanalyses ERA40 [12] and ERA-Interim [13] were used for the initial and lateral boundary conditions. Fig. 2 shows the simulated wind velocity distributions by Typhoon Mireille in 1991. In Fig. 2 (a), we can confirm a vortex-like wind velocity distribution near the center of the typhoon. Over Shikoku Island, the wind direction is mainly south, and wind speeds higher than 25 m/s are observed in the northern part. Fig. 2 (b) shows the wind velocity distribution on a vertical cross section (see the line section indicated in Fig. 2 (a)). We recognize a typical downslope wind characterized by a downward velocity on the lee side [14]. These results demonstrate that CRRCMEr2 adequately reproduces the horizontal distributions of extreme winds caused by meteorological phenomena and complicated topographies in Japan. We confirmed that extreme wind speeds have bias, particularly near the center of strong typhoons (not shown). By utilizing CRRCMEr2, we produced spatial distributions of return period values on a 5-km grid spacing using extreme statistics.
Finally, we modified the biases of the spatial distributions of the return period value estimated by CRRCMEr2 using observational basic wind speeds. At the observation points, we assessed the biases of return period values calculated by CRRCMEr2. By interpolating biases at observation points, we obtained bias distributions for a 5-km grid spacing. By subtracting the bias distributions from the extreme wind speed distributions, we obtained directional basic wind speed maps.
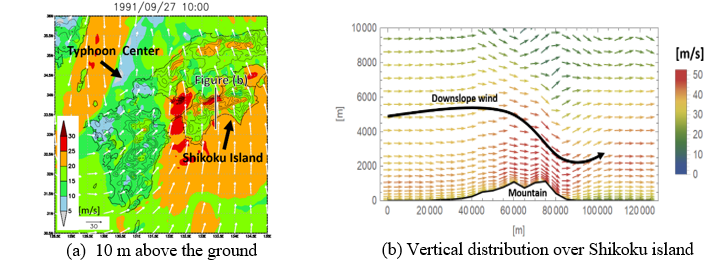
Figure 2 - Wind velocities in CRRCMEr2 (Typhoon Mireille in 1991)
2.4. Characteristics of new directional basic wind speed maps
Fig. 3 (a) shows the maximum basic wind speed for all directional sectors. Strong winds caused by typhoons result in high wind speeds near the Pacific coast over southern Japan. Furthermore, we can find high wind speeds over inland regions, which are mainly located on the top or leeward side of mountains. Fig. 3 (b) shows the eight-directional wind speed maps over Shikoku Island. The main wind directions of the downslope windstorm over the northern area are referred to as SE and S. We can recognize that the effects of downslope windstorm accelerations are reflected only in maps of SE and S. This result demonstrates that the characteristics of wind speed and direction caused by regional meteorological and topographic accelerations are effectively reflected in the maps.
In this section, we present new directional wind speed maps that contain regional meteorological and topographic wind effects. These maps and JEC-5101 enable designers to conduct rational wind-resistant design considering the directional characteristics at constriction points.
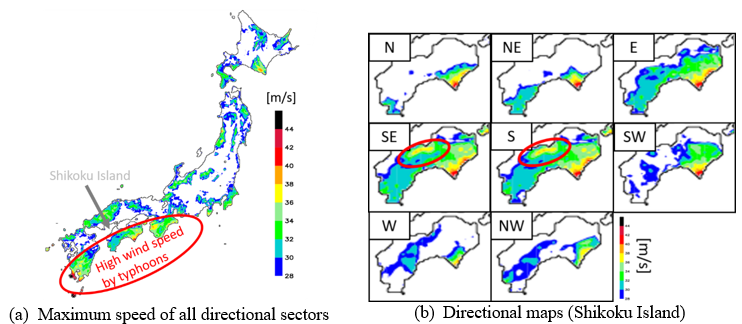
Figure 3 - Examples of directional basic wind speed maps (warm season)
3. Resistant design for snow loads
3.1. Background
In Japan, we have experienced a number of serious snow disasters, which resulted in the collapse of transmission towers. In particular, after a disaster occurred around Kanto metropolitan area in 1986, each TSO in Japan has considered the reinforcement of existing towers to increase the resistance to heavy snow accretion as well as develop anti-snow accretion countermeasures. Such efforts considerably reduce the risk.
However, the snow load, wind load, and their combination are experience-based to a large extent. The design ice load is assumed to correspond to the extreme radial ice thickness having a 50-year return period in JEC-127-1979 and JEC-TR. Essentially, snow load maps were provided for dry and wet snow accretion in JEC-127-1979, but no extreme statistical analysis was performed with continuous icing data. Pioneering works in the 1990s [15] resulted in the development of a practical snow accretion model, which has the potential to create reliable icing data. Although comprehensive results about their snow accretion model are described in JEC-TR, no attempt was made to generate a snow load map, because their model still requires improved quantitative accuracy. Regarding the wind load to be combined in icing conditions, examinations of icing data are required to grasp the statistical features.
Atmospheric icing can be generally classified into precipitation icing, in-cloud icing, and hoar frost [16–18]. The third process, where water vapor is transformed directly into the ice phase, leads to no significant loading. Therefore, many standards treat precipitation icing and in-cloud icing [17, 18], and the treatment in JEC-TR is the same. The less important load is neglected. In our country, in-cloud icing events have occurred in limited mountainous areas at higher elevations, and notable freezing rain (glaze or rime) events have been observed at in-land valleys. When revising JEC-TR, the fact that most of the significant disasters due to atmospheric icing have been associated with wet snow accretion made us dedicate our elaborations to overcoming challenges related to the generation of a snow load map and also the examination of wind load to be combined.
The design snow load is specified as the extreme of the equivalent radial thickness over a conductor corresponding to a 50-year return period in JEC-5101. The reference radial thickness is defined as the thickness estimated from the weight per unit length assuming a density of 600 kg/m3. This design snow load can be reduced by anti-icing techniques and countermeasures including anti-snow ring, counterweight, and interphase spacer. No correction of the design load is recommended for safety.
In the following sub-sections, we will describe the methods of generating a snow load map with a snow accretion model and estimating the wind loads.
3.2. Snow accretion model
With a lack of observational icing data, the approach of the use of a snow accretion model was adopted to create the long-term icing dataset in JEC-5101. Thus, in the revision process of JEC-TR, a very important task was to develop a reliable snow accretion model. Attempts have been made for understanding snow accretion on overhead power lines during the last 15 years under the collaborations of all TSOs and their research institute. Observing systems were installed at full-scale power line systems including energized systems in operation, and a simplified but generalized snow accretion model has been developed by us based on the observational facts and findings.
This model is based on a well-known cylindrical accretion model [15, 19]. In European countries, this type of model is utilized to generate a snow load map [20–22]. A precipitation type identification method, which is based on the physical theory of melting snowflakes [23], is introduced in our model. As this enables the model to classify the type of snow accretion from the category of the wind speed and the type of precipitation [24], the model can be applied to both wet- and dry-type snow accretion with meteorological inputs of the precipitation amount, temperature, relative humidity, and wind velocity and direction. This is a considerable advantage, because limiting wet or dry types is not required when considering a snow load map.
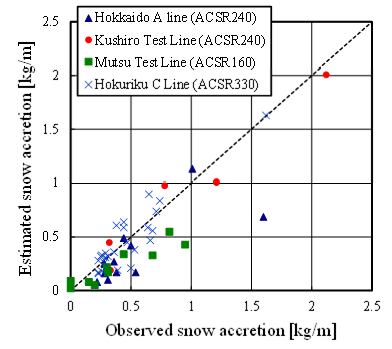
Figure 4 - Comparison between observed and estimated snow acretion.
In our model, the sticking efficiency and the density of the cylindrical snow deposit are parameterized according to the type of snow accretion classified. In particular, the sticking efficiency depends on the liquid water content (LWC) of snowflakes and the wind speed. The LWC is estimated by a physical melting model [25] in each time step with the help of a long-term 0ºC-height data reproduced by downscaling with the WRF model. Although the sticking efficiency is basically estimated from the result of precipitation type identification, it is set to zero if the LWC reaches over 30%.
This physically-based snow accretion model has been verified using field observation data at full-scale transmission line systems (Fig. 4). Overall, our model works well for both types of snow accretion, whereas a traditional model [19] tends to underestimation (not shown), which suggests that the sticking efficiency estimated only from the wind velocity may be erroneous. The potential of our model was verified by applying it to past severe events resulting in the collapse of transmission towers.
3.3. Generation of a snow load map
The use of a numerical weather prediction (NWP) model can create a high-resolution meteorological input for a snow accretion model. Generally, the accuracy of an advanced NWP model is still not sufficient to couple with a snow accretion model, particularly for precipitation amount and temperature under icing conditions. In the generation of a snow load map, the snow accretion model developed was firstly applied to observational data available at approximately 760 stations managed by Japan Meteorological Agency. The long-term icing data were created for each station by simulating snow accretion for three types of conductors with different diameters. Such icing data include meteorological inputs, snow accretion, and the density of snow deposits at 10-min intervals during more than 40 years.
Snow accretion on a conductor depends on the line direction, altitude above the ground level (AGL), and roughness (land use). The above simulation was performed for different four directions and 15 levels (10 m to 150 m AGL). The wind velocity at each level was calculated assuming category II of roughness. The extreme value analysis was performed using the peak-over-threshold (POT) method as the second step. This involved fitting the generalized Pareto distribution to data point exceeding a chosen threshold in icing data. The extreme of snow accretion corresponding to the specified return period of 50 years can be estimated for each conductor, each line direction, and each AGL. Based on the result of the extreme analysis for all stations, a simple spatial interpolation was performed to generate a map with the longitudinal and latitudinal resolutions of 0.05º without a correction factor related to land elevation. Then, the maximum of the extreme for each mesh of a map can be obtained from the extremes estimated for different levels and line directions.
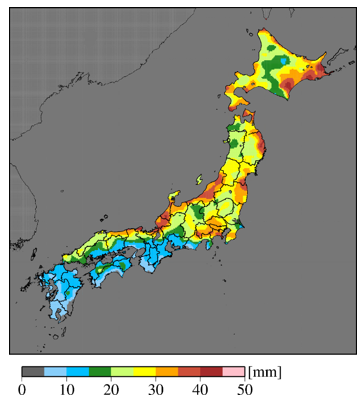
Figure 5 - Estimated snow loads considering a 50-year return period
At the final step, the spatial distribution of snow accretion extreme for each conductor was transformed to the one of the equivalent radial thicknesses of snow deposits assuming a density of 600 kg/m³. The equivalent radial thickness with the 50-year return period was found at each mesh by adopting the maximum among the extremes for three different conductors. Fig. 5 shows snow loads covering Japan. The dependence of latitude can be easily understood. The frequent occurrence of heavy wet snow accretion in areas near the coastline tends to result in a higher value. In in-land mountainous areas, dry snow accretion tends to occur, resulting in lower values.
3.4. Combination of ice and wind loads
The wind loads under icing conditions are determined assuming equivalent static loads that can estimate the maximum responses under the dynamic loads. A statistical analysis of the wind velocity during icing conditions was performed using icing data to find the wind velocity corresponding to selected reliability levels. Fig. 6 shows the relationship between the wind velocity and the radial thickness of the cylindrical snow deposit. The 10-min averaged wind speed at 10 m above the ground level assuming category II of roughness was considered. Each quantile of the wind velocity is correlated with the radial thickness. An envelope (red dashed line in Fig. 6) was estimated, almost covering the 90th percentile.
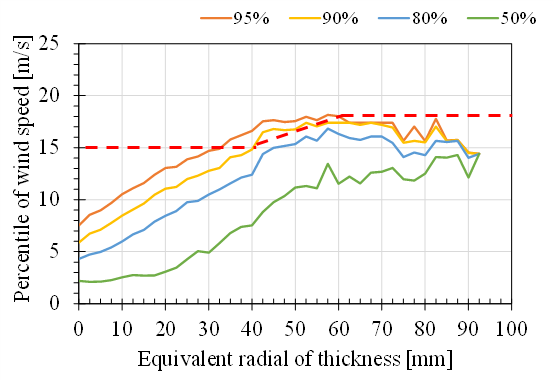
Figure 6 - Percentile of the wind speed under icing conditions
In JEC-5101, the basic wind velocity to calculate the combined loadings is estimated using this envelop as a function of the radial thickness. Introduction of this function is a remarkable point of JEC-5101 because constant wind speeds are generally used for icing condition; for example, other standards (IEC, ISO) [17, 18] use the averaged wind speed or a specified shorter return period (i.e., 3-year) of the wind speed based on Turkstra’s rule.
The contribution of wire resonance to dynamic loads is not neglected under weak winds. For instance, higher turbulence intensity can lead to higher aerodynamic non-linearity and higher structural non-linearity. The gust factor becomes greater than the value based on the quasi-static response caused by wind turbulence. A time history response analysis of overhead wires suggested that a simple method to add the increment of the wind velocity to consider those nonlinear effects is possible [26]. In JEC-5101, an increment of 2 m/s was added to the basic wind speed, used in estimating design wind loads under icing conditions.
4. Layer shear force coefficient method for seismic designs
4.1. Technical problem of layer shear force coefficient method in JEC-TR
JEC-TR newly introduced a seismic design method considering growing concerns to large earthquakes after the Great Hanshin-Awaji Earthquake in 1995 and the Great East Japan Earthquake in 2011. The seismic design method is based on the “layer shear force coefficient method” originally developed for ultra-high-voltage (UHV) transmission lines in Japan. In other words, the JEC-TR method is an application of the modified seismic coefficient method suitable for general transmission towers. In this method, peak ground accelerations at construction points are calculated by multiplying on-site acceleration values from a map and local ground type coefficients.
Seismic load inputs to each layer are calculated by multiplying layer shear force coefficients and layer moment coefficients by effective weights of each panel. It is desirable to define these coefficients based on a large number of dynamic analyses. However, JEC-TR only shows coefficients obtained from limited analyses. Additionally, in several cases that were calculated by the JEC-TR method, the results obtained were not in agreement with results from dynamic analyses. Therefore, a modification of the layer shear force coefficient method was required by preparing new coefficients to appropriately agree with dynamic analysis.
From the above background, while considering design simplicity, we made efforts to modify these coefficients and developed a new method considering both primary and secondary natural frequencies of structures and acceleration response spectra of seismic motions. We confirmed that results based on the new method are appropriately consistent with dynamic analyses results. In Section 4.2, we explain the correction coefficient of secondary natural frequency. In Section 4.3, we show outlines of the methodology to consider ground-surface acceleration response spectra of seismic motions.
4.2. Introduction of correction coefficient of secondary natural frequency
The reasons why the results of the JEC-TR method did not agree with the results of dynamic analyses are as follows. In dynamic analyses, axial forces in abdominal materials in the secondary vibration mode are larger than those in the JEC-TR method, which are calculated by the maximum value of the full-thickness shear force. This phenomenon is remarkable at the lower part of the tower, particularly in the case of a wide tower body. Considering these points, the new method was developed, in which an axial force calculated from a layer shear force of secondary natural frequency is separately added to an axial force calculated from a maximum value of a layer shear force. This new method provides results close to those of dynamic analyses (Fig. 7).
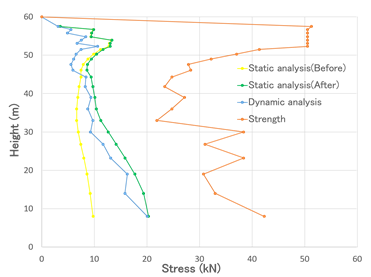
Figure 7 - Comparison between static and dynamic analyses
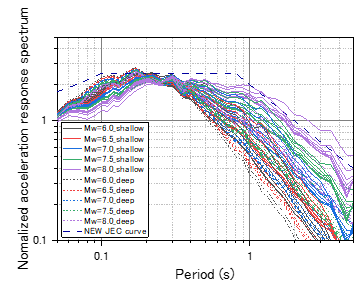
Figure 8 - Acceleration response spectra on the base
4.3. Ground-surface acceleration response spectrum of seismic motion
In JEC-5101, the ground-surface acceleration response spectra are calculated based on on-site average shear-wave velocities at 30-m depth (AVS30) and maximum accelerations on the base. This design method provides the spectrum with local site effects. JEC-5101 acceleration response spectrum on the base is defined as the envelope curve of the approximately 80 acceleration response spectra calculated based on an attenuation relation suggested by Kanno et al. [27]. These calculated spectra have differences in parameters such as magnitude and maximum acceleration on the base. Fig. 8 shows the envelope curve of JEC-5101 and the calculated spectra based on Kanno et al. [27]. In addition, the ground-surface acceleration response spectrum of JEC-5101 is defined as the envelope curve of the approximately 600 acceleration response spectra calculated based on an attenuation relation and equation for site effects suggested by Kanno et al. [27]. The five types of ground surface spectra are suggested depending on AVS30. In JEC-5101, an amplification factor representing the site effects is suggested as a ratio between the envelope curve on the base and on the ground surface.
5. Conclusion
This report introduced JEC-5101 and its technical basis focusing on main changes compared to JEC-TR. JEC-5101 seems to be distinctive because the method was carefully developed considering the natural environment in Japan. However, the use of a numerical weather model (WRF) to the maps, which are very rare in standards and studies, is applicable to other countries. Furthermore, the new snow accretion model and method to combine ice and wind loads can be used for other snowfall area. To introduce the seismic designs, our applications of layer shear force coefficient method to transmission towers are informative. Therefore, the methodologies, concepts, and technical approaches reflecting the latest academic knowledge and experiences gained from damage/failure on OHLs are informative and applicable for other countries and international standards.
Acknowledgement
This work is the result of many fertile discussions and investigations in the special and working committees of JEC. In the special committee, we received valuable advice from Prof. Masahiro Matsui (Tokyo Polytechnic University), Prof. Toru Takahashi (Chiba University), and Prof. Hiroshi Kawase (Kyoto University).
References
- T. Ishikawa, S. Matsuura, and H. Nakamura “A study on wind resistant design considering directional wind characteristics for transmission lines” (IERE Electric Power Technology Platform, the Central America Forum, 2003, S4-07)
- A. G. Davenport “Gust response factors for transmission line loading” (Proceedings of the Fifth International Conference, Fort Collins, Colorado, USA, July 1979, Vol. 2, pages 899-909)
- The Institute of Electrical Engineers of Japan “Soudenyou Tettou Sekkei Hyoujyun JEC-TR-00007-2015 Tsuiho 1 2020-06 (Design Standard on Structures for Transmission JEC-TR-00007-2015 Addendum 1 2020-06)” (Japanese Electrotechnical Committee, 2020, pages 1-129) [in Japanese]
- M. Yamazaki, T. Ishikawa, T. Ohkuma, Y. Tamura, T. Kitashima, H. Nakamura, and H. Kato “A study on directional basic wind speed for the wind resistant design of transmission towers” (Journal of wind engineering Vol. 29, No. 3, 2004, pages 19-34) [in Japanese with English abstract]
- Y. Kitano, Y. Hattori, A. Hashimoto, N. Soda, T. Ishikawa, H. Hirakuchi, T. Osono, K. Kurita, T. Miyazawa, M. Yamazaki, and T. Kitashima “Characteristics of strong wind events in Long-term High-resolution Reproduction and development of wind correction method for basic wind speed map” (Central Research Institute of Electric Power Industry, Civil Engineering Research Laboratory Rep. No. N20007, 2021, pages 1-33) [in Japanese with English abstract]
- A. Hashimoto, H. Hirakuchi, H. Tamura, Y. Hattori, and S. Matsunashi “A 53-year reproduction run over Japan using a regional climate model” (Central Research Institute of Electric Power Industry, Civil Engineering Research Laboratory Rep. No. N13004 2013, pages 1-18) [in Japanese]
- T. Ishikawa “Soudenyousetsubi no Kazekajyu Kazeoutou Hyouka” (Denchuken Review, No. 48, 2003, pages 1-96) [in Japanese]
- H. Suto, Y. Hattori, H. Hirakuchi, N. Kihara, and Y. Nakashiki “Computational fluid dynamics simulation and statistical procedure for estimating wide-area distributions of airborne sea salt considering local ground conditions” (Structure and Infrastructure Engineering, Vol. 13, 2017, pages 1359-1371)
- L. Gomes, and B. J. Vickery “Extreme wind speeds in mixed wind climates” (Journal of Industrial Aerodynamics, Vol. 2, 1977, pages 331-344)
- N. Soda, T. Ishikawa, Y. Kitano, and Y. Hattori “Reevaluation of Directional Basic Wind Speed at Meteorological Stations for Wind Resistant Design of Transmission Towers” (Central Research Institute of Electric Power Industry, Civil Engineering Research Laboratory Rep. No. N18011, 2019, pages 1-35) [in Japanese with English abstract]
- W. C. Skamarock, J. B. Klemp, J. Dudhia, D. O. Gill, D. M. Barker, W. Wang, and J. G. Power “A description of the advanced research WRF version 3” (NCAR, 2008 “Technical Note, NCAR/TN-475+STR”)
- S. M. Uppala et al. “The ERA-40 re-analysis” (Quarterly Journal of the Royal Meteorological Society, Vol. 131, 2005, pages 2961-3012)
- D. P. Dee et al. “The Era‐Interim reanalysis: Configuration and performance of the data assimilation system” (Quarterly Journal of the Royal Meteorological Society, Vol. 137, 2011, pp. 553-597)
- H. Kusaka, and H. Fudeyasu “Review of downslope windstorms in Japan” (Wind and Structures, Vol. 24, 2017, pages 637-656)
- Y. Sakamoto “Snow accretion on overhead wires” (Philosophical Transactions of the Royal Society A, G. Poots, Ed., Vol. 358, 2000, pages 2941-2970)
- CIGRE “Guidelines for meteorological icing models, statistical methods and topographical effects” (“Technical Brochure #291”, 2006)
- International Electrotechnical Commission “Overhead transmission lines – Design criteria” (“IEC 60826”, 2017)
- International Organization for Standardization “Atmospheric Icing of Structures” (ISO 12494, 2017)
- P. Admirat “Wet snow accretion on overhead lines” (“Atmospheric Icing of Power Networks”, M. Farzaneh, Ed., Springer, 2008, pages 119-169)
- B. E. K. Kringlebotn Nygaard, H. Ágústsson, and K. Somfalvi-Tóth “Modeling wet snow accretion on power lines: Improvements to previous methods using 50 years of observations” (Journal of Applied Meteorology and Climatology, Vol. 52, 2013, pages 2189-2203)
- B. E. K. Nygaard, I. A. Seierstad, and A. T. Veal “A new snow and ice load map for mechanical design of power lines in Great Britain” (Cold Reg. Sci. Technol., Vol. 108, 2014, pages 28-35)
- H. Ducloux, and B. E. Nygaard “50-year return-period wet-snow load estimation based on weather station data for overhead line design in France” (Natural Hazards and Earth System Sciences, Vol. 14, 2014, pages 3031-3041)
- T. Matsuo, and Y. Sasyo “Melting of snowflakes below freezing level in the atmosphere” (Journal of the Meteorological Society of Japan, Vol. 59, 1981, pages 10-25)
- S. Sugimoto, T. Aso, and M. Saiki “Proposal of a type classification method for snow accretion on overhead transmission line using meteorological data” (“Report of Central Research Institute of Electric Power Industry”, 2012, N11059, pages 1-21) [in Japanese with English abstract]
- K. Ueno, and T. Nishihara “A snow accretion simulation method considering precipitation types based on the liquid water fraction of falling snowflakes” (Presented at 17th International Workshop on Atmospheric Icing and Structures, 2017)
- H. Matsumiya, S. Taruishi, M. Shimizu, G. Sakaguchi, and J. H. G. Macdonald "Equivalent static wind loads on snow-accreted overhead wires" (Structural Engineering International, Vol. 32, 2022, pages 78-91)
- T. Kanno, A. Narita, N. Morikawa, H. Fujiwara, and Y. Fukushima “A new attenuation relation for strong ground motion in Japan based on recorded data” (Bulletin of the Seismological Society of America, Vol. 96, 3, 2006, pages 879-897)