C2 - Inertia Measurements in the GB Power System used for Operations and Planning Improvements
Authors
B. BERRY, A. ENAS - Reactive Technologies, United Kingdom
A. BLACKWELL - NGESO, United Kingdom
S. REID - SSEN, United Kingdom

Summary
The GB power system has been negatively affected by significantly increasing operational costs directly related to low inertia. The low inertia in the power system, caused by a large penetration of non-synchronous generation, causes greater and more common excursions of frequency and rate of change of frequency (RoCoF). The System Operator has therefore initiated a project that will monitor the system’s inertia in near real time. This service will allow the System Operator to drive ‘closer to the edge’, saving on reserve costs whilst still securing the instability risk. Further to this, an improved understanding of the inertia in the system will empower Operations and future planning by improving forecasting models. The inertia measurement itself is not trivial as it uses a novel technique of stimulating the grid with relatively small power injections in a repeating and oscillatory manner. This intentional power injection pattern, referred to as ‘modulation’, is key as it allows the small excursions in frequency to be extracted from the ‘noise’ of the system and hence inertia can be measured regularly without significant effect on the power system.
The GB grid also includes small, isolated islands where renewable resources are curtailed in favour of inertia-providing, fossil fuel-based generation. The frequency stability of the micro-grid is challenging and the lack of high-resolution data on the island makes it difficult to operate in these conditions. The network operator for the island and surrounding areas installed a short-term inertia measurement system to truly understand the inertia in the grid and better prepare for frequency instability. This paper touches on the operational experience gained from this short-term trial and explains how similar measurements could be used in micro and large-scale grids to ease instability caused by low inertia.
This paper discusses the following topics:
- Inertia measurement technique, system and required equipment
- Results and analysis from the inertia measurement campaigns
- The modulator (ultracapacitor storage) design and capability
Keywords
Inertia - Frequency - Stability - RoCoF - Frequency Reserve1. Introduction
Decreasing inertia levels, caused by increasing penetrations of non-synchronous generation, is a current problem facing most power systems globally. The low inertia in the power system, causes greater and more common excursions of frequency and rate of change of frequency (RoCoF) increasing the risk of frequency instability and/or increasing operational costs to prevent such risks. The power system in the United Kingdom has been negatively affected by significantly increasing operational costs directly related low inertia and the problem is made worse by ‘Loss of Mains’ protection on distributed generation which is enabled to protect these generators from operating unsafely in islanded conditions but causes them to trip during large frequency excursions making the system imbalance even larger.
The System Operator has initiated a project that will monitor the system’s inertia in near real time. This system will allow the System Operator to drive ‘closer to the edge’, saving on reserve costs whilst still securing the instability risk. Further to this, an improved understanding of the inertia in the system will empower Operations and future planning by improving forecasting models.
The proposed inertia measurement methodology is unique in that is purposely injects minor power disturbances in the grid. This paper discusses the results from a trial done in a small, isolated island off the coast of Great Britain and also shows the pathway for the inertia measurement system in the mainland. This paper touches on the operational experience gained from this short-term trial and explains in detail how similar measurements could be used in micro and large-scale grids to ease instability caused by low inertia.
This paper is laid out as follows:
- Overview of the inertia measurement technique
- Inertia measurement in the small island grid
- Equipment and setup
- Results and analysis including operational benefit
- Way forward for inertia measurement in mainland GB
- The measurement system
- The modulator (ultracapacitor storage) design and capability
2. Inertia measurement
TSOs currently rely on inertia estimation methodologies on which they base critical operational, technical and procurement decisions. These estimates however are becoming increasingly incorrect due to the renewable generation embedded in the distribution network which is often concealed from the view of TSOs. Being able to calculate inertia in real time, rather than estimating it, would allow TSOs to better respond to system events faster and more efficiently conduct network reinforcement.
There are currently two common ways of estimating inertia in industry: summing inertia constants from transmission connected generation, or measuring Rate of Change of Frequency (RoCoF) during large frequency excursions and calculating inertia based on power events throughout the year [1, 2, 3, 4]. These estimation models provide static and historic views of system stability only. None offer a controllable, accurate and continuous view of inertia from transmission, distribution and demand – a view that TSOs require to safely integrate greater amounts of renewable generation and maintain system stability. The methodology proposed in this paper is different because it directly measures the inertia by stimulating the frequency in the power system with controlled power injections. This is described in more detail in the next section.
2.1. Direct Inertia Measurement
For the measurement of inertia, a ‘Modulator’ alters the frequency of the power system slightly and proprietary high-speed measurement units distributed around the grid observe the minute changes in the system frequency. The power changes are typically around 0.03% of the total grid capacity. For example, in the case of the GB grid which has a 18-60 GW capacity, a signal of around 10 MW peak-peak yields good accuracy on the inertia measurement [5, 6]. The typical frequency changes are in the range of 1-20 mHz which is not observable in the frequency signal using the ‘human eye’ as they are hidden in the typical ‘noise’ of the system. This small power change and minute frequency change are used to measure grid inertia continuously and directly from both the generation and demand sides. This method uses the Swing Equation in its methodology; however, it also incorporates signal processing innovations to read and interpret these miniscule frequency changes. Figure 1 below shows a flow diagram of the process.
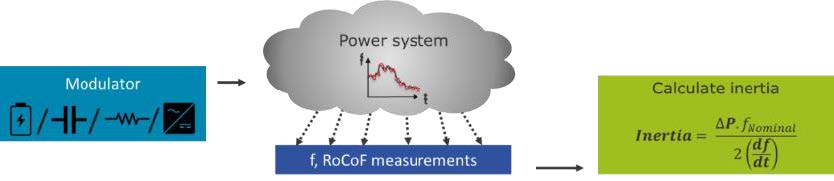
Figure 1 - Flow Diagram of the patented inertia measurement method process
For more details on the algorithm and testing to prove its accuracy in both simulations and real power systems please refer to [6].
3. Islanded grid operation
This year one of the islands that is typically synchronous with the mainland GB system has become disconnected due a serious cable fault. Whilst the cable was being replaced, the island ran in an islanded mode with renewable resources curtailed in favour of inertia-providing, fossil fuel-powered generation. The frequency stability of the micro-grid was challenging and the lack of high-resolution data on the island makes it difficult to operate in these atypical conditions. The network operator for the island and surrounding areas thus installed a short-term inertia measurement system to truly understand the inertia in the grid and better prepare for frequency instability.
3.1. Equipment
Figure 2 shows an overview of the infrastructure specific to this project. To get the data into the platform and support the service, a number of proprietary devices are used, including the Modulator, frequency measurement devices (XMU) and a cloud-based analysis and UI platform.
- Modulator – A modulator device is a crucial part of the inertia measurement service. Here a load bank was used to modulate create a periodic (square wave) power modulation at the specific frequency band for a period of ~0.5-10 seconds. The frequency of the modulation is specific to the grid and depends on the grid size/impedance, capacity, and typical inertia. Since the peak demand of the island is around 20 MW, the load bank used was a 100 kW/400 V asset, but it was typically operated at 15 kW.
- XMU Measurement Devices (eXtensible Measurement Unit) – These measurement devices accurately measure raw power system metrics such as voltage phase and frequency. These devices are typically connected at 230 V via a plug socket and send data directly to the cloud via an encrypted internet connection.
- Cloud-based analytics Platform – the key technology in the measurement of inertia where data is gathered, stored, and analysed. This also provides a user interface for displaying relevant grid information to the customer either in control room or for planning team purposes.
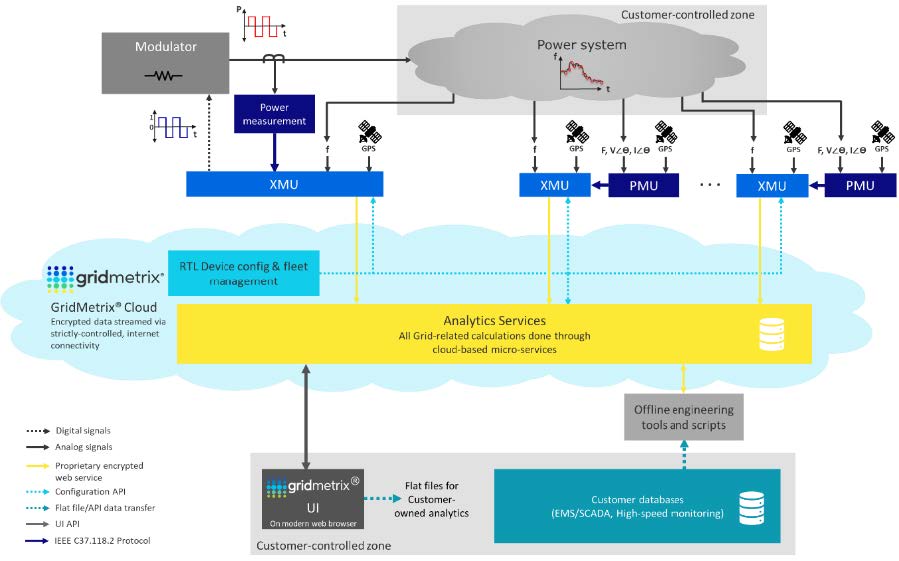
Figure 2 - Architecture of the cloud-based inertia measurement and analysis system
3.2. Results and interpretation
Inertia levels are dependent on the synchronous machines connected to the power system – these can be from the known and modelled generators but also from unknown distributed generators and motors. The resultant inertia in a power system is therefore correlated both to the generation and demand profiles. Whilst the total inertia is not estimated continuously currently by the island’s System Operator, it is possible to treat the total demand and power stations’ output as a proxy for the synchronised capacity (which depends on the rating of the machines and not on their output).
Figure 3 plots the inertia measurement and the estimates derived from fitting an inertia constant to the demand and the generators’ output. It is important to note that no better inertia estimates were available since the generating plant onsite has outdated documentation and the aim of the project was to provide improved inertia values. The estimates here are used to illustrate that the measurements are reasonable. The general trends are well matched but there are considerable differences due to different generator loading levels and the resulting number of generators synchronised.
Performing a linear least squares fit of the demand curve onto the inertia measurement indicated an average inertia constant of 4.20s per MW. The inertia estimate does differ to the measurement significantly at certain times which is due to the estimate using the generator loading rather than capacity. However, the resulting Mean Absolute Percentage Error (MAPE) calculated as the absolute percentage difference between the inertia measurement and the inertia estimate using the demand level is 14.33%. Similarly, an average inertia constant for the output of each power station was found: 3.60s for Power Station A [1], 2.95s for Power Station B and 4.05s for the embedded generators grouped into the “customer generators” profile. In this case, the MAPE is 16.98%.
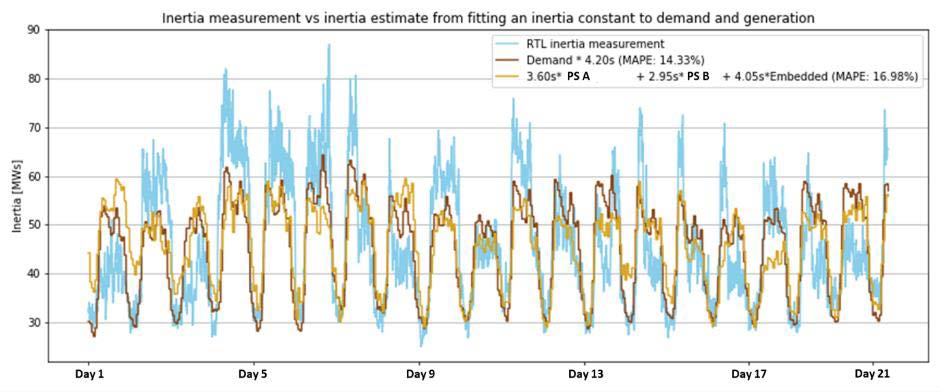
Figure 3 - Inertia measurement and inertia estimated from fitting an inertia constant to demand and generators' output
To conclude, the inertia measurement is highly correlated to the underlying demand profile, and it is able to capture the changes in inertia levels due to every synchronous machine being connected or disconnected from the grid. Beyond this, the measurement period has allowed for the creation of a simple and rough estimate based on the total demand of the island. This estimate has errors lower than 20% but is exposed to high instantaneous errors, however this could still be used to improve operations over the current situation. For further optimisation of running costs and risk mitigation, an online measurement of inertia would be beneficial.
Daily inertia profiling
As previously mentioned, system inertia follows the general trend of demand and generation: it rises in the early morning when demand picks up, it fluctuates with more variance during the hours of the day, and it finally falls over the night when demand is low and more constant.
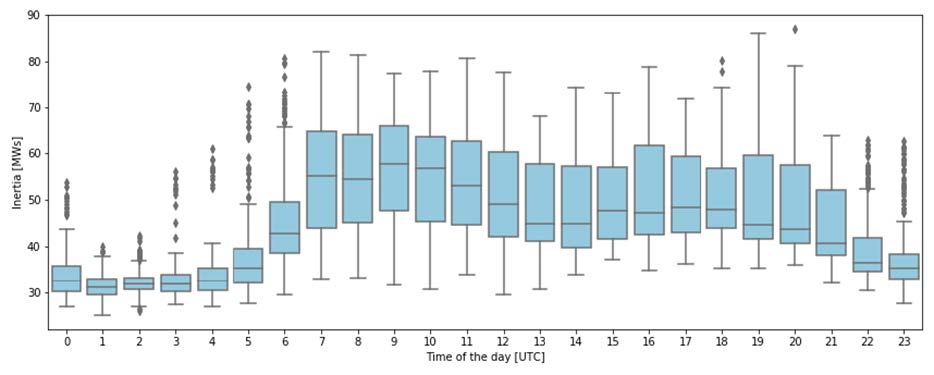
Figure 4 - Hourly inertia profile
The boxplot presented in Figure 4 demonstrates the hourly inertia profile which presents higher volatility in the hours of the day between 7 AM and 9 PM (UTC). System inertia at night ranges between 25 and 40 MWs, whereas during the day it varies over a much wider range between 25 and 80 MWs. The great inertia variance across the hours of the day can be in part explained by the presence of very different inertia profiles. Unsupervised K-Means clustering was applied to the dataset of individual daily inertia profiles recorded throughout the pilot and three dominant clusters were found. Figure 5 shows the collection of inertia profiles clustered in the three classes.
The “Class 1” profile is characterised by a step increase of inertia in the first hours of the morning and a sustained, high inertia level throughout the day followed by a steep decrease to reach the night-time inertia.
The “Class 2” profile presents a morning inertia ramp up similar to that of “Class 1”, but a different day-time pattern characterised by a slow and steady inertia decrease throughout the day.
The “Class 3” profile is characterised by low yet stable inertia levels throughout the day.
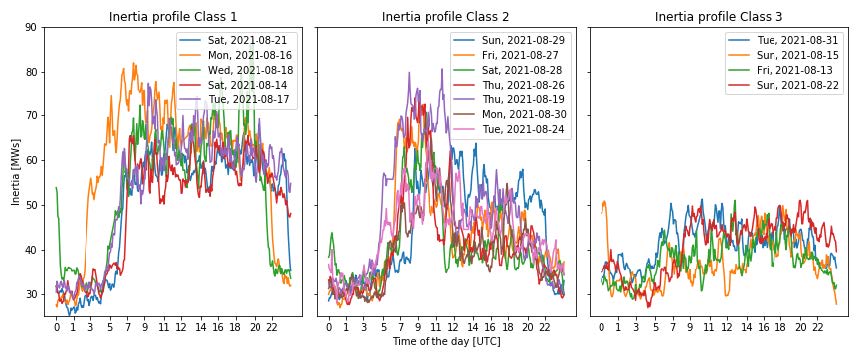
Figure 5 - Inertia profile clusters – Class 1 to 3 from left to right. Class 1 has high inertia throughout the day, Class 2 has a peak of inertia in the morning and this drops throughout the day, Class 3 maintains a low inertia value throughout the day
The first inertia profile is the safest in terms of stable system operation, as its high and steady inertia levels throughout the day better mitigate potential generation and demand trips. Conversely, the third profile is the least safe and such operation is acceptable only if the loading of the larger generators is strictly limited. A single generator trip can cause load shedding if its output exceeds the safe limit within which the inertial reserve can contain RoCoF. In fact, this is what happened on Day 3 (Sunday) when an approximately 2.5 MW trip caused the frequency to drop to 48.9 Hz. The second profile is an intermediate case between the two, where high inertia levels are guaranteed during the morning but not in the afternoons and evenings. It is important to note that the profiles are not limited to weekend or weekday patterns as each profile has example days from both. Such profiling is useful to create inertia forecasting models, the ultimate tool for optimised day-ahead inertia provisioning.
Frequency Event analysis
Frequency and RoCoF events were automatically detected and recorded during the project. Of the hundreds of disturbances detected by the event analyser over the three weeks project period, 73 qualified as significant frequency and RoCoF breaches (frequency below 49.5 Hz and/or RoCoF magnitude above 0.125 Hz/s). The frequency nadir (minimum frequency reached during the event) and the maximum RoCoF for the 73 events is presented in Figure 6. The traffic light colour coding highlights the most problematic events.
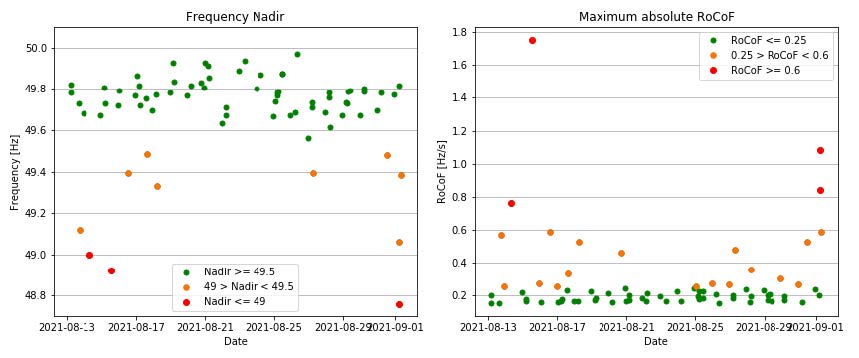
Figure 6 - Frequency/RoCoF events summary for the islanded grid
During the pilot, three critical events occurred which resulted in the system frequency declining to 49 Hz or lower, most likely triggering the under-frequency load shedding (UFLS) mechanism. Table 1 reports the details of such events, including an estimate of the power imbalance size and the loss secured by the inertial reserve. The event power imbalance is calculated using the measurements of RoCoF and inertia as per the Swing Equation [7].
The Secured Loss can be calculated using the same equation for a fixed maximum RoCoF allowed. For this islanded grid, the RoCoF threshold is best placed at 0.6 Hz/s (based on empiric evidence linking the frequency nadir and the maximum RoCoF magnitude).
One of the key observations from Table 1 is that for each of these events, the secured loss was significantly smaller than the actual power imbalance (i.e. the secured loss was exceed by up to 290%). In these instances, the grid was operated unsafely as what seems to be the loss of a single plant has resulted in UFLS. There might have been enough spinning reserve to ramp up and meet the demand mismatch however, the inertia levels at the time induced a fast RoCoF and the resulting rapid frequency drop to 49 Hz or less.
| Event timestamp [UTC] | Nadir [Hz] | Max Abs RoCoF [Hz/s] | Inertia [MWs] | Event size [MW] | Secured loss [MW] | Exceedance [%] |
|---|---|---|---|---|---|---|
| Day 2 07:35 | 49.00 | 0.76 | 65.52 | 2.00 | 1.57 | 127% |
| Day 3 13:05 | 48.92 | 1.75 | 35.06 | 2.46 | 0.84 | 293% |
| Day 20 05:30 | 48.76 | 1.08 | 40.16 | 1.74 | 0.96 | 181% |
Secured loss performance
This section presents the analysis of the secured loss over time as well as an evaluation of the safety of the operational strategy adopted for a set of largest loss scenarios. The Secured Loss in this case is the largest generation drop that the system can tolerate without its frequency decreasing to less than 49 Hz.
Figure 7 shows the secured loss calculated during the service pilot (using the measured inertia and the RoCoF threshold of 0.6 Hz/s explained in the previous section). It shows that whilst the minimum loss secured is consistently above 0.75 MW, it is never higher than 2 MW. The largest generator at Power Station A has a capacity of 3.5 MW, which is more than 3 times the average secured loss (1.1 MW).
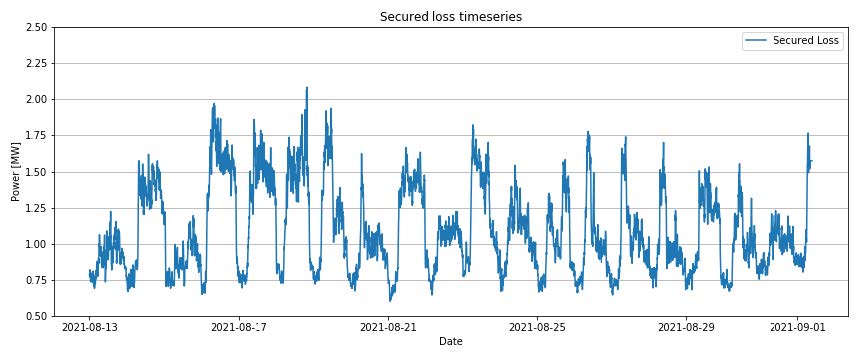
Figure 7 - Island grid Secured loss [MW] during measurement campaign
Figure 8 shows the percentage of time a set of hypothetical largest losses would have been secured. This can also be read as “how much time was it safe to operate a generator at one of these power levels?”. For example, during about half of the project it was safe to run a generator with maximum power output limited to 1 MW. However, only 13% of the time it was safe to run with up to 1.5 MW of output and it was never safe to run at more than 2 MW.
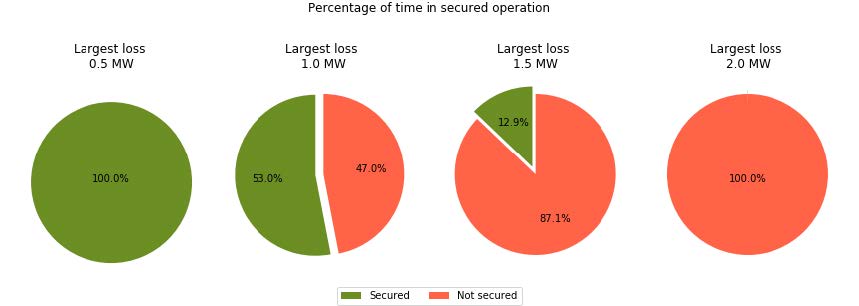
Figure 8 - Percentage of time operating with the largest loss secured for a set of largest losses
As discussed earlier in this chapter, there were instances at which the system was operated at higher risk of UFLS occurring. In fact, over the span of three weeks there were three incidents at which system frequency dropped to 49 Hz or below (see Table 1) due to drops in generation of approximately 2, 2.5 and 1.8 MW respectively, which were well above the largest secured loss.
Such incidents can be avoided by capping generation output to the secured loss level, increasing the system’s inertial reserve by synchronising more spinning masses or a combination of the two. To do so in an economically efficient and operationally safe manner, knowledge of system inertia and secured loss levels is key.
This project made the System Operator aware of this operating risk and models have been recalibrated and improved operating procedures have been put in place.
4. Mainland GB operation
This methodology is not limited to small island operation and has been tested in the GB mainland and larger systems, as discussed in [5, 6]. As such, the System Operator for the mainland GB power system is in the process of commissioning a commercial operation of the inertia measurement service [8, 9]. Due to its larger grid capacity (up to 60 GW) the use of large load banks for modulation would be a wasteful use of energy. Energy storage systems, which can charge and discharge from the power system, are better for large systems because here only the losses yield wasteful energy consumption. As such, the world’s largest ultra-capacitor energy storage system has been purpose-built for this measurement. Ultra-capacitors are well suited to the application as the signal does not require more than several seconds of energy storage at the maximum signal amplitude and ultracapacitors degrade far less than batteries when cycled regularly.
The modulator used in the Great Britain, as shown in Figure 9, is a 5 MW ultracapacitor which allows for a 10 MW peak-to-peak signal. The ultracapacitors cells are charged and discharged in DC then converted to AC via four parallel inverters. Finally, a dual-secondary winding transformer steps the AC voltage up to 11 kV where it connects into the GB power system.
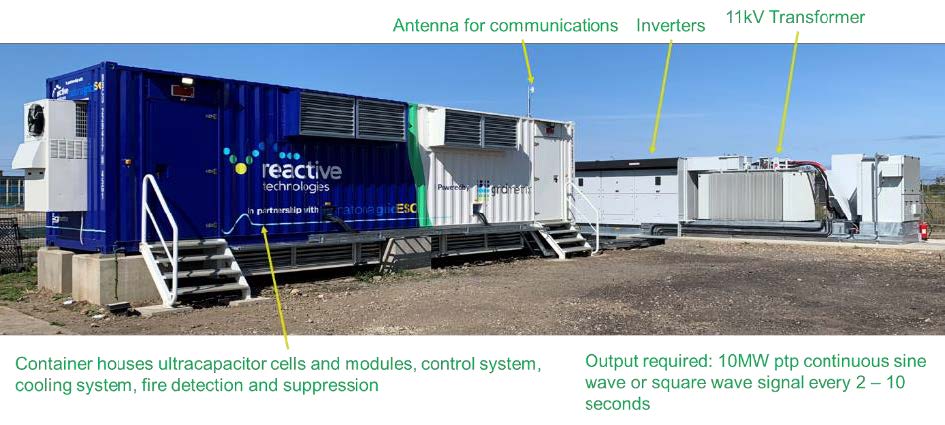
Figure 9 - Photograph of the 5 MW, ultracapacitor modulator built for the GB inertia monitoring service
In order to perform its function, the output power signals from the Modulator system must have the ability to create periodic waveforms, for example sinusoidal and square waves with ramp rates up to 100 MW/s. The Modulator system has the possibility of switching between operating modes and changing any configurable parameters (like amplitude, frequency, or phase), with the change reflected in the next positive half cycle of the modulation signal. The maximum ramp rate used for the ‘square wave’ operation is 100 MW/s (i.e. -5 MW charging to +5 MW discharging within 200 ms). This type of ramp rate is well within the capability of many industry-standard inverters – this means that the building of Modulators can be cost effective in the global context.
Unfortunately, at the time of writing the system is not fully commissioned, and a detailed inertia result is not ready for publication. However, Figure 10 shows the User Interface that allows for viewing both the real-time inertia measurement and the Secured Loss. In this screenshot, the inertia measured during functional testing of the modulator can be seen. The Secured Loss here is calculated to secure a RoCoF of 0.125 Hz/s which is the setting currently used by the System Operator to prevent any sporadic tripping of Loss-of-mains protection relays which have the old settings. These settings are being replaced with 1 Hz/s through the Accelerated Loss of Mains Change Programme (ALoMCP) [10]. The Secured Loss is used to redispatch generation to reduce the largest single generation/load contingencies. For example, power of the HVDC interconnections will be reduced to lower than the Secured Loss so that if it were to trip, the RoCoF would be within 0.125 Hz/s.
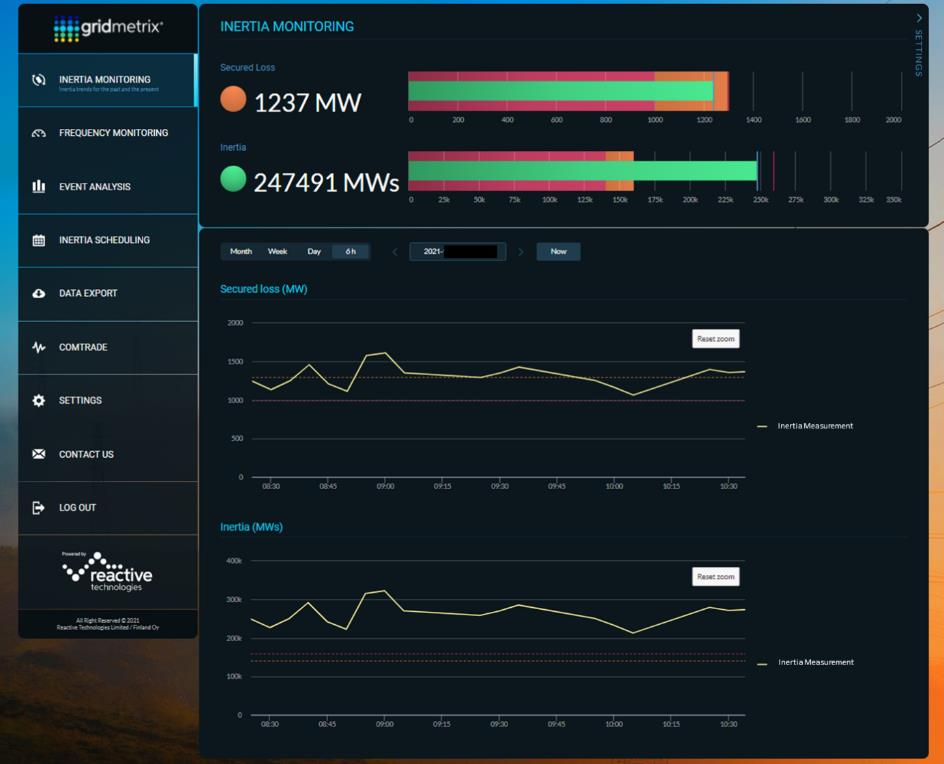
Figure 10 - User interface showing how real-time inertia measurements can be used in the control room
5. Conclusion
The proposed inertia measurement technique has been utilised in an islanded grid off the coast of the GB. During a 21-day measurement campaign where inertia was measured, large frequency and RoCoF disturbances were recorded. Three such disturbances resulted in under frequency load shedding (UFLS) due to the frequency falling below 49 Hz. The use of inertia data and event experience allowed for the determination of a Secured loss value as operational guidance to prevent the RoCoF events of greater than 0.6 Hz/s. If the RoCoF is higher than 0.6 Hz/s, the spinning reserve on the island is not fast enough to prevent the frequency falling below 49 Hz and UFLS will occur. This data has been highly valuable for tuning the models of the very old generators on the island and to update operating procedures to ensure the Secured Loss is maintained and the risk of disconnecting of customers during frequency events can be avoided.
In mainland GB, a similar inertia measurement system is being commissioned, however the large size the grid poses an opportunity to optimise the modulator design. In this case the largest grid-scale, ultra-capacitor installation in the world is used as a modulator. This 5 MW system is continuously cycled every few seconds – this operation is much better suited to ultracapacitors due to their degradation tolerance and lower energy capabilities compared to batteries. Whilst the system is still being commissioned, initial results have shown the modulator suitable for inertia results.
References
- P. Ashton, “Exploiting Phasor Measurement Units for Enhanced Transmission Network Operation and Control,” PhD Thesis, Brunel Institute of Power Systems, Department of Electronic and Computer Engineering, Brunel University, UK, 2014.
- T. e. a. Inoue, “Estimation of Power system Inertia Constantand Capacity of Spinning-reserve Support Generators Using Measured Frequency Transients,” IEEE Transactions on Power Systems, Vol 12, No 1, February 1997.
- B. Berry, “Inertia Estimation Methodologies vs Measurement Methodology: Impact on System Operations,” in Symposium Aalborg, Denmark, 2019.
- CIGRE JWG C2/C4.41, “Impact of High Penetration of Inverter-based Generation on System Inertia of networks,” CIGRE Technical Brochure N.851, 2021.
- Reactive Technologies, “SIM phase Report Version 8,” 16th November 2016.
- B. Berry, E. Hwang, N. Hosaka and S. Miyazaki, “C4-106 - Inertia Measurement Method to Address Declining System Resilience,” in Cigre Session 48, Paris, 2020.
- P. Kundur, Power System Stability and Control, McGraw-Hill, 1994.
- Watt-Logic, “New ways of measuring grid inertia will support integration of renewable generation,” 5 11 2021. [Online]. Available: https://watt-logic.com/2021/11/05/measuring-grid-inertia/. [Accessed 24 11 2021].
- I. Dytham, “System Inertia Monitoring,” 30 6 2021. [Online]. Available: https://www.naspi.org/node/898. [Accessed 24 11 2021].
- National Grid ESO, “Accelerated Loss of Mains Change Programme (ALoMCP),” 1 2 2018. [Online]. Available: https://www.nationalgrideso.com/industry-information/accelerated-loss-mains-change-programme-alomcp. [Accessed 28 11 2021].
- [1] Names have been removed for confidentially reasons