C5 - Beyond Expected Values Evolving Metrics for Resource Adequacy Assessment
D. STENCLIK - Telos Energy, USA
G. STEPHEN - University of Washington, USA
W. COLE - NREL, USA
A. TUOHY - EPRI, USA
A. BLOOM - Energy Systems Integration Group, USA
A. FIGUEROA ACEVEDO - MISO, USA

Summary
Growing shares of variable renewable energy, increased load flexibility, energy storage, and fossil retirement trends are all precipitating a change in the way resource adequacy analysis should be conducted. In addition, the recognition of correlated events and changes to weather-related extreme events due to climate change requires that the industry modernize existing frameworks for resource adequacy analysis.
As the power system’s resource mix changes, resource adequacy metrics need to transform as well. The conventional resource adequacy metric, loss of load expectation (LOLE), quantifies the expected amount of time when capacity is insufficient to meet load in a given year. LOLE is an opaque metric when used in isolation. It only provides a measure of the average amount of shortfalls over a study period and does not characterize the magnitude or duration of specific outage events. This is true for loss of load hours (LOLH) and loss of load events (LOLEv) as well. In addition, these metrics are expected values and simply quantify an average risk across all of the replications evaluated and provide no information on the distribution of shortfall events or insight into extreme, or tail events.
While new metrics may be useful to quantify reliability risk, a first step in improved resource adequacy analysis is to simply use existing metrics better. Currently, many models can calculate hourly expected unserved energy (EUE), number of loss of load events, and number of shortfall hours. From these, planners can already calculate metrics that summarize size, frequency, and duration of shortfall events. The increased use of EUE is beneficial, as it quantifies the expected aggregate size (amount of energy) of shortfall events as opposed to only quantifying the probability or frequency of one occurring. In addition, a lot can be gained by evaluating the distribution of resource adequacy metrics as opposed to only the average result. Deeper analysis into the underlying shortfall events to further characterize the size, frequency, and duration of events is also critical. Without developing a new metric, the better use of existing metrics can help ensure that reliability mitigations - such as adding new capacity resources, strengthening the grid, and load flexibility - are properly sized and selected to meet reliability targets.
The metrics and reliability criteria used by system planners must also evolve. Building on existing resource adequacy risk metrics and drawing on knowledge from other risk-aware fields, we propose four potential steps forward that practitioners can take to improve the effectiveness of adequacy metrics in their analyses: emphasizing normalized unserved energy, reporting a suite of metrics, quantifying distributions and tail risks, and examining the nature of individual shortfall events. While each of these areas presents opportunities for increasing the rigor of adequacy analyses, they also present visualization and communication challenges, which must be addressed.
Keywords
Resource Adequacy - Loss of Load Expectation - Reliability - Probabilistic Analysis1. Introduction
Resource adequacy analysis quantifies the likelihood of capacity shortfall on a power system in a probabilistic manner. Using a combination of statistical techniques and power system fundamentals, the analysis typically evaluates hundreds or thousands of stochastic random samples (replications) of varying load, generator outages, variable renewable energy availability, and other aspects of power system uncertainty. In this range of uncertainty, there are—at times—periods where the power system’s available resources are insufficient to meet system demand, referred to as a shortfall event.
Today’s power systems’ rapidly evolving generation mix is changing the types of data needed by system planners and regulators, which can often render traditional resource adequacy metrics insufficient for ensuring resource adequacy for tomorrow’s grid. In this paper we provide a critical assessment of traditional measures of shortfall risk in power systems, discussing their shortcomings and how they compare to metrics used in other domains [1]. From this analysis we propose four potential steps forward for improving power system resource adequacy risk metrics in the future.
2. Traditional resource adequacy risk metrics
A very basic measure of resource adequacy is the number of individual shortfall events that a system experiences. The loss of load events (LOLEv) metric, also referred to as loss of load frequency (LOLF), estimates the number of discrete shortfall events the system may experience, on average, over a given study horizon [2]. For example, for a given level of capacity investment, the system may be expected to experience a shortfall situation once every 10 years on average, for an LOLEv of 0.1 events/year.
Not all shortfall events are equal – a shortfall situation lasting a week is much more dire than a situation lasting an hour. To differentiate these outcomes, one can combine information on shortfall frequency and duration, reporting the expected count of periods during which shortfall occurs. This measure, typically provided in terms of event-days or event-hours, is known as the LOLE [3], and is the most widely adopted metric for quantifying resource adequacy risk today. An entity may, for example, set an acceptable risk level for their system to be one event-day per ten years or three event-hours per year. When expressed in terms of event-hours, LOLE is sometimes referred to as LOLH.
Both LOLEv and LOLE effectively treat shortfalls as binary events: either the system is dropping load, or it is not. However, an important aspect of power system adequacy is that shortfall situations are not all-or-nothing. The greater the shortfall, the more load shedding is necessary, and the less desirable the situation. It is therefore important to also consider the magnitude of shortfall events, not only their frequency and duration. The expected unserved energy (EUE) [1] metric accomplishes this by considering the depth of shortfall in each time period, expressing a result in terms of MWh of curtailed demand.
Collapsing multiple pieces of information (shortfall frequency, duration, and magnitude) into single-dimensional metrics necessarily involves information loss. It is not possible, for example, to use LOLE to distinguish frequent short events from rare long ones. Similarly, EUE cannot distinguish between events that are short, shallow, and frequent, events that are short, deep, and rare, and events that are long, shallow, and rare. Figure 1 provides two examples of how identical metric values can describe very different events. This illustrates the need to report, and utilized, multiple metrics for resource adequacy and long-term planning.
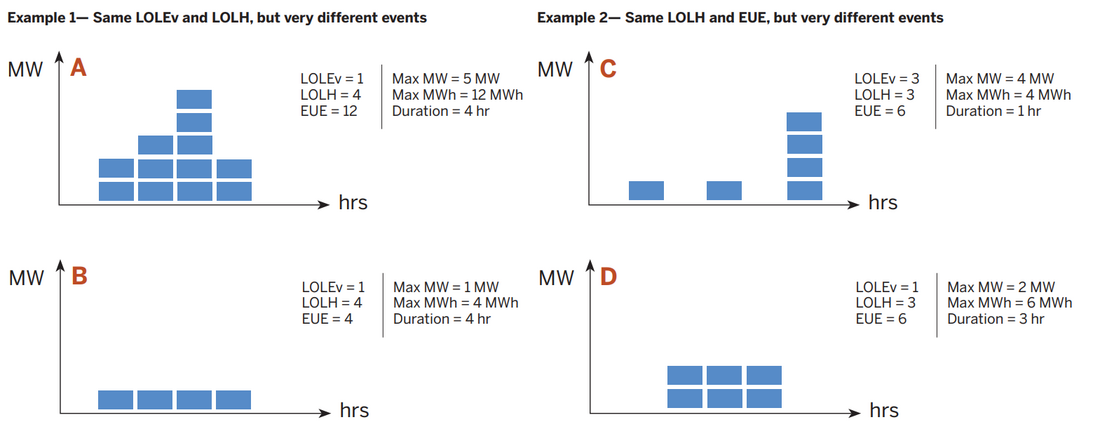
Figure 1 - Building blocks of resource adequacy metrics
3. Comparing power system risk metrics to other fields
Power system engineering is clearly not the only domain concerned with risk and reliability. While the power system engineering field has a well-established literature on this topic, many other disciplines have been undertaking their own parallel efforts to address these issues and it would be wise to learn from these domains, particularly as we enter into a period of power system transformation where traditional approaches and heuristics may no longer be effective.
Many engineering domains are able to express system reliability in terms of a single percentage value, representing a measure such as ‘uptime’ or ‘availability’. This measure typically represents a fraction of time which, as discussed in the preceding section, is not sufficient to fully capture the nature of adequacy risk in power systems. However, this general approach provides an intuitive and widely recognized measure of reliability which may be useful to the resource adequacy community. Percentages are self-contextualizing, can be readily compared across different systems, and have established “class of nines” logarithmic language available for accessible communication of the exponentially increasing costs of reliability (e.g. “five nines” for 99.999% and “six nines” for 99.9999%) [4].
In contrast to traditional resource adequacy language, the engineering reliability focus on uptime over downtime also presents certain communication advantages. While metrics such as LOLE are, strictly speaking, measures of shortfall risk, it is a common shorthand to refer to them as measures of resource adequacy. This leads to the confusing inconsistency where a system planner may speak of the need to increase resource adequacy by decreasing a system’s resource adequacy metrics. Casting the performance metric in terms of a desirable quantity (uptime) instead of an undesirable quantity (downtime) avoids this issue.
The quantitative finance field is another domain with an obvious interest in risk assessment. Furthermore, unlike engineering component reliability, financial returns are not binary on-off states, and instead can span a continuous range of possible values. In this regard, the modeling of investment risk may provide a more useful analog to power system shortfall. The comparison is not perfect, however, with power systems presenting several modeling complications over financial instruments. Unlike power system adequacy investments, capital allocation in financial investments is presented in identical units (currency) to the outcome, which enables more involved quantitative analysis. While power system capital investments can be expressed in currency units, the economic benefit of avoiding a load interruption is an unknown function of the frequency, duration, depth, location, and timing of the event, and involves unquantifiable considerations such as the value of human life and comfort.
In spite of these important differences, there are likely still elements of financial risk assessment that can inform power system resource adequacy analysis. Just as a regulator may task a power system planner with designing a least-expected-cost system subject to some maximum tolerable shortfall risk, a financial planner designs an investment portfolio to maximize expected returns subject to a particular risk preference. Where these fields differ, however, is in how that risk is defined: while power system planners traditionally focus on average shortfall outcomes, financial risk management is focused on tolerance to tail events [5].
The issue of describing risk tolerance in terms of tail events is so important in quantitative finance that a body of literature has developed around so-called ‘coherent’ risk metrics [6], a family of transformations mapping a probability distribution of outcomes down to a single value in a way that enforces certain desirable properties. Some requirements for coherence that are relevant to power system adequacy metrics include:
Monotonicity: If, in every scenario considered, one resource portfolio performs better (i.e. more reliably) than another, the risk metric assigned to the first portfolio should be lower than the second. Traditional resource adequacy metrics generally satisfy this property.
Sub-additivity: Diversifying a portfolio should never increase risk. In financial applications, this means that if several investments each satisfy some risk criteria individually, a portfolio combining those investments must as well. Unserved energy outcomes (i.e., EUE) satisfy this criterion, but event and event-period counts (i.e. LOLEv and LOLE) do not. Consider a system with two regions: one with summer shortfall risk, and one with winter shortfall risk. When modeled independently, each sub-region may have an LOLE of 0.1 event-days/year. When modelled together, resource complementarities may allow the regions to decrease their individual unserved energy, but if shortfalls are only reduced, not eliminated, the system’s overall LOLE will increase to as much as 0.2 days/year (representing expected shortfalls in both the summer and winter). LOLE and LOLEv would therefore not be considered coherent risk metrics.
Using a distribution’s percentile as a risk measure (referred to as “value at risk”, or VaR in the finance literature) also famously violates this sub-additivity criteria. This has led to the development of the “continuous value at risk” (CVaR) metric [7], the average value of all outcomes beyond some percentile, as a coherent alternative.
4. Four steps forward for better shortfall risk metrics
Motived by a growing awareness of the shortcomings of existing practices in future power systems, and drawing on insights from other domains, we propose four potential steps forward for addressing existing issues and improving the effectiveness of resource adequacy metrics in system planning exercises. Each step is designed such that it can be taken independently of the others, although the combination of these measures should provide additional benefits.
4.1. Place greater emphasis on normalized unserved energy metrics
As discussed in the preceding sections, event count metrics (LOLEv) and event-period count metrics (LOLE) miss key aspects of power system adequacy and performance and can have surprising properties under aggregation. If system adequacy information must be reduced to a single comprehensive indicator, unserved energy metrics such as EUE may be the better choice, as such metrics combine the frequency, duration, and magnitude of shortfall events into a single value.
While EUE expressed in natural energy units (e.g., MWh) can complicate comparisons across different systems, or within a single system at different times, the measure can easily be normalized by the total energy demand of the system (in the region or time period of interest). This normalized expected unserved energy (NEUE) value can be expressed as a percentage or parts-per-million (ppm). For example, Australia’s National Electricity Market uses a 0.002% (20 ppm) NEUE standard [8].
Using a fractional metric also enables the use of more standard engineering reliability language that quantifies desirable, rather than undesirable, outcomes. While it would be cumbersome and unintuitive to explain an LOLE target of 8757 “non-event”-hours per year (especially to those who have not committed the number of hours in a year to memory!), a target average reliability of 99.998% of energy demand served is more easily communicated to non-technical stakeholders, who can intuitively understand that increased adequacy will be manifested as an increased fraction of energy served.
Moving from an adequacy (risk) metric in terms of event or event-period counts towards a fractional energy measure also helps eliminate misconceptions surrounding the nature of expected values. Most non-experts would intuitively consider an “expected” outcome to indicate the most likely result out of the range of possibilities, not the mathematical average. A system LOLE of 3 event-hours per year is easily misinterpreted as a signal that one should “expect” 3 hours with shortfall every year, when the most probable outcome is very likely zero hours of shortfall each year (with perhaps a 30-hour event once per decade). Fractional energy measures can be presented independent of any temporal horizon and so are much less susceptible to this misconception.
In many jurisdictions, transitioning to an energy-based primary adequacy criterion will take time. The industry has decades of experience and familiarity with LOLE. Capacity market requirements and resource procurement decisions in most regions are predicated on this historically accepted metric. Despite its shortcomings, familiarity and the inertia of previous planning efforts and decisions keep LOLE entrenched as the resource adequacy metric of choice. Fortunately, EUE and LOLE are currently well correlated in most regions. It is not until variable renewable energy and energy-limited resources become an ascendant source of a system’s capacity that the relationship between EUE and LOLE may begin to misalign and cause issues. A first step towards greater emphasis on unserved energy for a system currently focused on event-period performance may be to simply calculate and report both types of metrics.
4.2. Report a suite of metrics
While unserved energy metrics may be better positioned to capture many dimensions of system performance, they still ultimately only report a single number. As discussed previously, this loss of information can lead to ambiguity in the interpretation of results, and overreliance on a single adequacy indicator has the potential to obfuscate elements of system risk that may be of interest to stakeholders.
Take, for example, the rolling blackouts experienced in California during August 2020 [9] and those experienced in Texas in February 2021 [10]. Both were resource adequacy events but can be characterized very differently depending on the metric used. As shown in Table 1, on a days-of-shortfall basis (LOLE), the California and Texas events are somewhat similar, but when using LOLH or EUE, there is a clear difference, illustrating how overreliance on a single metric can skew the characterization of an event and have serious implications for decision-making around mitigations.
| Event Characteristic | Metric Affected | Event | Difference | |
|---|---|---|---|---|
|
| California August 2020 | Texas February 2021 |
|
Number of days | LOLE | 2 days | 4 days | +200% |
Number of events | LOLEv | 2 events | 1 event | -50% |
Number of hours | LOLH | 6 hours | 71 hours | +1,200% |
Unserved energy | EUE | 2,700 MWh | 990,000 MWh | +36,700% |
Maximum shortfall |
| 1,072 MW | 20,000+ MW | +1,766% |
While the table above illustrates the differences in our understanding of two specific events, similar discrepancies can appear across a full resource adequacy analysis that summarizes thousands of simulations. For example, a system with more frequent but much smaller events can appear much worse from a LOLE perspective than a system with less frequent but much larger events.
When system planners recognize the potential for correlated events, often due to the underlying weather, insights in addition to those offered by LOLE become important, because anomalous weather, while infrequent, can lead to large and long-duration events. This is true in fossil-based systems, where extreme cold can affect gas supplies and plant performance and becomes increasingly important in systems with higher shares of wind and solar.
Traditional analysis may not accurately characterize a widespread weather event like the Texas event, when vast amounts of generation resources were forced offline due to weather and constrained fuel supplies, and if it did, even an event of this size can be obscured within the average metric reported. The use of metrics like EUE can help quantify the size of shortfall events and provide better insights into such low-probability, high-impact events as well as more frequent, less disruptive shortfalls.
4.3. Study full outcome distributions and quantify tail risks
One limitation of all conventional resource adequacy risk metrics is that they are expected values. While resource adequacy analysis may consider a wide range of probabilistic outcomes, these results are usually averaged and reported as a single value. This can mask the potential for unacceptable system performance under outlier tail events.
Resource adequacy analysis is analogous to an insurance policy in that we voluntarily incur an expense that only delivers a service in rare, extreme circumstances. Planners, regulators, and ratepayers are accustomed to paying a premium for surplus capacity resources that are available to operate only on rare occasions. However, insurance is not intended to cover ‘average’ operations, but rather worst-case scenarios. It seems reasonable to suggest that resource adequacy analysis should consider performance under these kinds of scenarios as well.
For example, Belgium uses a two-part reliability criterion based on event-hours [11], which tests both the average count (LOLE of at most 3 event-hours/year) as well as the 95th percentile count (‘LOLE95’ of at most 20 event-hours/year) and is intended to ensure that the system has enough resources to perform acceptably even in a statistically abnormal (1-in-20) year. Both the average and 95th percentile criteria need to be satisfied for compliance with the regulators’ requirements.
There is additional nuance to the issue of tail metrics, however. As discussed previously, the finance literature has established that percentile based (VaR) risk metrics have certain vulnerabilities and has developed CVaR as a coherent alternative. As an example of a potential issue, consider the case where a system has no dropped load through the 95th percentile of outcomes, but then experiences 60 event-hours of load dropping in each scenario past the 95th percentile. Using the Belgian criteria, this system should technically be considered resource adequate (3 event-hours/year average, and 0 event-hours/year at the 95th percentile). However, a ‘1-in-20’ year will almost certainly result in 60 hours with system shortfall. Does this really satisfy the spirit of the adequacy criterion? The CVaR metric solves this issue by calculating the average outcome across all scenarios at and beyond the 95th percentile, in this case reporting a tail risk of 60 event-hours/year instead of zero.
Presenting a range of outcomes can also be used to estimate the number of times an emergency resource may be called on in a given year. Emergency resources may include reserve violations, voltage reduction, limiting exports, demand response programs, or backup generators. While most years may have no utilization at all, it is important to understand the potential number of calls that could be required, because it may be important for resource pricing (in the case of demand response) or air permits (in the case of backup generators).
Full-distribution assessments can help ensure that the power system is not exposed to high tail-end risk when the average result is close to, but still below, the criterion. Whether system planners and regulators use a two-part reliability criterion or not is less important than ensuring that decision making takes into account the potential for tail risks and the distribution of shortfall events.
4.4. Examine the nature of individual shortfall events
While aggregate risk metrics are useful for understanding the overall adequacy of a power system, they provide very little information about the nature of individual events and the kinds of mitigation strategies that may be appropriate if system risk is deemed too high. Characterizing the size, frequency, duration, and timing of discrete shortfall events can provide this information, better informing planning activities or capacity market design.
Data visualization serves as an important tool in studying these kinds of results, given their higher-dimensional nature. The following charts were derived from simulations of a hypothetical power system under increasing amounts of variable renewable energy integration, additions to energy limited resources (battery storage and demand response), and conventional fossil retirements. Each scenario was adjusted to have the same LOLE of 0.1 days per year to illustrate that not all reliability metrics are the same, and that average values can be misleading.
Figure 2 compares the event duration (hours) on the x-axis against the maximum shortfall of each event (MW) on the y-axis. To provide additional insight, color is used to layer the total amount of unserved energy (MWh) from the event, adding a third dimension to this two-dimensional chart. A histogram is then added to the x-axis to show the distribution of event durations (a similar histogram could be added to the y-axis).
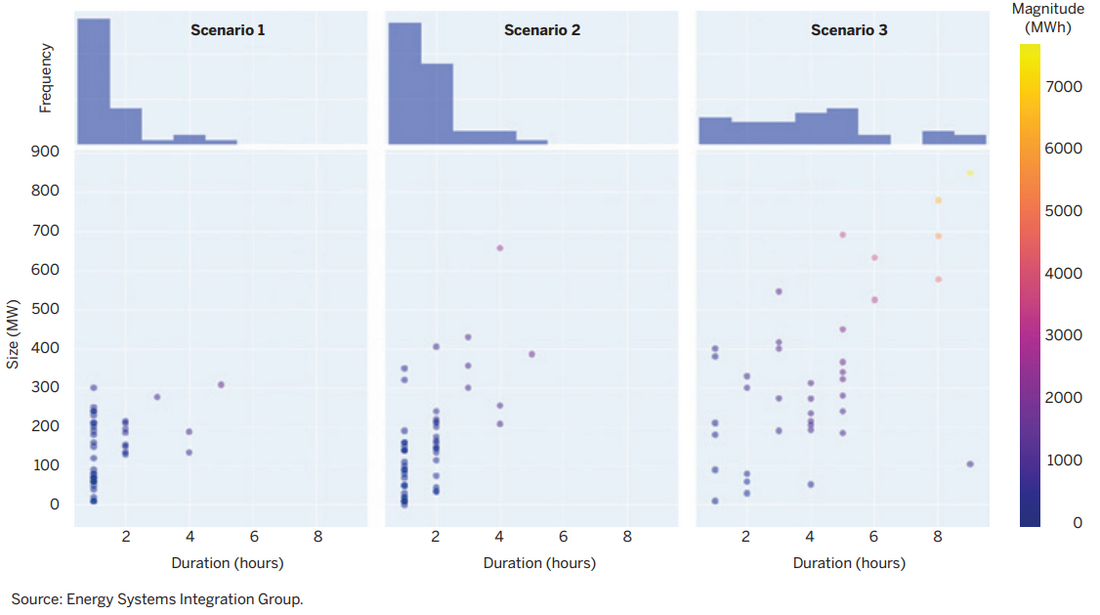
Figure 2 - Scatter plots and histograms of size, frequency, and duration of shortfall events under three LOLE-equivalent scenarios
Each data point represents a single event which, in this example, also represents a single day of lost load because none of the events started in one day and ended in another. The total number of dots (relative to sample size) shows the frequency of capacity shortfall events. Because all of these scenarios have a reliability of 0.1 days/year, the number of dots is the same in each.
Histograms have the notable benefit of identifying outlier events in resource adequacy analysis that would otherwise be missed. If, for example, a single shortfall event occurred that lasted multiple days instead of hours—as did the 2021 winter event in the Electric Reliability Council of Texas (ERCOT) – a measure of average event duration may fail to capture this, but it would be clearly conveyed in the histogram data visualization approach.
While the chart may take time to interpret, it provides a plethora of information and provides additional insights that are important for reliability planning. First, it becomes clear that not all reliability events are the same, and there can be a wide range in event magnitude and duration between systems that have the same LOLE. Second, in the low renewable penetration case (scenario 1), the vast majority of shortfall events are less than two hours, and most are only a single hour or less, showing that short-duration resources can be very effective at mitigating reliability risk. However, the chart also shows that in scenario 3—with the greatest number of fossil retirements and highest reliance on energy-limited resources—shortfall duration is more uniformly distributed and includes longer and larger events, even when the overall frequency of events is the same. This clearly shows the limitation of designing a system solely to a LOLE target of 0.1 days/year.
Equally important to understanding the size, frequency, and duration of resource adequacy shortfall events is additional understanding into the timing of shortfalls. Figure 3 characterizes the month of shortfall (x-axis) and the hour of day of shortfall (y-axis).
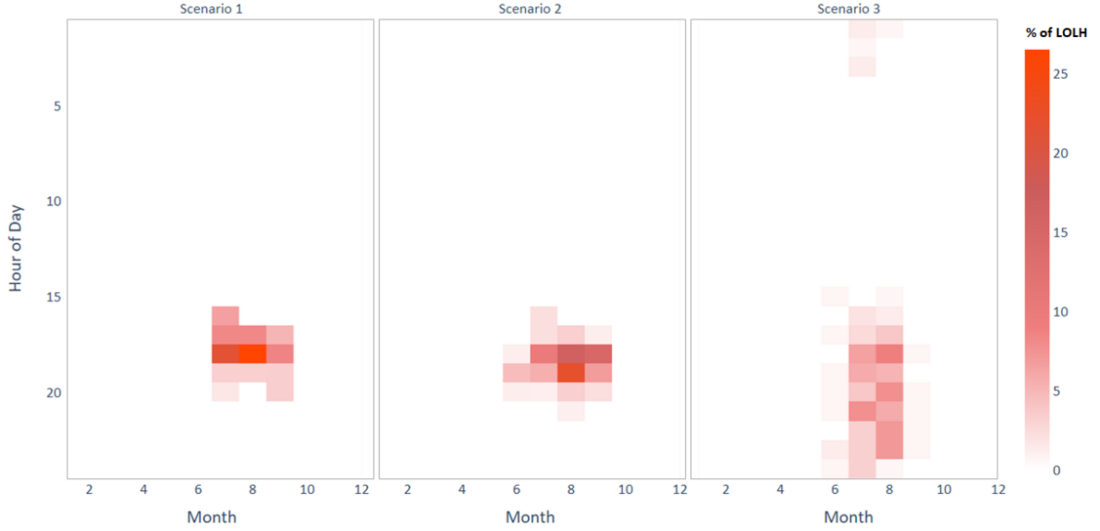
Figure 3 - Heatmaps of resource adequacy event timing under three LOLE-equivalent scenarios
For example, in scenario 1, 25% of all shortfall events occur in hour 18 (6 PM) in August, and nearly all shortfalls occur in three evening hours of the summer months. In the later scenarios, as the system increasingly relies on energy-limited resources, the timeframe of capacity shortfall events changes. Events occur later in the evening as solar pushes out the evening peak load. Events also become wider and more spread out as storage and energy-limited resources saturate.
This type of chart shows that the periods of risk can change as the system resource mix changes. It also highlights that mitigation strategies can be narrowly targeted to focus on specific hours and seasons, which is especially important when comparing load flexibility and variable renewable energy resources against other alternatives.
These charts, and related analyses that characterize the size, frequency, duration, and timing of individual reliability events, are critical components of resource adequacy analysis for modern power systems, particularly when dealing with large shares of variable renewable energy and energy-limited resources. An increase in variable renewable energy can shift time periods of risk away from solely peak load conditions, making it critical to track the timing of events. Likewise, increased reliance on energy storage and demand response requires planners to know the size and duration of events to ensure that resources are right sized for the reliability risks present on the system.
5. The communications challenge: maintaining simplicity without sacrificing rigor
All of these steps forward for resource adequacy metrics will require expanding, or at least adapting, the quantitative results that must be communicated to non-technical regulators and other stakeholders. This presents a distinct challenge and likely constrains the degree of technical complexity that is possible when attempting to describe the increasingly complicated nature of power system adequacy.
At the same time, it is important that power system planners and stakeholders work in collaboration to understand the complexities of modern resource adequacy assessments. It will be important to deliberately consider the many dimensions of a system’s adequacy needs and performance, and carefully select the most informative indicators. Over time, these indicators will ideally develop into a set of dependable and well-understood heuristics that can be used to assess system adequacy. Even then, however, system planners and the stakeholder community will have the shared responsibility of ensuring that criteria simplifications made do not compromise the rigor needed to model the true complexity of adequacy requirements in the presence of high penetrations of variable and energy limited resources.
Conclusion
Resource adequacy analysis must change alongside the evolving resource mix. Increased attention to correlated outages and extreme weather requires new modeling approaches, and greater reliance on variable renewable energy, energy storage, and load flexibility brings with it increased complexity. However, the evolving resource mix also affords more flexibility, where the grid’s supply and demand can be balanced from both sides.
The metrics and reliability criteria used by system planners must also evolve. Building on existing resource adequacy risk metrics and drawing on knowledge from other risk-aware fields, we propose four potential steps forward that practitioners can take to improve the effectiveness of adequacy metrics in their analyses: emphasizing normalized unserved energy, reporting a suite of metrics, quantifying distributions and tail risks, and examining the nature of individual shortfall events. While each of these areas presents opportunities for increasing the rigor of adequacy analyses, they also present visualization and communication challenges, which must also be addressed.
Acknowledgment
The authors would like to acknowledge funding from the Energy Systems Integration Group and support from ESIG Resource Adequacy Task Force.
References
- Redefining Resource Adequacy Task Force. Redefining Resource Adequacy for Modern Power Systems. August, 2021. https://www.esig.energy/wp-content/uploads/2021/08/ESIG-Redefining-Resource-Adequacy-2021.pdf
- NERC Probabilistic Assessment Working Group. Probabilistic Adequacy and Measures. (2018, https://www.nerc.com/comm/PC/Probabilistic%20Assessment%20Working%20Group%20PAWG%20%20Relat/Probabilistic%20Adequacy%20and%20Measures%20Report.pdf)
- IEEE Resource Adequacy Working Group. Clarifying the Interpretation and Use of the LOLE Resource Adequacy Risk Metric. (TechRxiv, 2021, https://doi.org/10.36227/techrxiv.17054219.v1)
- Kanoun, K., & Spainhower, L. Dependability Benchmarking for Computer Systems. (IEEE Computer Society / Wiley, 2008)
- Jorion, P. Value at Risk: The New Benchmark for Managing Financial Risk (3rd Ed). (McGraw Hill Professional, 2006)
- Artzner, P., Delbaen, F., Eber, J. M., & Heath, D. Coherent measures of risk. (Mathematical Finance, 9(3), 1999, 203-228)
- Acerbi, C., & Tasche, D. Expected shortfall: a natural coherent alternative to value at risk. (Economic Notes, 31(2), 2002, 379-388)
- Australian Energy Market Commission. Reliability. (December 2021, https://www.aemc.gov.au/energy-system/electricity/electricity-system/reliability)
- California Independent System Operator. Final Root Cause Analysis: Mid-August 2020 Extreme Heat Wave. 2021. http://www.caiso.com/Documents/Final-Root-Cause-Analysis-Mid-August-2020-Extreme-Heat-Wave.pdf
- Electric Reliability Council of Texas. Preliminary Report on Causes of Generator Outages and Derates During the February 2021 Extreme Cold Weather Event. April, 2021. http://www.ercot.com/content/wcm/lists/226521/ERCOT_Winter_Storm_Generator_Outages_By_Cause_Updated_Report_4.27.21.pdf.
- Elia Group. Adequacy and flexibility study for Belgium, 2020-2030. (2019, https://economie.fgov.be/sites/default/files/Files/Energy/Adequacy-and-flexibility-study-for-Belgium-2020-2030-Elia.pdf)
- [1] Expected unserved energy (EUE) is also sometimes called expected energy unserved (EEU) or expected energy not served (EENS)