C6 - Congestion Management in Distribution Systems with Large Presence of Renewable Energy Sources
Authors
M. LUNDBERG, O. SAMUELSSON - Lund University, Sweden
M. MIRZ - RWTH Aachen, Germany
E. HILLBERG - RISE Research Institutes of Sweden
N. HANCOCK - E. ON Energidistribution, Sweden

Summary
Congestion is a major limiting factor preventing expansion of renewable energy production in distribution networks. However, with large shares of connected power electronic-interfaced generators in combination with new types of controllable loads, such as electric vehicles (EVs), there is a potential to greatly increase network operation flexibility. Utilising these available flexible resources effectively is crucial to boost network capacity in a cost-effective manner and allow for safe integration of additional renewable energy sources (RESs).
In parallel, the reactive power flows in distribution networks are changing. This can be attributed to the increased RES production and increased charging currents due to expanding cable networks. Also contributing to the changing flows is the rising number of new household appliances and consumer electronics with non-linear load characteristics. This makes systemwide coordination of resources an even more pressing issue. For distribution system operators (DSOs), minimising undesired reactive power flows at the connection to the transmission system is key to meet inter-network requirements.
In this paper we propose a centralised near real-time control algorithm for combined congestion management and reactive power control in distribution networks. Through updated communication and measurement protocols, together with more extensive use of the active and reactive power control capabilities of local flexibility resources – such as wind power plants (WPPs), photovoltaic (PV) units, and flexible loads – bottlenecks can be detected and eliminated. Flexibility is offered by local resources and dispatched by the DSO through a common platform, which is independent of any specific financial arrangement for the participating flexibility providers. Thus, market solutions and individual contractual agreements are not mutually exclusive and can be implemented in parallel. The inclusion of reactive power simplifies the DSO’s coordination of intra-network and inter-network operational requirements. We demonstrate selected algorithm features through simulations of a congestion scenario in a medium voltage benchmark network. Aspects of deploying the solution in actual distribution network operation are also outlined.
Keywords
Distribution networks - congestion management - reactive power control - renewable energy - flexibility - control algorithm - TSO-DSO coordination - Active Network Management1. Introduction
In distribution networks, congestion characteristically occurs at the beginning of radial feeders and has historically been caused by high demand. If not managed, the thermal limits of overloaded network components might be exceeded, with resulting material degradation or permanent equipment damage. Standard congestion mitigation practices are derived from worst-case load scenarios and span from grid reinforcement to financial agreements with large customers for power reduction [1]. While transmission network capacity constraints are considered when the market clearing price is determined [2], local bottlenecks in the distribution networks are treated separately by the respective DSO.
As smart electricity meters and remote terminal units (RTUs) are becoming more frequent in distribution networks, DSOs are increasingly able to monitor the operational status of the network in near real-time. Not only can congestion then be tracked with greater temporal and spatial resolution, but the establishment of remote communication protocols means dispatch signals can also be distributed to generators, EV charging stations, and other distributed energy resources. This creates a foundation for a more flexible, and potentially market-driven, network operation, including congestion management, which improves grid utilisation and reduces capital expenditure (CAPEX). Several local flexibility concepts that include this idea have been developed [3]–[5]. The flexibility usage in the proposed models can typically be divided into three applications [6]: market-oriented use, grid-oriented use, and system-oriented use. While the first application concerns energy market trading under no-constraint conditions (e.g. by aggregators), the latter two are important from a operational security perspective as they involve the use of flexibility to maintain safe operation of the local distribution network (grid-oriented use) and the provision of balancing and ancillary services to the overlying transmission network (system-oriented use). In case of congestion the DSO must secure sufficient flexibility from local providers to manage it, either on a bilateral contractual basis or via a market-oriented approach. Since overloading also restricts the level of feasible inter-network ancillary service offers, the DSO should be given priority to clear local bottlenecks in case of conflicting standard operational requests from the transmission system operator (TSO) or other DSOs [7].
In distribution grids where a moderate number of wind power plants and photovoltaic units are connected, network operating conditions can be positively affected. However, as RES penetration increases, reverse power flows appear during times when high production coincide with low consumption. This poses a challenge to existing distribution grids, which are not dimensioned for reverse power flows. Improving the operational margins to manage the temporary congestion using conventional grid reinforcement becomes an increasingly expensive option due to the peaked duration curve of the intermittent RESs. The increased planning uncertainty brought by the rapid RES expansion in combination with the slower pace of reinforcement measures also makes it difficult for DSOs to adequately design and timely implement physical network upgrades [8]. Thus, there is a particular need for alternative methods that in a cost-effective manner permit safe and rapid RES integration while making it possible to defer or eliminate grid reinforcement. The introduction of power electronic-interfaced generation units enables implementation of faster, and more flexible control methods, which in turn allows for safely reducing operational margins, a key aspect in increasing the RES penetration level.
Reactive power is used by both DSOs and TSOs for voltage management [9], [10]. Historically, there has been limited coordination of the reactive power resources between operators. However, current EU-regulations [11] require DSOs and TSOs to agree on the reactive power set point at the TSO-DSO interconnection during normal operating conditions. The reduction of the number of large synchronous generators in many transmission networks in recent years has forced TSOs to utilise static var compensators (SVCs) and static compensators (STATCOMs) for reactive power control to a greater extent. The simultaneous increase of the number of RESs in distribution networks has expanded the capacity to provide local ancillary services to the overlying grid [12]. In the UK, Australia, and in several EU-countries, TSOs can procure reactive power compensation directly from RES owners at the distribution network level, or indirectly via a DSO. This is done through various regulatory requirements and settlement rules, see e.g. [13], [14].
The large penetration of RES also affects the distribution network feeder voltage profiles. This complicates the reactive power balancing for DSOs as extensive and uncoordinated use of reactive power for voltage control purposes contributes to network congestion. There is also a risk that the flow of reactive power at the transmission network interconnection will increase above the agreed limits. By integrating reactive power control in a congestion management scheme these issues can be mitigated.
2. Congestion management control algorithm
In this section a proposed algorithm for congestion management is discussed in detail. The algorithm consists of five successive modules: configuration of available flexibility; bottleneck detection; determination of appropriate control actions; flexibility dispatch; and distribution of new set points.
2.1. Configuration of Flexibility Resources
Information about the location of the flexibility providers and their accessibility must be made available to the DSO in advance so that adequate resources can be activated in case of congestion. Thus, the configuration of resources is primarily an offline process that involves securing contractual agreements and establishing communications infrastructure. The central controller (see Section 2.3) does not require a detailed network model, but information on the network topology must be available for the distribution of set points. If real-time active and reactive power measurements from flexibility providers are made accessible, individual set points can be adjusted with high accuracy during operation, but – as shown in Section 2.4 – it is sufficient to obtain predefined generator limits and rely on one-way communication with flexibility resources in real-time. If an (arbitrary) intra-day or day-ahead flexibility market is implemented in parallel, resulting market-cleared set points should be included as references for the congestion management algorithm, which will act to correct deviations in forecasted power flows.
In this paper we assume that the algorithm is used in a three-phase radial distribution network dimensioned for a worst-case load situation, but where significant amounts of RESs have been installed so that congestion management is needed to avoid overloading from the reversed flow. Therefore, any congestion created by RES production is guaranteed to be managed if all generation units are fully participating in the flexibility scheme. From here on, it is assumed that all resources are balanced three-phase loads and generators. The algorithm can be extended to unbalanced systems by treating each phase separately using the same procedure.
2.2. Bottleneck Detection
The thermal limit of a network component is typically defined indirectly by its rated power or current. Thus, though direct measurements of currents and voltages at locations where network analysis shows a risk of overloading, bottlenecks can be monitored. Loading limits can also be determined dynamically through e.g., dynamic line rating (DLR) or dynamic transformer rating (DTR) where temperature measurements are used, which captures the impacts of changing environmental factors such as ambient temperature, solar radiation, and wind speed and direction. The algorithm proposed in this paper is technology neutral with respect to congestion detection, as the control module – presented in Section 2.3 – manages congestion at different locations separately.
2.3. Central Feedback Controller
The congestion controller consists of a simple discrete-time PI controller. An incremental version (1) is used in this paper, such that
(1)
In (1), e is the controller input, u the output, and K, T and TI design parameters. At each time-step tk, the loading of a monitored component in the network is compared with its static or, if available, its dynamic loading limit. For simplicity, we assume here that the current magnitude at a branch connected to node , is the measured quantity and
the rated current of the monitored power line or transformer connected to node n. The controller input is then
. Observe that if measurements are normalised using a static limit or an instantaneous dynamic limit, the relative error is used as input in (1).
The controller output is the total active power change to be distributed among the available flexibility resources at time tk. It is assumed that the process of collecting measurements and computing new set points is synchronised and fast relative to the sampling time, and that the system reaches steady state before the next sampling instance. The controller should not act when the current is within the acceptable operational limits, and the output is therefore limited so that
(2)
where is the limited output signal. As the congestion is assumed to be caused by RES generation, the active power change consists of RES curtailment and load increase. An anti-windup scheme is then added to improve performance of the controller integrator.
Each congestion monitoring point is treated individually by the controller. In practice, if normalised measurements are used, this is equal to having multiple identical controllers in parallel operation. For congestion monitoring of n nodes, it corresponds to replacing the variables u(⸱), e(⸱), in (1) with the n×1 vectors u(⸱), e(⸱). If the n monitored nodes are located on n different radial feeders, there will also be n unique controller outputs. If the monitored nodes 1,…,m, where m<n, are located on the same feeder, the most severe bottleneck is managed first. This is done via the flexibility dispatch.
2.4. Flexibility Dispatch
Only the flexibility resources connected ‘downstream’ from a bottleneck caused by RES production can be considered for congestion management. The relative location of a flexibility resource is used to create a ranking list for each monitored congestion point. The ranking list contains information on the number of available resources, the amount of flexibility provided by each participant, and an individual power reference for each unit. Flexibility resources are ranked according to a predefined merit order. Alternatively, weighted parallel control actions can be assigned to all participants.
Merit order can be defined by lowest activation cost, which is determined by the implemented financial scheme. Using other minimisation criteria is also possible, e.g., minimisation of curtailment, which implies the use of flexible loads before activation of RES flexibility. A third way of defining the merit order is basing it on power transfer distribution factors (PTDFs), which indicate the effectiveness of using resources at a certain network node with respect to the point of congestion. PTDFs are typically used in transmission system analysis and give a linearly approximated impact of a change of a nodal power injection on the line flows.
Dispatching of individual set points for a single sampling instance is done by sequentially transferring resources from the ranking list to a temporary dispatch list until the required control effort is covered. The assigned control signals are then distributed to resources on the dispatch list. Flexibility dispatch for a single sampling instance, based on merit order, is done as shown in Figure 1. The active power set point of each resource is adjusted with respect to an individual reference. If the instantaneous uncontrolled active power is known it can be used as reference. For loads, this corresponds to a time instance on the uncontrolled load curve. For individual PVs and WPPs it is possible to estimate the
maximum instantaneous power production, but the technology is rarely implemented in smaller generation units [15], [16]. However, the reference power can also be defined as the rated power of the flexibility resource, a set point derived directly from a forecasting model, or indirectly from the market clearing price at a local flexibility market.
There are several factors that limit the available flexibility, including instantaneous active power production (maximum curtailment limit of RESs), and contractual limits. The strictest of the known flexibility limits is applied by the algorithm. If information about instantaneous flexibility limits is not communicated to the common platform, predetermined values are applied. The dispatch list is updated sequentially according to merit order until the required active power change is reduced to zero. For resources connected down-stream from multiple monitored nodes, several set points are computed, i.e., multiple instances of the algorithm in Figure 1 are run in parallel. In such cases, the set point corresponding to the largest flexibility usage is selected.
Another method to dispatch flexibility is through a weighted allocation of set points. Through a weight function, the required power adjustment can be distributed relatively to the share of total flexibility provided by each resource. This method is exemplified in Section 3.
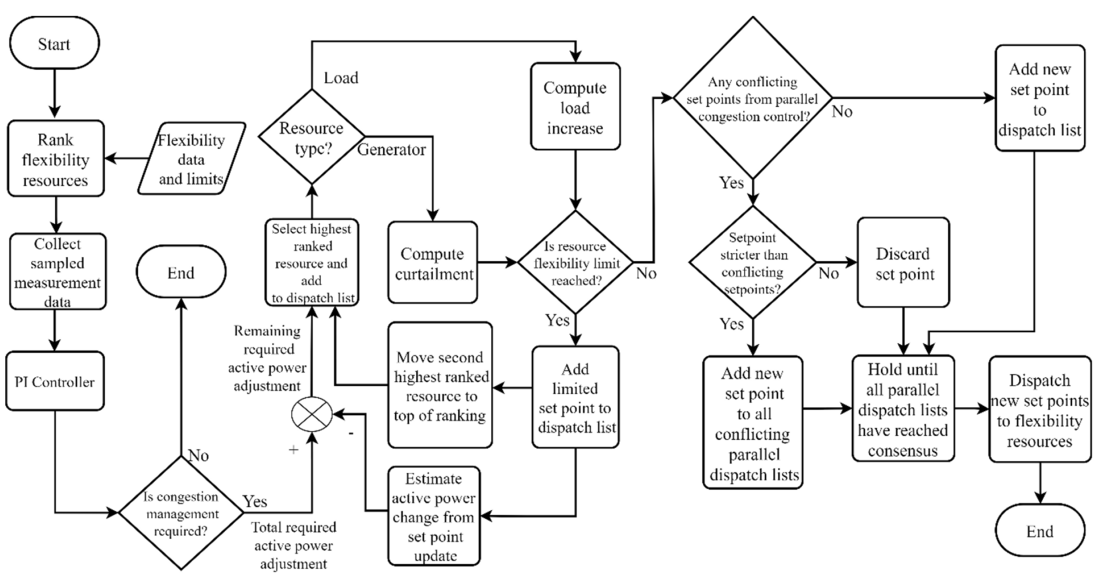
Figure 1 - Merit order dispatch algorithm for congestion management. The flow chart shows a single measurement sampling instance, a control response, and subsequent dispatch of new set points to available flexibility resources. For each sample, the resulting set point changes are obtained by traversing the ranking list until the total volume reaches the level determined by the PI controller.
2.5. Distribution of Set Points
The use of feedback control requires several subsequent set point updates to manage congestion. It is assumed that all set point adjustments are stable and that the update intervals are long with respect to the resource inner dynamics time constants. Furthermore, any flexibility limits not communicated to the common congestion management platform are expected to be tracked by the local resource controllers. All conversions of active power set points to equivalent references, such as temperature set points, are in this paper assumed to be done locally.
3. Reactive power exchange control
The reactive power flow at the TSO-DSO interconnection can be controlled through an algorithm analogous to the congestion management algorithm. The controller limits are removed, and the input is changed to the measured reactive power or, equivalently, the measured current phase angles. The output is now the reactive power adjustment, δq. For simplicity we here assume there is only one TSO-DSO interconnection point, which gives a single ranking list that includes only the flexibility resources able to adjust their reactive power set points. If the congestion management and reactive power algorithms are to be combined, measures must be taken to avoid performance deterioration due to conflicting control objectives. For example, the reactive power controller should be activated after the operational limits imposed by the congestion management have been established. The accuracy of the activation scheme depends on the monitored congestion parameters. A conservative approach is presented in Figure 2, where no consideration to the direction of the reactive power flow is taken when the congestion limits are computed. The reactive power set point is determined with respect to the feeder congestion limit as well as all known individual limits, including local voltage control set points if available. In Figure 2, set points are dispatched so that the amount of adjusted reactive power output for each resource is relative to the share of its available flexibility.
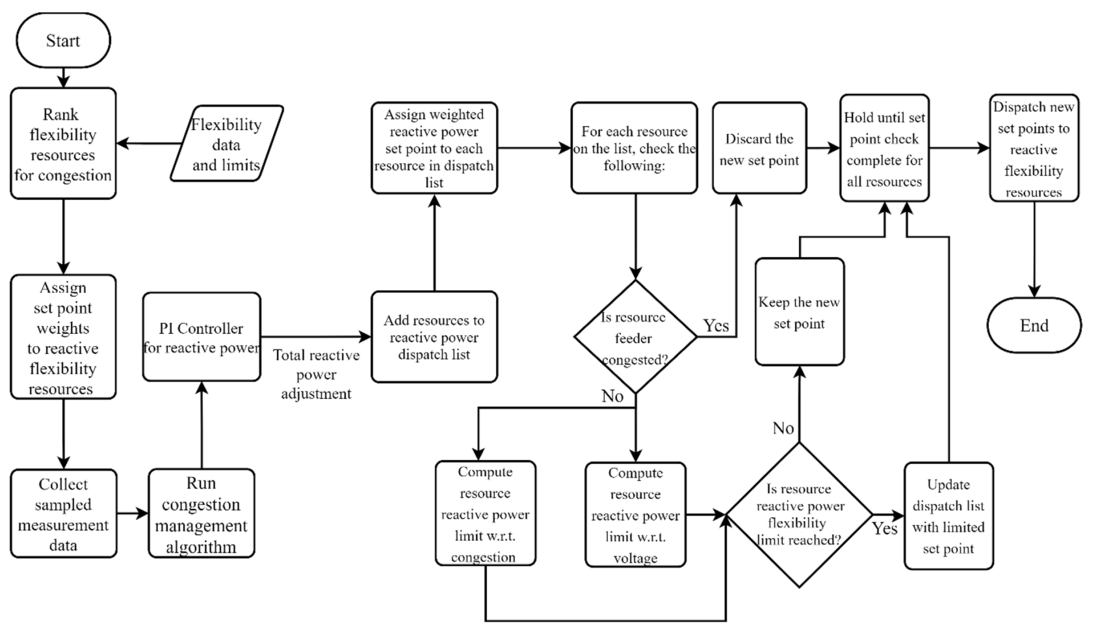
Figure 2 - Reactive power dispatch algorithm. Weighted allocation of set points is used. The flow chart represents a single measurement sampling instance, a control response, and dispatching of a single set point to one specific flexibility resource
4. Case study
The functionality of the proposed algorithm is demonstrated through simulations in DIgSILENT PowerFactory using the CIGRE European MV benchmark network [17]. Using iterative power flow computations, the quasi-dynamic behaviour of the algorithm is shown.
4.1. Test Network
The MV benchmark network shown in Figure 3 consists of two parallel 20 kV three-phase feeders, representing an urban grid with underground cables (feeder 1) and a surrounding rural area with overhead lines (feeder 2). The network is radially operated. To emulate an expected future European development with large penetration of renewables in distribution networks [18], RES units, corresponding to medium voltage WPPs and aggregated low voltage PV systems are added to selected model nodes, as shown in the figure. In some European regions, including parts of Germany, Spain, and Ireland, the installed generation capacity on the distribution network level already exceeds local peak demand [19].
A congestion scenario is created so that peak PV production coincides with moderate wind generation and low demand. Corresponding load and generation profiles have a 15-min resolution. It is assumed that all RESs are available as flexibility resources. Cables 1-2, 3-8, and overhead line 12-13 are monitored for congestion, with limits based on the rated conductor current magnitudes. The sampling time is set to 10 s, and interpolated power injection values are used as input.
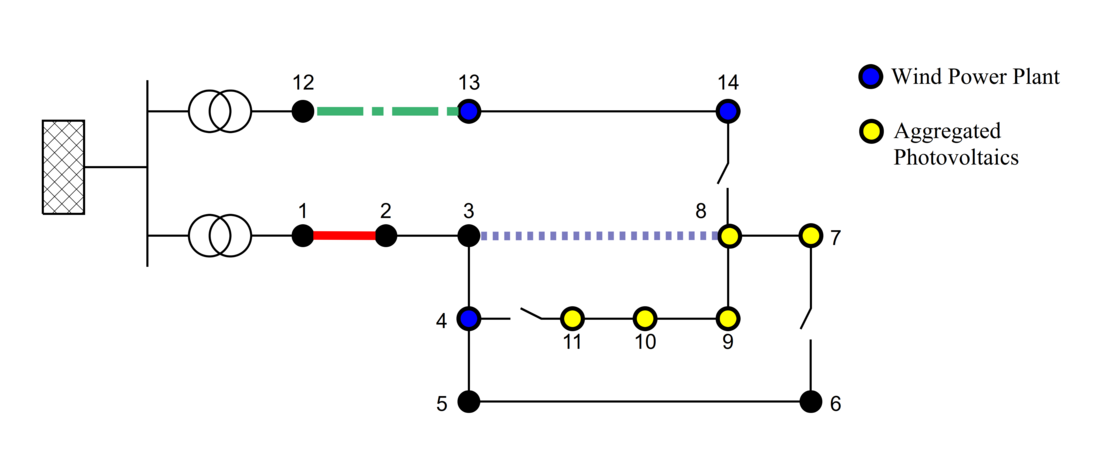
Figure 3 - Topology of CIGRE European MV benchmark network. Feeder 1 (starting at node 1) and feeder 2 (starting at node 12) are connected to separate 110/20 kV transformers. Loads are connected to all feeder nodes. The loads at nodes 1 and 12 represent parallel feeders not modelled in detail. Coloured lines are monitored for congestion.
4.2. Congestion Management
In the simulated scenario, without congestion management, the monitored cables 1-2 and 3-8 will experience overloading due to the large PV generation, as illustrated in Figure 4a. When the congestion management algorithm is active, two ranking lists are generated for the distribution of the control signals. Initially no flexible loads are active. Merit order is based on PTDFs with respect to each congested line during a modelled peak production case. As seen in Table 1, there is a locational influence on the PTDFs, but variations are small throughout the network. Thus, control signals could be distributed arbitrarily with limited negative impact on the total curtailment need. Note that static PTDFs are not necessarily representative of all operating conditions. In this example, a flexibility limit is introduced to activate multiple resources. This results in operating conditions shown in Figure 4b. At feeder 1, congestion is first detected on cable 1-2, which activates the ranking list in Table 1b. The successful management means measures to prevent overloading on cable 3-8 are restricted to a very short period. As the controller only reacts to loading constraint violations, an initial overshoot in the controller response is seen. However, the short duration of the small excess loading is well below the typical cable thermal time constant [20] and operational safety is therefore not compromised.
In Figure 5a, the activated flexibility corresponding to the operation scenario in Figure 4b is shown. Initially, congestion is managed by solely controlling the WPP at bus 4. To avoid overloading on cable 3-8, PV flexibility at buses 8 and 9 is activated. The limitations at bus 8 results in a larger share of the curtailment is allocated to bus 9. To exemplify the effect of the inclusion of flexible loads on curtailment, the simulation scenario is updated so that aggregated load flexibility is introduced at all buses in feeder 1, limited to 20 % of the maximum load at the respective bus. Individual resources, such as battery energy storage systems, EV charges or heat pumps can have very different rate-of-change of power capabilities. Here, an average rate-of-change of 10 % of the aggregated maximum power per bus and 10 s is used.
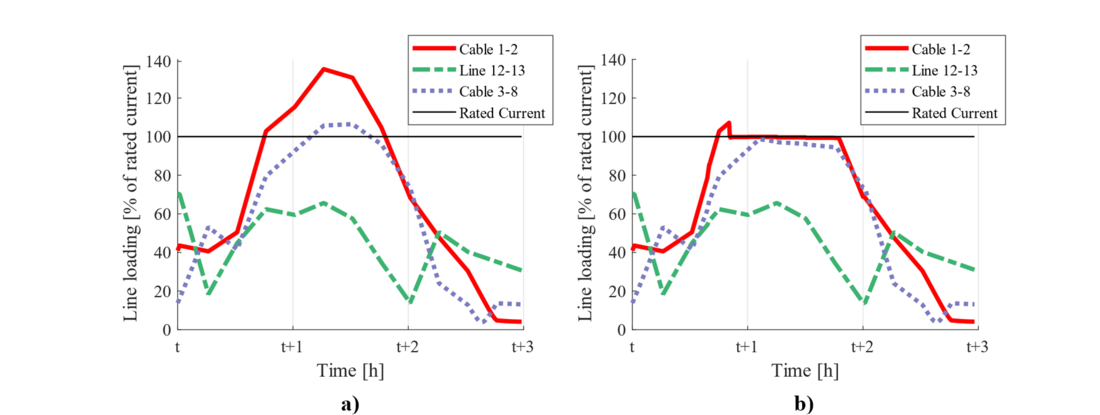
Figure 4 - Loading of monitored overhead lines and cables in the CIGRE MV test network shown in Figure 3, during simultaneous peak PV production, moderate WPP production, and low demand. A three-hour period simulated for two cases: a) uncontrolled network operation, b) congestion management algorithm active.
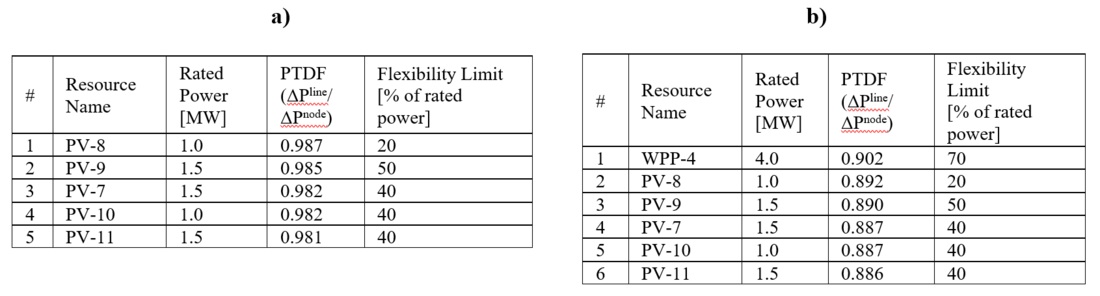
Table 1 - Ranking list for a) cable 3-8 and b) cable 1-2 of the CIGRE MV benchmark. The power transfer distribution factor is interpreted as the change in power flow in MW in a line caused by a 1 MW change at the power injected at the respective node.
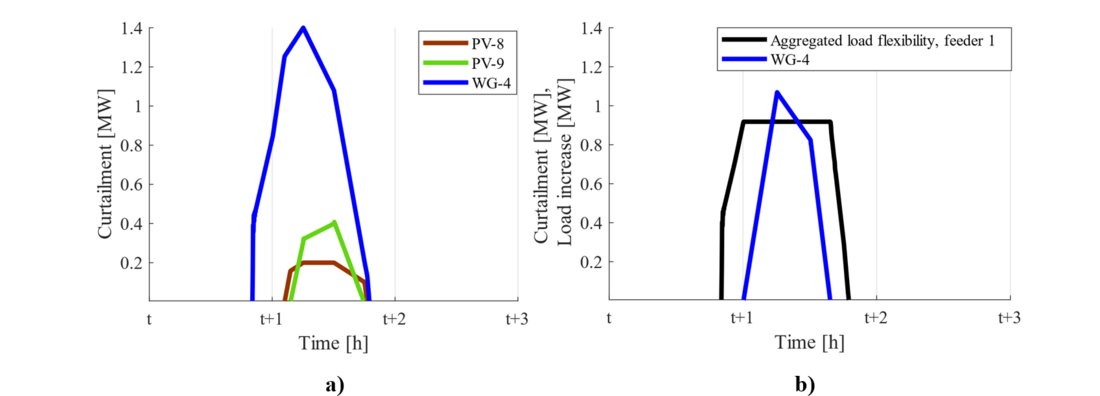
Figure 5 - Dispatched flexibility for the simulated operation of the CIGRE MV test network, shown in Figure 4b. Two scenarios are presented: a) only generation flexibility active, b) both load and generation flexibility active.
The ranking lists are updated so that all load flexibility, regardless of the PTDF, must be used before RES flexibility is activated. As seen in Figure 5b, the inclusion of load flexibility eliminates the PV curtailment in the simulated scenario. The WPP at bus 4 is now used first when the load flexibility reaches the limit, and curtailment is therefore reduced.
4.3. Reactive Power
The algorithm is extended to include control of reactive power at the TSO-DSO connection.
All flexible power electronic-interfaced generators are assumed to be able to provide at least a 0.95 power factor, leading or lagging, at all normal operating conditions. For flexible loads, only active power adjustments are considered and are consequently not included in the reactive power ranking list. As we know from Figure 4a, the monitored overhead line on feeder 2 is operated well below the congestion limit, so we select only the WPPs at feeder 2 for dispatch. This means the two WPPs are effectively tasked with balancing the entire reactive power demand from the distribution network, shown in Figure 1, as well as all parallel feeders not shown in the figure (starting from node 1 and 12 respectively). The dispatch is made through weighted allocation of the control signal so that the WPP at bus 13 (rated 3 MW) and the WPP at bus 14 (rated 6 MW) adjustments depends on the rated power of each unit relative to the total installed capacity. As seen in Figure 6a, the reactive power flow at the TSO-DSO connection is eliminated by the dispatched flexibility, while the line 12-13 is still operated within the allowed current range. In Figure 6b the individual distribution of reactive power adjustments dispatched by the algorithm is seen. Since WPP-14 has twice the power rating of WPP-13, the magnitude of the control signal is doubled. No voltage control limitations have been included in this example. However, for the simulated scenario the voltage always remains within ±0.1 pu.
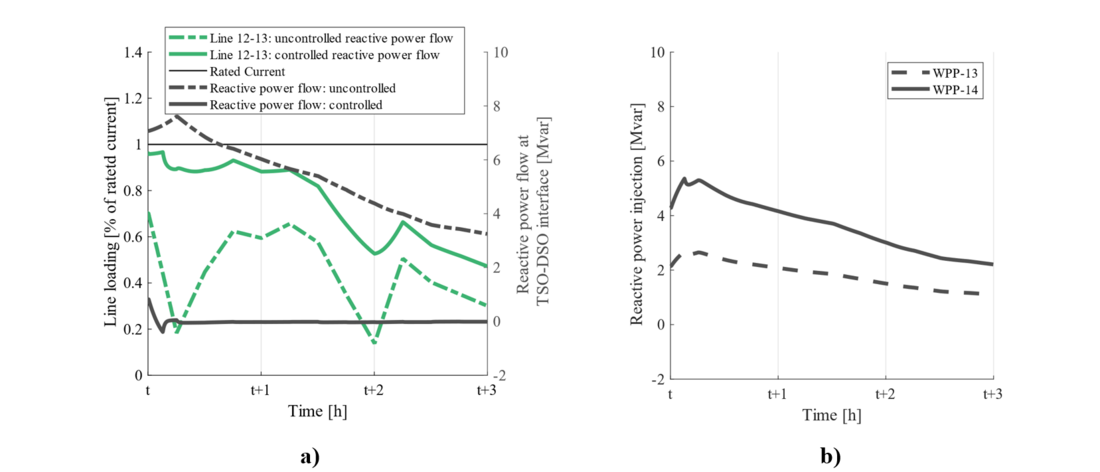
Figure 6 - Simulation of reactive power control in the CIGRE MV test network, shown in Figure 4b. In a) loading of monitored overhead line at feeder 2 (in green) and reactive power flow at TSO-DSO interconnection (in grey). In b) utilisation of generation flexibility resources at feeder 2.
5. Deployment considerations
As a part of an ongoing European research project [8] on active network management (ANM), the adaptability and scalability of the algorithm is to be demonstrated in use in distribution networks in Sweden and Hungary. An increased degree of automation of the network operation is key to effectively deploy the algorithm. A toolbox for network planning and operation has therefore been developed to facilitate integration with existing DSO and customer interfaces, as well as standard communications protocols.
5.1. Toolbox for Planning and Operation
To facilitate the use of the algorithm in different contexts, it is implemented in the Python programming language. This allows the user to run the algorithm as a containerized service, on-premise or in an external cloud, to support the operation or to integrate it with other software tools when used in planning.
Figure 7 depicts both use cases as they are implemented in the frame of the demonstrations. In operation, the algorithm exchanges measurements and control set points with the grid assets via an HTTP interface. In combination with a grid simulation tool that features a Python interface, the impact of the algorithm can be investigated in the planning phase. Instead of processing real measurements, the algorithm is operating on simulation results in this case. This supports the decision-making process whether to invest in grid reinforcement or to rely on the algorithm to improve the utilisation of existing infrastructure.

Figure 7 - Overview of active network management demonstration architecture. The algorithm is deployed via a Python package to simplify integration in both operational and simulation environments.
6. Discussion and conclusions
In this paper, we have proposed a congestion management algorithm that utilises the flexibility of power electronic-interfaced renewable energy sources as well as loads to clear bottlenecks in distribution networks. Through feedback control and central dispatching of set points, the full capacity of power lines and cables can be used without a need for safety margins, and allocation of flexibility can be based on a variety of technical and financial schemes. The full impact of the choice of dispatching method on optimal operational performance remains an issue for further investigation, particularly the use of dynamic PTDF ranking for power loss reduction, as well as the possible integration a local flexibility market. While the proposed method has been developed to mitigate congestion caused by large RES production, the concept can potentially be adapted for the reversed case, i.e., congestion due to excessive demand, which is expected to become increasingly relevant as the sales of EVs continue to rise world-wide.
We have shown that the algorithm can be extended to include control of the reactive power flow at the TSO-DSO interconnection without compromising intra-network loading limits. In a simulated scenario, using the CIGRE European MV test network, it was demonstrated that the algorithm could manage congestion when simultaneous high production and low demand occurred. It was then shown that resources not participating in congestion management could be activated to limit the reactive power exchange at the TSO-DSO interconnection. A natural extension to the presented algorithm would be to include control of both active and reactive power at detected bottlenecks, which could reduce curtailment and increase the capacity for reactive power management. The interaction between the algorithm and any parallel voltage control schemes is also an important topic.
The algorithm has been integrated in a planning and operation toolbox for use in both simulations and actual operation. The modular set up of the algorithm and the flexible structure of the developed toolbox suggests the solution is highly adaptable and scalable, making it possible to adjust it to local DSO requirements and to deploy it in a wide range of legal and economic frameworks.
Acknowledgments
The work has been carried out within the framework of the ANM4L project [8], which is supported by EU H2020 grant agreement No 775970 through the ERA-Net SES initiative.
References
- S. Huang, Q. Wu, Z. Liu, and A. H. Nielsen, ‘Review of congestion management methods for distribution networks with high penetration of distributed energy resources’, IEEE PES Innovative Smart Grid Technologies, Europe, pp. 1–6, Oct. 2014.
- R. Liu, X. Wang, H. Zhao, and Y. Wang, ‘Distribution System Congestion Management Based on Local Flexibility Market’, 2021 ACPEE, pp. 1023–1029, Apr. 2021.
- I. Bouloumpasis, D. Steen, and L. A. Tuan, ‘Congestion Management using Local Flexibility Markets: Recent Development and Challenges’, 2019 ISGT-Europe, pp. 1–5, Sep. 2019.
- H. P. Khomami, R. Fonteijn, and D. Geelen, ‘Flexibility Market Design for Congestion Management in Smart Distribution Grids: the Dutch Demonstration of the Interflex Project’, 2020 ISGT-Europe, pp. 1191–1195, Oct. 2020.
- C. Madina et al., ‘Flexibility markets to procure system services. CoordiNet project’, 2020 17th International Conference on the European Energy Market (EEM), pp. 1–6, Sep. 2020.
- S. Ohrem and D. Teloken, ‘Concepts for flexibility use - interaction of market and grid on DSO level’, CIRED Workshop 2016, Helsinki, Finland, Jun. 2016.
- H. Hansen et al., ‘Coordination of system needs and provision of services’, 2013, pp. 1–4.
- E. Hillberg et al., ‘Active Network Management for All – ANM4L a collaborative research project’, Nov. 2020. doi: 10.13140/RG.2.2.27423.79525.
- K. Tang, R. Fang, L. Wang, J. Li, S. Dong, and Y. Song, ‘Reactive Power Provision for Voltage Support Activating Flexibility of Active Distribution Networks via a TSO-DSO Interactive Mechanism’, 2019 ISGT Asia, pp. 116–121, May 2019.
- D. S. Stock, S. Talari, and M. Braun, ‘Establishment of a Coordinated TSO-DSO Reactive Power Management for INTERPLAN Tool’, 2020 SEST, pp. 1–6, Sep. 2020.
- Commission Regulation (EU) 2017/1485 of 2 August 2017 establishing a guideline on electricity transmission system operation. 2017.
- A. O. Rousis, D. Tzelepis, Y. Pipelzadeh, G. Strbac, C. D. Booth, and T. C. Green, ‘Provision of Voltage Ancillary Services Through Enhanced TSO-DSO Interaction and Aggregated Distributed Energy Resources’, IEEE Transactions on Sustainable Energy, vol. 12, no. 2, pp. 897–908, Apr. 2021.
- K. L. Anaya and M. G. Pollitt, ‘Reactive power procurement: A review of current trends’, Applied Energy, vol. 270, Jul. 2020.
- ‘Survey on Ancillary Services Procurement and Electricity Balancing Market Design 2020’. ENSTO-E, May 2021.
- I. Elorza, C. Calleja, and A. Pujana-Arrese, ‘On Wind Turbine Power Delta Control.’, Energies, vol. 12, no. 12, p. 2344, 2019.
- A. Sangwongwanich, Y. Yang, F. Blaabjerg, and D. Sera, ‘Delta power control strategy for multi-string grid-connected PV inverters’, in 2016 IEEE ECCE, 2016, pp. 1–7.
- ‘Benchmark Systems for Network Integration of Renewable and Distributed Energy Resources’, CIGRE, TF C6.04.02, 575, 2014.
- R. Ciavarella, M. Di Somma, G. Graditi, and M. Valenti, ‘Congestion Management in distribution grid networks through active power control of flexible distributed energy resources’, presented at the 2019 IEEE Milan PowerTech, Jan. 2019.
- ‘Active Distribution System Management - A key tool for the smooth integration of distributed generation - Findings and Recommendations’. TF Active System Management, Eurelectric, Feb. 2013.
- V. Chatziathanasiou, P. Chatzipanagiotou, I. Papagiannopoulos, G. De Mey, and B. Więcek, ‘Dynamic thermal analysis of underground medium power cables using thermal impedance, time constant distribution and structure function’, Applied Thermal Engineering, vol. 60, no. 1–2, pp. 256–260, Oct. 20139.