D1 - Development and implementation of transformer condition monitoring models for the interpretation of sensor and SCADA data
Authors
P. PICHER, M. GAUVIN, L. VOULIGNY, A. ZINFLOU, E. FRENETTE, S. PROULX, C. RAJOTTE
Hydro-Québec, Canada

Summary
Hydro-Québec has implemented a digitalisation infrastructure that encompasses all key elements of the condition monitoring value chain: sensors, communication infrastructure, data collection, algorithms, user interface and actionable information. The digitalisation of condition monitoring helps to reduce the extent of failures, improve the effectiveness of diagnostics and actions (by reducing systematic maintenance and testing) and increase the availability of assets.
Data analytics were developed using a modular approach that covers the main failure modes of a transformer’s principal components: active part, cooling system, bushings and tap changer. Interpretation module data inputs are drawn not only from sensors specifically designed for transformer monitoring but also from substation SCADA systems. The algorithms used are based on physics, trend analysis and artificial intelligence technologies.
This paper describes the following interpretation module functionalities using real examples:
- Dissolved gas analysis (DGA) module: This module performs a dissolved gas-in-oil trend analysis over three time spans, with warnings issued whenever a threshold is exceeded.
- Moisture and ageing module: This physical model tracks moisture migration between solid insulation and insulating oil as a function of the internal temperature of the transformer. This phenomenon affects solid insulation ageing and real-time evolution of bubbling risk.
- Cooling system performance module: Physical models were investigated for this module. Since ambient temperature has a significant impact on thermal performance, it was decided to use neural networks (artificial intelligence) to estimate internal temperature as a function of load and ambient temperature. A warning is issued whenever measured temperature exceeds the temperature predicted by the neural network. An on-line learning algorithm is implemented to train and start the module automatically when sufficient data is available.
- Tap-changer module: This module analyses vibro-acoustic and motor current measurements, an approach pioneered by Hydro-Québec. This paper provides an update on developments in data interpretation.
- Bushing and voltage transformer module: This module analyses signals from parallel-connected substation devices and issues a warning whenever there is a significant deviation in measured signal amplitude or phase. For bushing monitoring, amplitude and phase of bushing tap currents are measured using a novel sensor that relies on GPS signals for phase synchronisation. For voltage transformer monitoring, the module relies on SCADA-supplied voltages.
One prerequisite for successful implementation of a digital transformation such as this is careful definition of the roles and responsibilities of the different stakeholders. A business unit team is responsible for implementing the interpretation modules and for generating anomaly warnings and developing and implementing a web interface to ensure all users have access to relevant data for more efficient assessment of the overall condition of assets.
Looking ahead, the digital transformation will foster development and implementation of asset digital twins. Real-time multiphysics (thermal, dielectric and mechanical) simulation of transformer behaviour and integration of digital twins into power utility operation and maintenance systems will require close collaboration not only of manufacturers and utilities but also of academic and research institutions.
Keywords
Transformer - Monitoring - Sensor - Analytics - Modelling - Digital twin - Artificial intelligence1. Introduction
Hydro-Québec’s power transformer fleet comprises more than 2 300 power transformers (generator step-up, transmission and distribution transformers) with a total installed capacity upwards of 200 000 MVA.
An online condition monitoring strategy has been implemented, with sensors installed on transformers to monitor selected parameters that provide useful condition assessment data. The transformation of measurement data into meaningful condition assessment information requires use of data analytics based on knowledge of the physical failure modes of a transformer’s main components (active part including solid and liquid insulation, cooling system, bushings and tap changer).
This paper presents an overview of the transformer on-line condition monitoring models developed and implemented in Hydro-Québec’s centralised monitoring centre and illustrates these models with real case examples. The advantages of the selected centralised monitoring approach, the main transformer failure modes addressed, and the related data sources are also reported.
2. Value chain for on-line transformer condition monitoring
As shown in [1], every element of the centralised monitoring value chain (Figure 1), from sensors to corrective maintenance actions, is essential to benefit from the on-line condition monitoring strategy. This paper focuses on the analytics used to generate actionable information. At the time of preparing this paper, about 500 power transformers with at least one connected sensor were available via the centralised monitoring system. This number will grow in the coming years, when more substations will be connected to the data acquisition system.
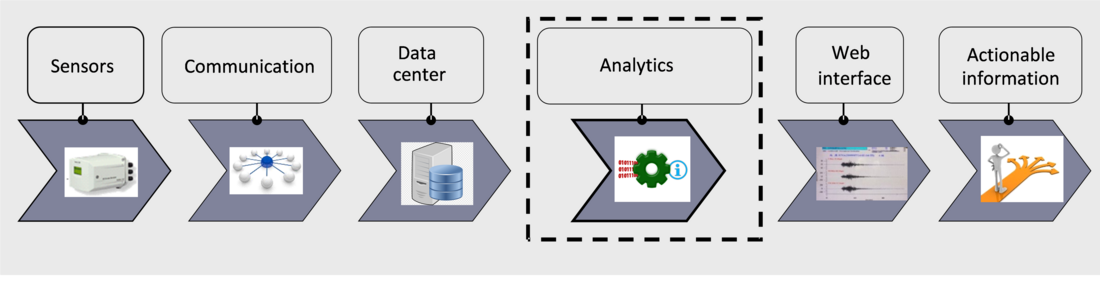
Figure 1 - Value chain of the implemented on-line condition monitoring architecture
The following benefits justify transformer monitoring [2]:
- Increase in transformer service life, through delaying replacement projects and preventing premature ageing
- Reduction in the number and frequency of systematic maintenance actions (inspections, off-line testing, etc.)
- Reduction in extent of failures, through early warning of incipient fault
- Increase in technical maintenance personnel efficiency in making adequate recommendations on corrective maintenance actions when a problem is identified
- Reduction in duration of corrective maintenance tasks, due to more accurate condition assessment
- Increase in transformer availability
- Possibility of assessing transformer load that can be applied depending on transformer condition
- Improvement in power quality (transformer regulation, tap-changer operations)
- Provision of informational inputs that can be used for field personnel security issues
3. Failure modes, data sources and monitoring models
As shown in Figure 2, the on-line monitoring strategy began by understanding the failure modes and transformer components involved [3, 4]. This led to identification of the data necessary to detect anomalies, including data from sensors dedicated to on-line condition assessment (gas-in-oil sensors, bushing and on-load tap-changer monitors) and SCADA data (voltage, current, temperature). New sensor technologies were also developed, as described herein, as were specific models to interpret available data and detect anomalies related to the main failure modes. It is worth mentioning that the on-line condition assessment techniques do not aim to capture all possible failure modes: as a variety of other tests (on-line and off-line) are available, the goal is rather to complement these to increase performance and improve transformer availability.
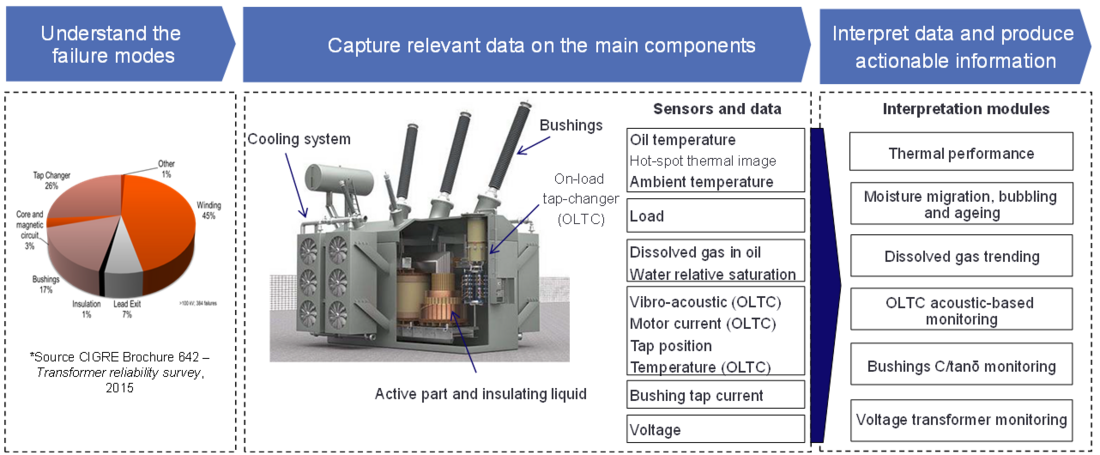
Figure 2 - Failure modes and components involved, sources of data and monitoring modules
4. On-line condition monitoring implementation platform
Figure 3 illustrates the on-line condition monitoring architecture for strategic transmission assets (mostly transformers but currently other assets as well). Sensors installed on substation assets communicate data remotely to the centralised server over an IP link. A team is responsible for implementing and maintaining the software platform used to collect, store, contextualise and visualise data from the various sensors. The team is also responsible for implementing the algorithms used to interpret the data. The algorithms implemented in the platform, coded in MATLAB® or C#, read and interpret the stored data and generate warnings in real time when an anomaly is detected. An automatic system sends these warning notifications to maintenance managers and a pre-defined workflow is actioned attributing the tasks to appropriate maintenance personnel. The warning message includes the necessary contextual information for efficient handling of the problem by maintenance personnel.
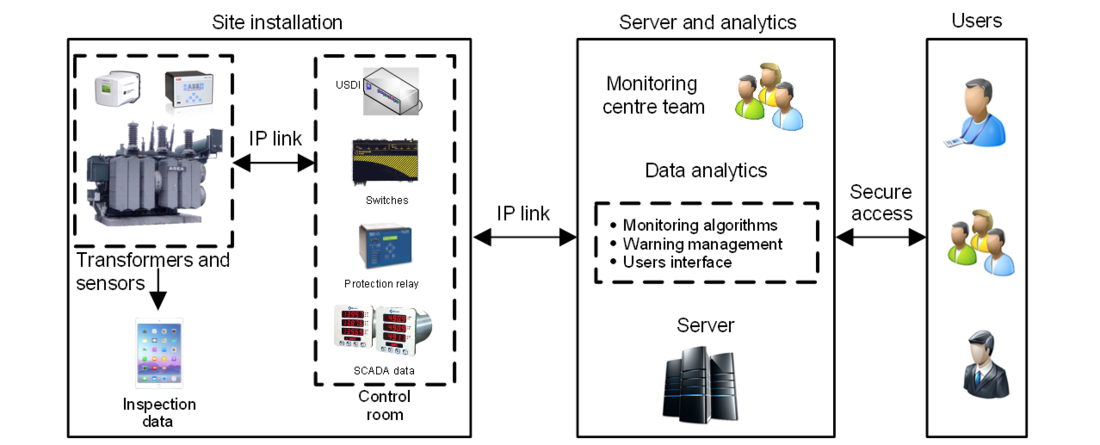
Figure 3 - Centralised monitoring architecture
5. Gas-in-oil trending algorithm
A device that monitors a composite value of hydrogen (H2), carbon monoxide (CO), acetylene (C2H2) and ethylene (C2H4) was developed and commercialised to detect incipient faults in a transformer’s active part (dielectric or thermal). Transformers rated 47 MVA and above and shunt reactors rated 120 kV and above are monitored [5]. Some multiple gas monitors are used in specific locations, for special projects when a specific failure mode must be monitored with particular care. The composite value data (ppm) of all connected monitors is communicated and stored in a centralised server. The monitors are used in combination with annual oil sampling for dissolved gas analysis (DGA).
A trending algorithm detects the gas-in-oil increase over three time spans (10 ppm/day, 20 ppm/week or 30 ppm/month). It is only activated when absolute value is above 50 ppm. The algorithm uses a weighted average function to calculate the reference value and a moving exponential average for the current value. If a trending threshold is exceeded while unrealistic data is detected, then a warning is sent with an indication that a sensor issue should be investigated.
The trending algorithm is useful in detecting an anomaly in the active part that may be related to dielectric or thermal failure modes. Figure 4, for example, illustrates a gas-in-oil increase in a 140-MVA transformer. The warning was issued in winter and correlated with load increase. Off-line electrical tests were performed, but nothing obvious was detected. It was decided, accordingly, to return the transformer to service, follow gas evolution with the monitor and plan the repair when more practical (lower load, higher ambient temperature). An internal inspection was carried out for the repair and core overheating due to multiple grounds was found. Repairs were performed on site and the transformer was put back in service with follow up of gas evolution. The gas stabilised at a low level, confirming correction of the problem.
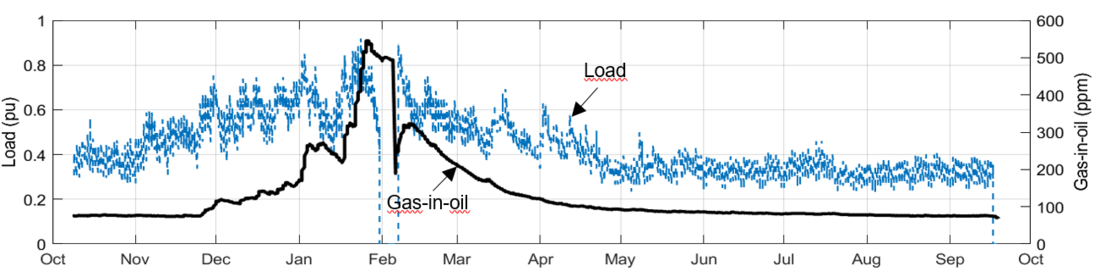
Figure 4 - Gas-in-oil increase correlated with load increase
6. Top-oil estimation using machine learning
Comparison of measured top-oil temperature and temperature predicted by a thermal model allows detection of cooling system performance deterioration (cooler surface pollution or pump/fan issues, for example) when a measured temperature higher than the temperature predicted by the model is detected.
The IEC and IEEE loading guide models for power transformers [6, 7] assume that variations in oil viscosity and winding resistance compensate each other. These variations are therefore not explicitly included in the models, which means that with the standard loading guide models, the ultimate rise in oil and winding temperatures is independent of ambient temperature. While this may be true with normal ambient temperatures, the reality is different in northern regions, where ambient temperatures can fall well below 0°C. A detailed review of state-of-the-art dynamic thermal models can be found in [8]. Research in dynamic thermal modelling is ongoing and a CIGRE Working Group (WG A2.60) was created in 2019 to collect existing experience and make recommendations for further improvements.
A three-phase transformer rated 66 MVA, 225/26.4 kV, with natural oil convection and air flow through radiators (ONAF) was continuously monitored to improve our knowledge of thermal behaviour. Measurements of ambient temperature, load and oil temperature (top and bottom), as well as temperature inside the windings (using fibre optic probes) were taken every minute for over three years. The transformer was modelled and used in a WG A2.38 benchmark activity [8]. When the bottom-oil temperature falls below 0°C, the temperature difference between top and bottom oil increases significantly, indicating a lower oil flow rate in the windings that can be explained by an exponential increase in oil viscosity. Figure 5 (a), which illustrates the data points at 1 pu of load (± 2%) and in ONAF for over two hours, clearly shows that the top-oil temperature rise is not constant as a function of temperature. This must be taken into account to avoid false positive detection of cooling system deterioration. Figure 5 (b) shows laboratory measurements of kinematic viscosity vs. temperature in an oil sample from this transformer. The bottom-oil temperature rise at rated load is about 15 K, then at ‑30°C ambient, the bottom-oil viscosity increases by more than 20 times its value at summer ambient temperatures.
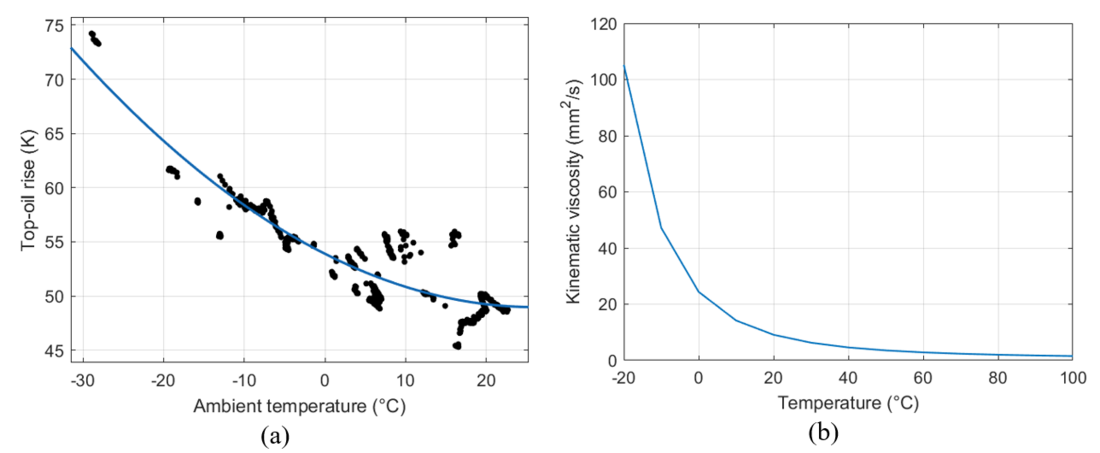
Figure 5 - (a) Top-oil rise at rated load vs. ambient temperature and (b) oil viscosity vs. temperature
To overcome this problem, a machine learning technique was applied. A non-linear autoregressive exogenous neural network [9] was used to predict transformer top-oil temperature from the ambient temperature and electrical load. Cooling stage information is not necessary for the machine learning model because it depends on winding temperature, which is directly correlated with ambient temperature and load. The model is implemented in MATLAB® with the neural network toolbox [10]. Selected performance function is mean-squared error. A model is trained for each transformer on one year of historical data to make sure thermal behaviour in summer and winter conditions (ambient temperature and load) is learned. The training is automatically initiated on-line when sufficient data becomes available. A detailed analysis of model performance on more than 140 transformer-years of data collected from 54 transformers demonstrated the model’s ability to track top-oil temperature under all trained operating conditions [11]. However, the neural network model showed significantly reduced performance after a transformer step-load change because all possible cases could not be included in the training data set. This means that physics-based models would be more applicable for short-term overload capability estimations.
Figure 6 illustrates a cooling system malfunction where measured top-oil temperature was significantly higher than normal value for the load and ambient temperature. A few weeks after this cooling system malfunction, maintenance personnel received a second warning, related to an increased quantity of dissolved gas-in-oil. After receiving these warnings, maintenance personnel corrected the anomaly and the dissolved gas-in-oil returned to its pre-event baseline value. This example shows the benefits of integrating and interpreting data from different sources (load, ambient temperature, top-oil temperature, dissolved gas-in-oil) to clearly understand technical issues and better identify urgency to act. Easy access to monitoring data also made it possible to rapidly and easily confirm that the maintenance action did in fact correct the anomaly on the transformer.
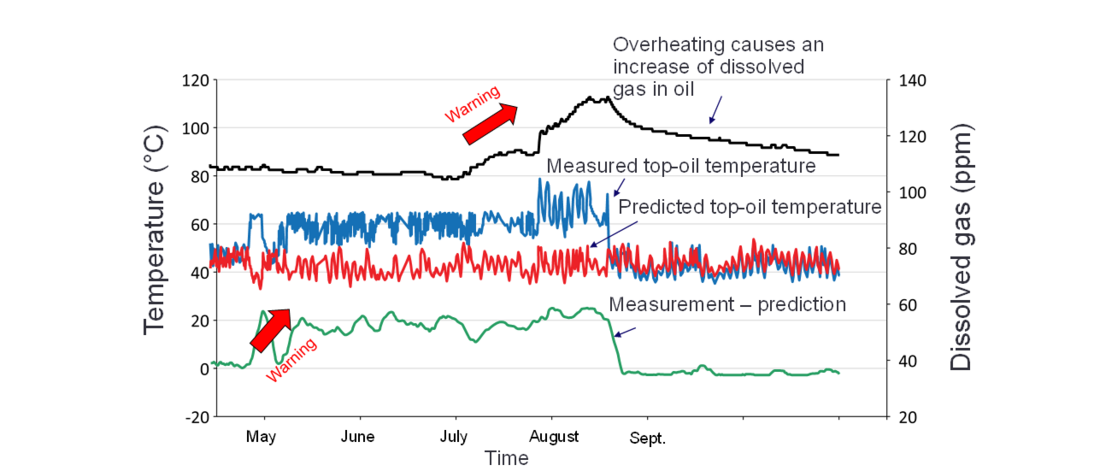
Figure 6 - Detection of a cooling system malfunction with top-oil and gas-in-oil models
7. Water migration, bubbling and ageing models
The presence of water in solid and liquid transformer insulation plays a critical role in transformer life. Water presence is monitored because it causes accelerated ageing of solid insulation and increases the risks of electrical partial discharges and gas bubble formation (bubbling) during emergency overloading. In normal daily load cycles, the water migrates from the paper to the oil and from the oil to the paper depending on the temperature. The algorithm’s dynamic inputs comprise water relative saturation measured in the oil (and temperature of the sensor), and hot-spot temperature estimated from top-oil temperature and load (thermal image). The following describes the key elements:
- Relative saturation is monitored using a capacitive sensor [12] at a different temperature than the hot-spot in the winding, usually the bottom-oil temperature. Using the saturation solubility of water in oil versus temperature (solubility curve), relative saturation at the hot-spot location is estimated assuming that the absolute water content in oil (ppm) is uniform throughout the whole volume of the oil in the transformer at a given time, a simplification of the model.
- The water content in paper insulation (WCP) at equilibrium (e.g., at the hot-spot location) can be estimated using isotherm curves of water content in paper versus relative saturation [13].
- To estimate the WCP over time, a diffusion time constant is calculated based on the paper thickness and the diffusion coefficient, which depends on temperature and water content in the paper [14]. A linearised exponential equation temporised with this time constant is used to estimate the dynamics of migration of the water between the paper and the oil.
- Ageing of the paper is estimated considering the hot-spot temperature (thermal degradation), the water content of the paper (hydrolysis) and the type of oil preservation system (oxidation). The principles reported in Annex I of [6] and Annex A of [7] are implemented. It is worth mentioning that one of the objectives of CIGRE WG D1.76, started in 2021, is to review these paper-ageing algorithms and propose improvements.
- When the transformer winding conductor reaches a temperature at which gas bubbles start to evolve (bubble inception temperature - BIT), the probability of dielectric failure sharply increases. The BIT depends, among other things, on the water content of the paper and the total pressure the bubble must overcome to evolve, as shown in Annex A of [6] (under revision) and [15].
The flowchart in Figure 7 summarises the physics-based water migration, bubbling and ageing models.
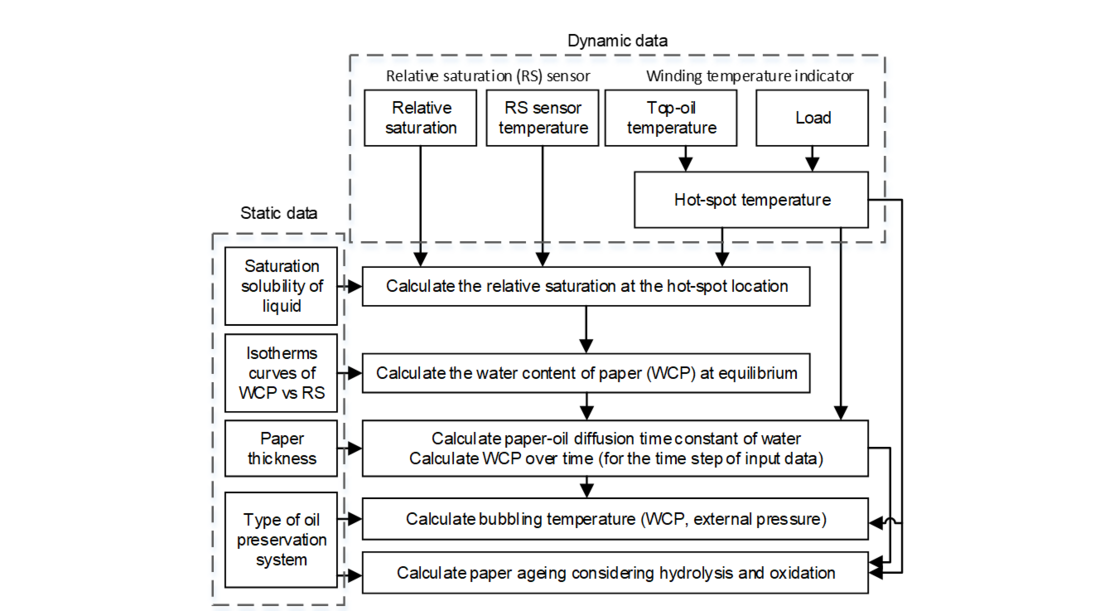
Figure 7 - Flowchart of physics-based water migration, bubbling and ageing models
Figure 8 illustrates a real example of a step-load increase that caused an increase in winding temperature and a consequent decrease in WCP.
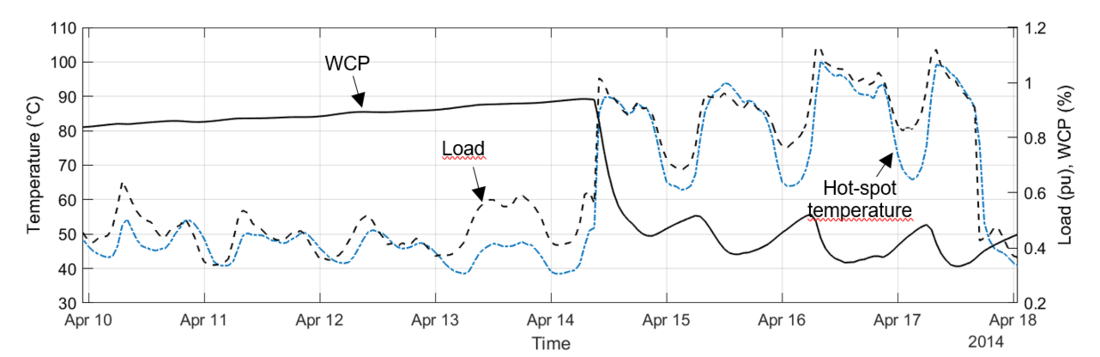
Figure 8 - Dynamic behaviour of paper water content at transformer hot-spot location
The moisture migration and bubbling models can be used to optimise short-term power transformer overloading. Figure 9 shows a simulation of a step-load increase from 0.75 pu to 1.5 pu at an ambient temperature of 0°C. The temperature is assumed in steady state before the overload and is calculated using the IEC 60076-7 model [7] with the standard parameters of an ONAF power transformer. The initial WCP at the hot-spot location is 2%. In this simulation, water migrates from the hot-spot thin insulation to the oil, contributing to the increase in BIT. The bubbling margin is the difference between the BIT and the hot-spot temperature. With a variable WCP (or effective WCP), as Figure 9 shows, the bubbling margin plots a U-shaped curve and drops to a minimum 30 minutes after the beginning of the overload event. This U-shape is created because, in this example, the water migrates with a time constant similar to that of the top-oil temperature. As a secure margin remains at the bottom of the U-shaped curve, there is no bubbling. However, if a constant WCP at the hot-spot location is assumed (the usual approach in the literature), bubbling would start 70 minutes after overload at a hot-spot temperature approaching 140°C, as shown in the Margin curve (fixed WCP). In other words, a short-term overloading model that includes water migration may offer the network operator an operational margin.
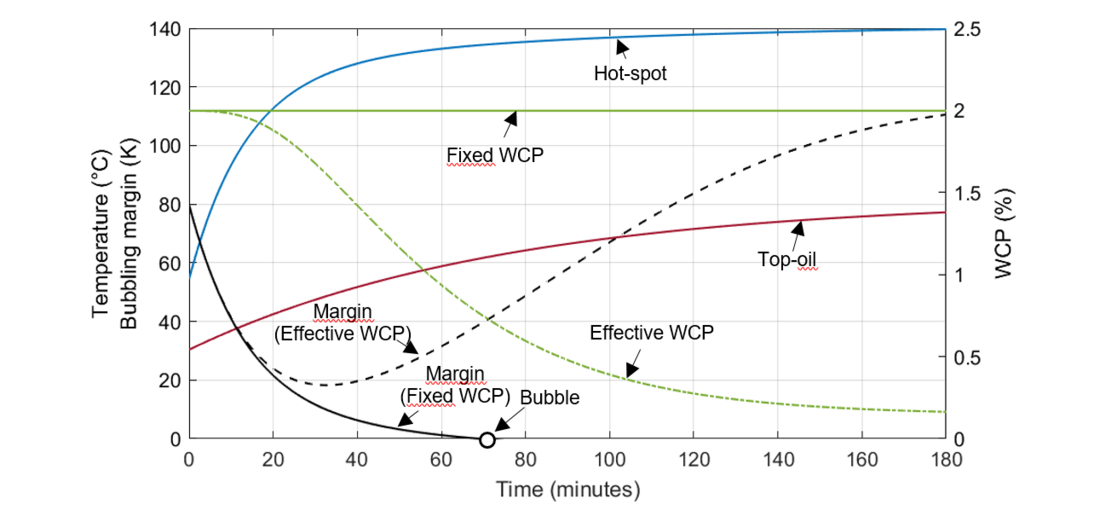
Figure 9 - Moisture migration and bubbling margin modelled during a step-load increase
8. Bushing insulation monitoring
A bushing failure can cause security issues for field personnel because of the risk of explosion and catastrophic failure of the transformer. On-line monitoring of capacitance and dissipation factor (tan δ) was selected for detection of bushing core-insulation incipient faults from any number of causes, including moisture contamination, ageing, partial discharge and partial puncture or short-circuit between capacitive layers [16].
A distributed measurement technology developed at Hydro-Québec’s research institute [17] and industrialised by a major transformer manufacturer is now included in transformer specifications for all units rated 315 kV and above [5]. This modular monitoring product includes on-load tap-changer acoustic monitoring, discussed in section 9. As Figure 10 shows, the bushing monitoring module uses GPS for phase synchronisation [18], so there are no galvanic connections between transformer monitoring units (TMUs). The system can compare amplitudes and phases of any pair of bushings in a substation, allowing use of innovative algorithms that improve interpretation.
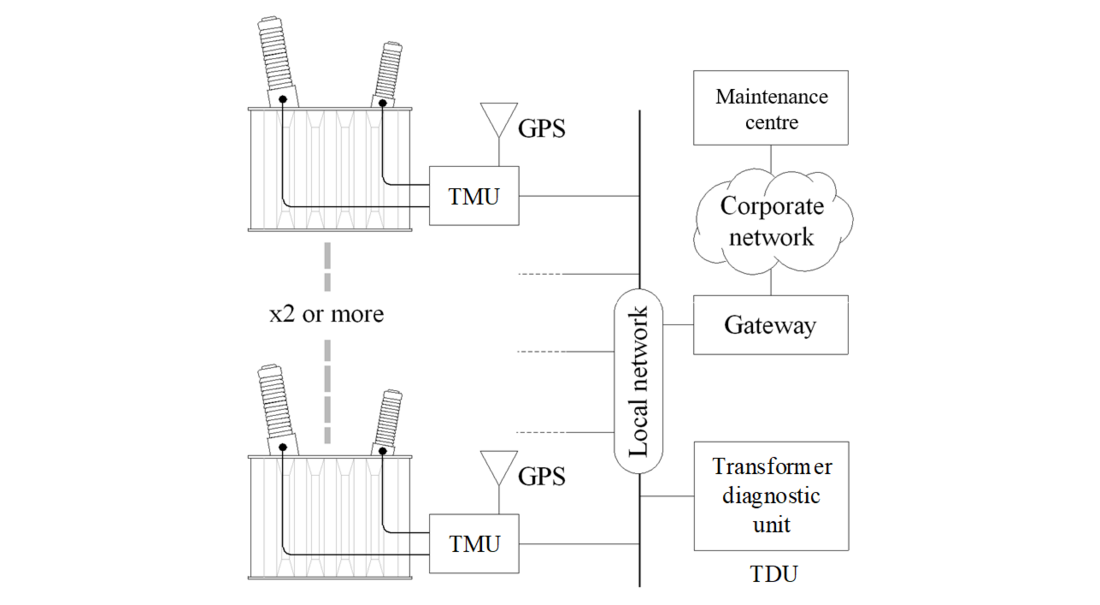
Figure 10 - Distributed sensor system for bushing monitoring
Figure 11 illustrates the effect of temperature on bushing capacitance. The system was configured to compare the bushings of two banks of autotransformers rated 370 MVA, 735/√3 / 230/√3 kV (T2 and T3) connected in parallel. T3 was removed from service for maintenance, while T2 was left in operation. Figure 11 shows the findings of one year of monitoring the bushing capacitance of T2 Phase A (735 kV side) compared to that of T3 Phase A, with an enlarged chart showing details just after energisation of T3. The figure shows a decrease in relative capacitance over several hours that can be explained by the higher capacitance of the ‘hot’ bushing of T2 compared to the ‘cold’ bushing of T3. After this transient temperature difference, the capacitance returned to a normal baseline value. Similar behaviour was observed for the other bushings (phase and voltage) or in tan δ measurements (not shown). These measurements demonstrate the great sensitivity of the distributed measurement system in detecting small changes in bushing internal insulation characteristics. They also demonstrate that annual variation of the monitored parameter (that is, capacitance difference between bushings installed on transformers in parallel) is very low (± 0.2%), meaning temperature difference is not an issue and does not contribute to false positive diagnosis.
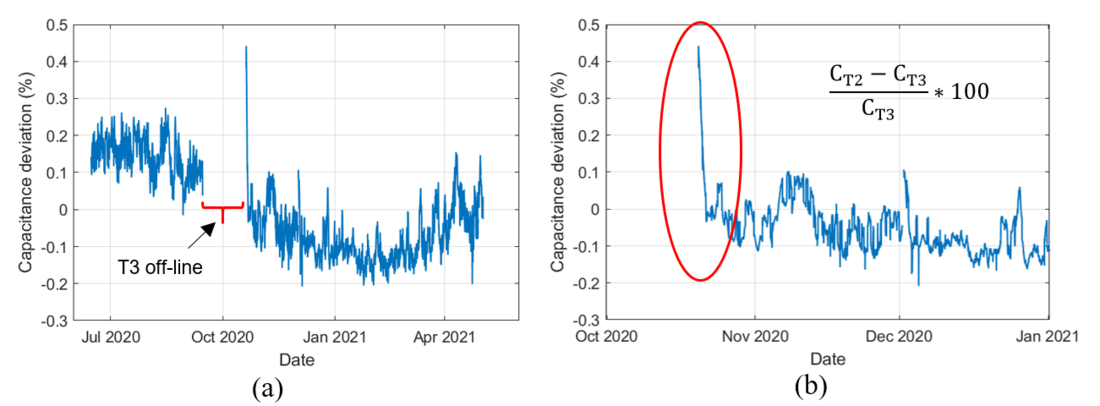
Figure 11 - Effect of bushing temperature on difference (between T2 and T3) in capacitance (a) annual variation and (b) enlarged chart after energisation of T3
Another approach uses phase comparison of the high voltage (HV) and low voltage (LV) bushings of T2 phase A. Electrical network theory indicates that when real power (MW) flows through an inductive impedance (in this case the transformer impedance), a phase shift is created between the sending and receiving voltages as per equation (1).
(1)
where P is the real power (MW), VHT is the voltage on the HV side, VLV is the voltage on the LV side reported on the HV side, X is the leakage reactance of the transformer on the HV side (Ω) and δ is the phase angle between the HV and LV sides. Figure 12 illustrates the correlation between active power flow and the tan δ of the HV and LV bushings. Assuming balanced power flow in the three phases, a faulty bushing can be detected by comparing them.
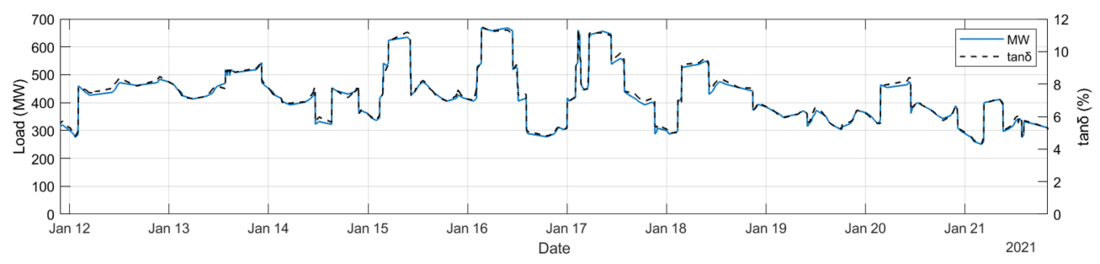
Figure 12 - Power flow and tan δ of the HV and LV bushings
To compare the sensitivity of different monitoring approaches, a failure was simulated in the HV bushing of T2 phase A by increasing absolute tan δ in increments of 0.2% and relative capacitance in increments of 0.4% every month for four months. Three different approaches were compared:
- Same-phase comparison: T2 phase A bushing compared to T3 phase A bushing (connected in parallel on the same electrical circuit) and deviation monitored
- HV-LV inter-phase comparison: T2 phase A HV to LV compared to average of phases B and C and deviation monitored
- Inter-phase comparison: T2 phase A compared to average of phases B and C and deviation monitored
Figure 13 illustrates the results. All charts have the same span on the y-axis to facilitate visual comparison. Measurements were recorded every minute and standard deviation is indicated on each chart. Same-phase comparison is the most sensitive approach and is immune to unbalance in the electrical network, followed by HV-LV inter-phase comparison and then inter-phase comparison. With the same-phase approach, standard deviation of the raw tan δ data is 16.5 times lower than in the phase-to-phase comparison and about five times lower than with the HV-LV approach. For capacitance monitoring, same-phase comparison is also the best approach, with a standard deviation three times lower than in the phase-to-phase comparison and approximatively 20% lower than with HV-LV comparison.
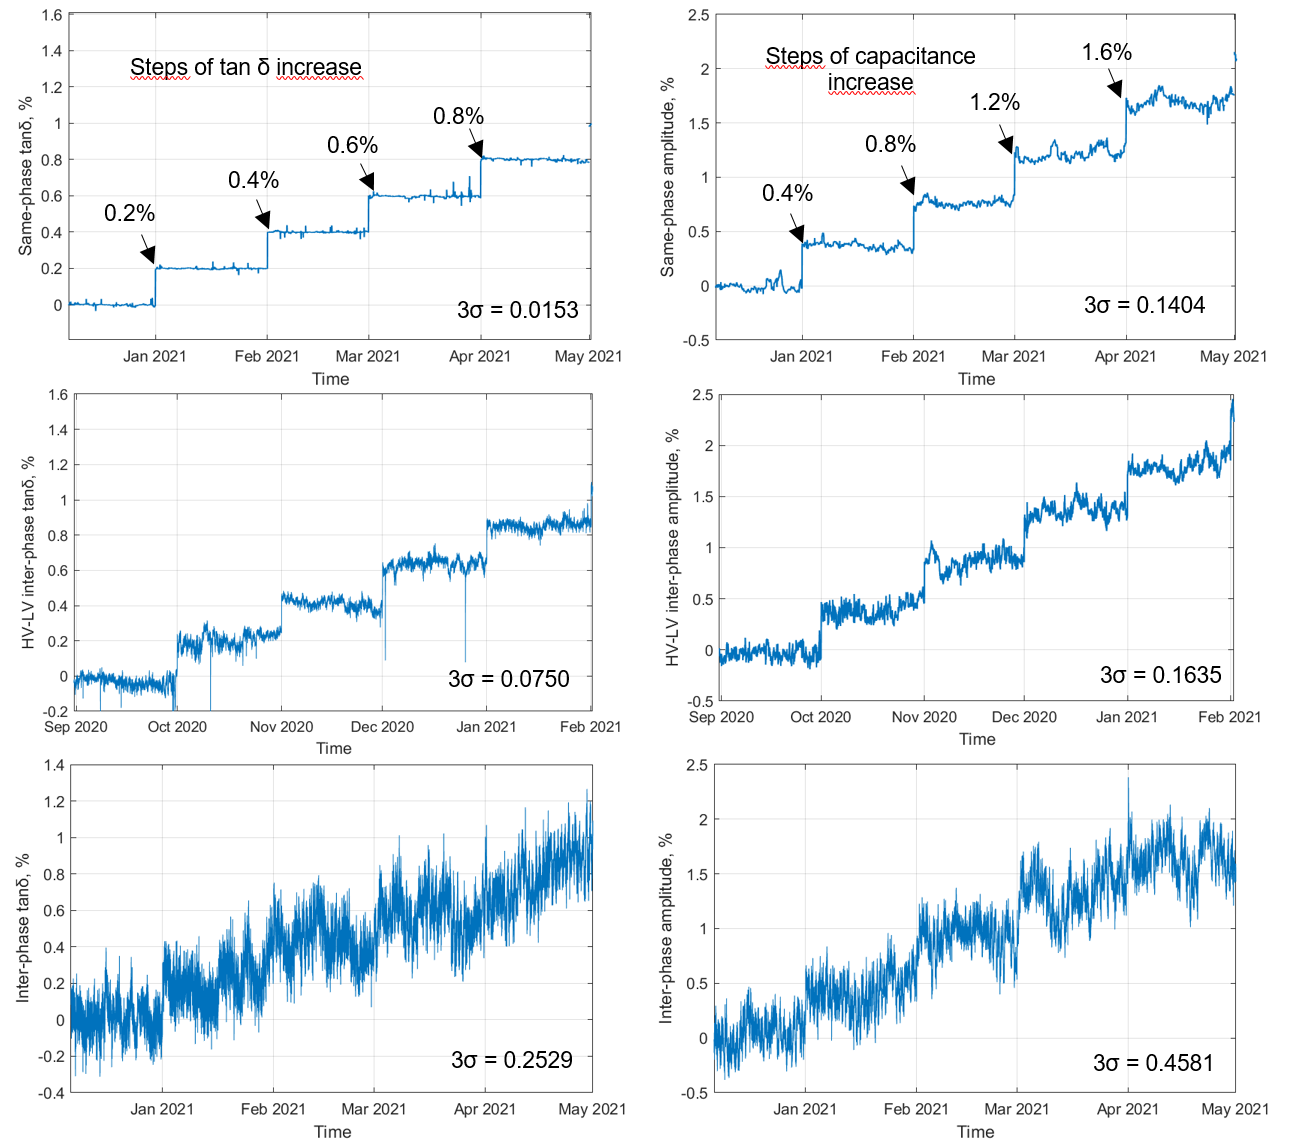
Figure 13 - Comparison of tan δ and C monitoring: top charts are same-phase comparison, middle charts are HV-LV inter-phase comparison and bottom charts are inter-phase comparison
9. On-load tap-changer (OLTC) vibro-acoustic monitoring
Hydro-Québec pioneered OLTC on-line condition monitoring using vibro-acoustic measurements and has been involved in its development for the past three decades [17, 19]. An on-line condition monitoring product, industrialised by a major transformer manufacturer, is currently specified on all transformers rated 69 kV and above [5]. The monitoring product has proved to be robust and reliable in harsh 735‑kV substation environments. In 2016, this system was installed on nine single-phase autotransformers rated 370 MVA, 735/√3 / 230/√3 kV. The data gathered under different operating conditions over the last five years (more than 130 000 measurements) comprise a unique and rich dataset that has been used to develop and test many algorithms.
Measurements from substations are fetched into a centralised server where they are processed by an application that allows users to easily visualise raw and processed data. For example, after a trending algorithm warning, the user can quickly access charts showing envelope changes detected by the monitoring system. The software also allows configuration of the algorithms for adaptation to a specific OLTC model. For instance, when there are two sets of main switching contacts in the diverter switch, all switching operations that occur on the same set of switching contacts are grouped together in the configuration manager for processing by the trending algorithms.
The trending algorithms that process the motor current and vibro-acoustic signatures are designed to detect changes in the state of the OLTC over time, and they are applicable to various OLTC models. One algorithm compares a moving average of the switching operation vibro-acoustic envelope with a reference and outputs a dimensionless numerical index that can be compared to sister units subjected to the same operating conditions. This innovative approach increases the accuracy of the algorithm and is a huge help in the decision-making process.
Figure 14 (a) shows service-aged and reference vibro-acoustic envelopes of switching operations of an OLTC in good condition monitored over a five-year period. Figure 14 (b) shows the index value and threshold established for this same unit using the standard deviation of the index calculated after a self-learning period.
Figure 15 (a) illustrates trending algorithm results for three sister OLTCs over the same five-year period. As the figure shows, when the index value was applied to the six sets of main switching contacts (two per OLTC), a significant difference was observed in one OLTC. Figure 15 (b) illustrates this timing difference in the switching operation, which can be attributed to asymmetry in wear of the odd and even main switching contacts. On-line condition of this unit will be carefully monitored to detect any other significant changes in behaviour, and the main switching contact symmetry will be inspected at the next maintenance.
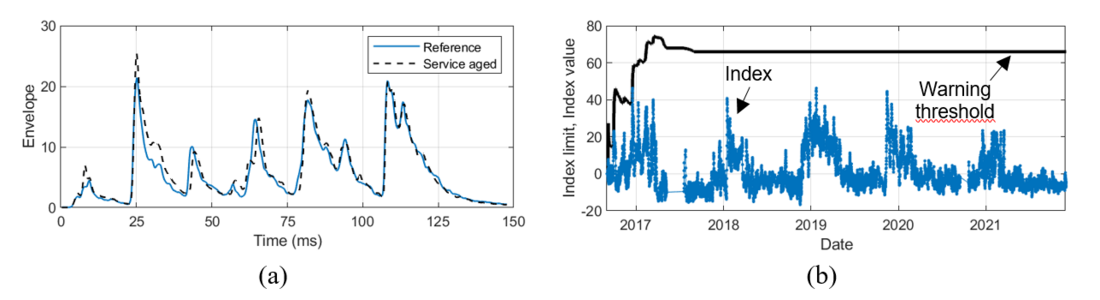
Figure 14 - (a) Acoustic envelope comparison of an OLTC in good condition and (b) index limit and values for more than 10 000 operations
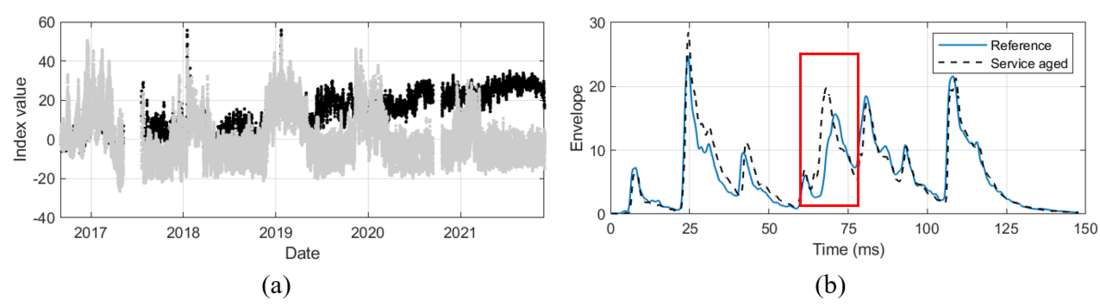
Figure 15 - (a) Index values from three sister units for more than 10 000 operations and (b) acoustic envelopes for OLTC requiring investigation based on deviating data in (a)
10. Voltage transformer monitoring using SCADA data
With this approach, as with the same-phase bushing monitoring approach, measurements of voltage transformers connected to the same circuit are compared to detect deviations. Figure 16 illustrates a failure detected at the beginning of the COVID-19 pandemic, when most technical support engineers were working from home. Technical support personnel responded promptly after receiving a warning, disconnecting the voltage transformer to minimise the risk of porcelain projection due to internal arcing. An internal inspection confirmed the presence of internal insulation damage, demonstrating the true-positive detection capability of this approach. This example highlights the improvement in resiliency achieved by digitalising asset condition monitoring.
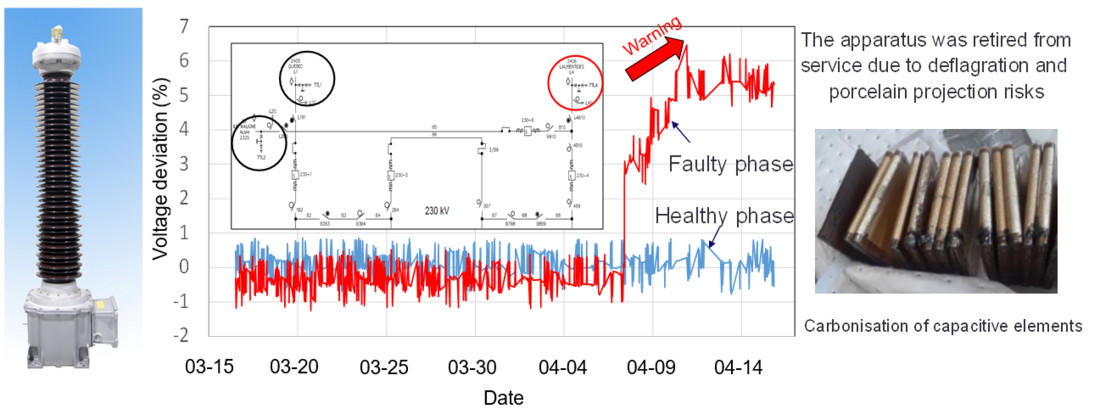
Figure 16 - Voltage transformer failure detected by comparison with voltage measurements from other units on the same electrical circuit of the substation
11. Conclusion
This paper emphasises the importance of an integrated strategy to improve on-line condition assessment of transformers and other assets. Data analytics were developed to detect anomalies related to the major failure modes of the most critical transformer components (active part, bushings, on-load tap-changer and cooling system). Future developments should include more advanced condition assessment models that can diagnose the type and severity of incipient faults (diagnostics) and even predict how these faults might evolve into complete transformer failures (prognostics).
This paper presents physics-based and data-driven models that represent the behaviour of operating transformers using on-line data from monitoring sensors and other sources. This is an important milestone for future development of the concept of transformer digital twin, which should be applied as a priority to the most strategic assets in the network. The integration of transformer digital twins into operating and maintenance systems will require the collaboration of many stakeholders to maximise the potential benefits of this new concept.
Acknowledgments
The authors would like to acknowledge the contributions to Hydro-Québec’s MEET project of Jacques Aubin, François Bélanger, Bernard Bérubé, Zakaria Bouadi, Claude Fecteau, Bruno Girard, François Léonard, Alexia Marchand, Bernard Noirhomme, Jonathan Picher and Jean Thivierge. We also want to thank Jocelyn Jalbert, Marie-Hélène Joannette-Cartier and Brigitte Morin for providing data to illustrate some of the case examples shared in this paper.
References
- CIGRE WG A2.44, "Guide on transformer intelligent condition monitoring (TICM) systems," Technical Brochure 630, 2016.
- C. Rajotte, A. Tremblay, and É. Frenette, "Condition assessment of substation apparatus - the challenges or turning dreams into reality," CIGRE Paper B3-259, 2022.
- CIGRE WG A2.37, "Transformer reliability survey," Technical Brochure 642, 2015.
- CIGRE WG A2.49, "Condition assessment of power transformers," Technical Brochure 761, 2019.
- C. Rajotte and S. Proulx, "Continuous improvement of transformer specifications at a large utility," CIGRE Paper A2-303, 2020.
- IEEE, "IEEE Guide for Loading Mineral- Oil-Immersed Transformers and Step-Voltage Regulators C57.91-2011," ed, 2011.
- IEC, "Loading guide for oil-immersed power transformers," IEC 60076-7 Ed. 2 (2018-01), 2018.
- CIGRE WG A2.38, "Transformer thermal modelling," Technical Brochure 659, 2016.
- H. T. Siegelmann, B. G. Horne, and C. L. Giles, "Computational capabilities of recurrent NARX neural networks," IEEE Transactions on Systems, Man, and Cybernetics, Part B (Cybernetics), vol. 27, pp. 208-215, 1997.
- M. H. Beale, M. T. Hagan, and H. B. J. U. s. G. Demuth, MathWorks, "Neural network toolbox," vol. 2, pp. 77-81, 2010.
- A. Zinflou, P. Picher, L. Vouligny, and A. Marchand, "Transformer cooling system monitoring using neural networks," presented at the CIGRE Canada Conference, Montréal, 2019.
- CIGRE WG D1.52, "Moisture measurement and assessment in transformer insulation - Evaluation of chemical methods and moisture capacitive sensor," Technical Brochure 741, 2018.
- CIGRE WG A2.30, "Moisture equilibrium and moisture migration within transformer insulation systems," Technical Brochure 349, 2008.
- Y. Du, M. Zahn, B. C. Lesieutre, A. V. Mamishev, and S. R. Lindgren, "Moisture equilibrium in transformer paper-oil systems," IEEE Electrical Insulation Magazine, vol. 15, pp. 11-20, 1999.
- J. P. Hill, Z. Wang, Q. Liu, S. Matharage, A. Hilker, and D. Walker, "Improvements to the Construction of Bubble Inception Formulae for Use With Transformer Insulation," IEEE Access, vol. 7, pp. 171673-171683, 2019.
- CIGRE WG A2.43, "Transformer bushing reliability," Technical Brochure 755, 2019.
- P. Picher, S. Riendeau, M. Gauvin, F. Leonard, L. Dupont, J. Goulet, and C. Rajotte, "New technologies for monitoring transformer tap-changers and bushings and their integration into a modern IT infrastructure," CIGRE Paper А1-101, 2012.
- S. Riendeau, F. Léonard, P. Picher, M. Gauvin, H. Bertrand, and L. Dupont, "Method and system for time synchronization of phase of signals from respective measurement devices," US Patent, 2015.
- M. Gauvin, P. Picher, S. Riendeau, F. Léonard, and C. Rajotte, "Field experience with tap-changer and bushing monitoring," presented at the CIGRE A2 & D1 Colloquium, Kyoto, 2011.