D2 - DAS Technology: an opportunity to use fibre optics for asset monitoring and security applications in Electric Power Utilities
Authors
S. KWIK, J.M. ABAD - Red Eléctrica de España, Spain
R. MARTÍNEZ, J. PRECIADO - Aragón Photonics Labs, Spain
P. SEVILLANO, J. SUBÍAS - Universidad de Zaragoza (Grupo Tecnologías Fotónicas), Spain

Summary
Electric Power Utilities (EPUs) have deployed a fibre optic infrastructure to support their telecommunications needs. DAS technology brings the opportunity to reuse this infrastructure by turning the fibres into distributed acoustic sensors. This paper will explore multiple monitoring and security applications of this technology in high voltage networks in Spain.
DAS techniques enable the digitalization of the physical asset management, and it is a lever towards a cost-effective maintenance.
Ongoing projects are testing these applications in Red Eléctrica de España facilities in collaboration with the University of Zaragoza and Aragon Photonics.
DAS (Distributed Acoustic Sensing) is a technology based on C-OTDR (Coherent Optical Time Domain Reflectometry). It is based on the use of Rayleigh backscattering of coherent pulses traveling along the optical fibre.
This technology turns the fibre into a distributed sensor that, thanks to its high sensitivity, is capable of measuring mechanical and thermal stimuli originated from events happening in the vicinity of the fibre. Due to the low attenuation of the light pulses through the fibre and the pulse repetition rate, the technology can sense tens of kilometres at an acoustic rate with a single interrogator.
Using algorithms techniques based in artificial intelligence (A.I.), unsupervised machine learning, etc., events that occur along (and close to) the fibre path are detected, identified, and classified.
The final user gets notification alarms through different media (mail, SMS, etc.) and can handle the information at its discretion.
Some of the key aspects DAS solutions can provide to an EPU are 1) digitalization and improvement of the preventive detection (proactive), minimizing reactive maintenance interventions; 2) a continuous, online, and automatic supervision 24/7 of infrastructures and 3) take advantage of the EPUs existing fibre optic network, easing the implementation of this technology on the field.
Different projects are currently being carried out in the Spanish TSO in order to explore the different possibilities and applications of DAS technology in an EPU. The paper will focus on these applications, its expectations, and results:
- Protection of underground infrastructures (both FO and power cables)
- Applications in overhead lines
- Protection of subsea infrastructures (both FO and power cables)
- Asset perimeter security
- Other potential applications
Chapter 1 describes the main motivations that have led to try this technology in the Spanish TSO. Chapter 2, instead, explains the main principles of DAS technology. The different methods used to process de data are explained in Chapter 3, whereas Chapter 4 describes the different applications and use cases of this technology in an Electric Power Utility.
Keywords
DAS - fibre optic - asset management digitalization - infrastructure protection - perimeter security - sensing - artificial intelligence - preventive maintenance - predictive maintenance - machine learning1. Motivation
DAS Technology can be used in multiple ways and with different outputs for Electric Power Utilities (EPUs), including both economical and operative benefits.
One of the great advantages of DAS is that, compared to single point measurement techniques, it can reuse existing optical fibres and turn them into distributed sensors to fully monitor power lines.
This section aims to identify the different EPU needs that can be solved by using this technology. In fact, DAS technology can have a direct impact on asset management or security.
1.1. Asset Management and Cost Reduction
1.1.1 Third party aggressions (TPA)
DAS technology can help EPUs with asset management. For instance, this technology can anticipate or minimize Third Party Aggressions (TPA) when used in underground or submarine power lines. This can be very useful for EPUs as the impact in cost of TPA in these assets is usually noteworthy. Additional opportunity cost must be considered and added to these direct costs as these assets will remain unavailable during reparations, which are normally long in time.
1.1.2 Underground cables asset management
A common practice in underground power lines preventive maintenance is the use of patrolling services, which constantly watch the route of the lines and its surroundings. They try to anticipate any sort of TPA like digging works in the vicinity of the line. Cost reductions can be considered when using DAS systems, as these patrolling services can be reduced or even withdrawn.
1.1.3 Subsea cables asset management
In subsea cables, instead, geographical surveys are performed on a regular basis (typically every 3-5 years). DAS systems together with other fibre-optic-based sensors, can help to see if a cable remains protected or not or if some new free spans appear. Unlike geographical surveys, fibre-optic-based sensors are permanently monitoring the asset.
1.1.4 Overhead conductors monitoring
The use of DAS in overhead lines is also in study and it could potentially be also used to monitor structural damages in the line, for instance. Frequency analysis of the signal could also reveal important parameters such as the live value of sag or its tracking with environment conditions.
1.1.5 Future steps in asset management
Other future potential uses of DAS technology could be the detection of short-circuits or even partial discharges.
1.1.6 Health of the asset
Knowing the health of the asset is a key factor when condition-based and predictive maintenance policies are applied. The fact that this technology is continuously sensing certain parameters can help to monitor the health of the asset.
1.2. Asset Security
EPUs are concerned about the security of its assets and facilities. It is desirable to detect any kind of non-authorised intrusions or intentioned aggressions to their assets.
1.3. Sustainability and Green Transition
EPUs are moving towards the green transition. Some of the applications of DAS technology can lead to the environment protection as it can help, for instance, in studies of seabed aggressions or to better understand and minimize bird collisions.
1.4. Maintenance Digitalization and Data Mining
DAS solutions can provide to an EPU the digitalization and improvement in the asset management and maintenance areas as preventive detection (proactive) is now possible. Thus, reactive maintenance interventions are reduced. Additionally, they also provide a continuous, online, and automatic supervision 24/7 of infrastructures.
1.5. Added Value
One of the key aspects of fibre-based sensing is the use of existing fibre optic infrastructure, easing the implementation of this technology on the field.
2. Technology
Distributed fibre optic sensors (DFOS) have been widely developed since they were proposed for physical and chemical sensing in the early 1980. The basic principles of DFOS relay on the use of the optical fibre as a sensor while the light traveling through it acts as the probe. Among all the techniques implemented by DFOS, the optical time domain reflectometry (OTDR) has been positioned as the most ubiquitous in multiple fields of applications.
In the most common scheme, the OTDR is depicted in Fig.1 and is composed by a laser source, a circulator, and a detection stage. In the emission stage, the laser source launches a series of pulses that the circulator injects into the fibre under test. During its propagation through the fibre, the pulse interacts with the silica fibre giving rise to different phenomena among which the Rayleigh scattering is predominant. Due to this elastic interaction, a small fraction of the pulsed light is scattered in all direction and some of it is guided by the fibre backwards to the launching end. By means of a circulator, the backscattered light is redirected to the detection stage instead of going into the emitter. By knowing the velocity of the pulse in the fibre, the system can correlate the signal detected with the spatial location of the pulse. The gauge length of the technique is defined by half of the segment of fibre covered by the pulse, which is directly related of the temporal width of the pulse. The interrogation rate of the fibre will be limited by the presence of one single pulse in the fibre at a time, as signals coming from several pulses at the same time will require a complex setup to discriminate backscattered signal. Considering tens of kilometres of standard single mode fibre, pulse frequency rates are in the range of kHz which enables the analysis of events at an acoustic rate.

Figure 1 - Basic OTDR schematics
The backscattered light produced by Rayleigh scattering can be modelled as a sequential series of spatially discrete reflectors. In this way, a fibre with length L includes N sections with section length of ΔL=L/N and M scattering centres in each section ΔL. The ith reflector is attributed by the addition of randomly distributed scatters within ΔL. Hence, the interference field intensity of Rayleigh backscattering light Ik at distance Li can be expressed by:
(1)
where ai and Ωi are the amplitude and phase of the backscattered wave from ith reflector. All backscattered waves from ΔL are incoherently summed at the detector.
The use of a coherent source for generating the optical pulses allows the analysis of intrapulse interference (see Fig. 2). The coherent sum of the backscattered optical waves coming to the detector from reflectors illuminated in a certain time contains information of its relative optical phases. This is the basis of the coherent optical time domain reflectometry (COTDR). This technology can reveal localized phase changes along the fibre due to mechanical or thermal perturbations. Very small changes (in the scale of ) in the distribution of the reflectors contribute to measurable changes in the amplitude of the interferometric backscattered signal. In this way, compared with OTDR, COTDR presents an extraordinary improvement of sensitivity. This fact opened the door to the development of Rayleigh scattering based distributed acoustic sensing (DAS). Based on this principle, the technique can achieve a high resolution in the measurement of mechanical perturbations at an acoustic rate [1].

Figure 2 - Signal registered for a C-OTDR scheme and its variation after a perturbation
The intrinsic nonlinear nature of the interferometric sum of backscattered waves is embedded in the relationship between the magnitudes of the perturbation and the optical interference in the detector. That means a DAS interrogator can sense precisely when and where a perturbation is affecting the fibre but behaves like a high nonlinear acoustic transductor in quantifying how is doing. In other words, based on the detected interference it is difficult to infer relative magnitudes between different events. Moreover, DAS systems offers a low fidelity in the reproduction of the frequency spectrum of the perturbation. This nonlinear equalization of the acoustic signal represents no significant impairment in applications where only event detection is the main objective (perimeter surveillance, for example). But it is necessary to appropriately post-process the detection in environments where an event classification is required.
Recent progress in optical pulse control and shaping has been determinant for the development of a novel technique that overcomes this limitation (see Fig. 3). Chirped pulse coherent optical time domain reflectometry (CP-COTDR) is characterized by the use of optical pulses where instantaneous optical frequency varies along pulse time [2]. If the maximum excursion of the optical frequency is sufficiently bigger than the pulse-induced spectral content, the backscattered interference reflects a linear frequency-to-time-mapping [2]. The relation between frequency and temporal shifts is given by the expression
(2)
Where is the temporal width of the pulse,
is the excursion of the optical frequency in the chirped pulse and Δv is a perturbation induced frequency shift produced by local changes in the group refractive index of the fibre, which is equivalent to changes in the local distribution of the reflectors in the fibre. In this case, the magnitudes of the perturbation and the temporal shift are linearly related. The relation between changes in group refractive index and temperature (
) or strain (
) perturbations is given by
(3)
This feature enables then a full characterization of the perturbation both in time and spectral domain.

Figure 3 - Signal registered for a CP-OTDR scheme and its variation after a perturbation
As is shown in Fig. 4, this technology turns the fibre in an array of sensors with enough sensitivity to be able to obtain thermal and mechanical information of the environment where the fibre has been installed. Combined with data processing algorithms, the system can remotely provide enhanced information of the infrastructure or terrain where the fibre lays. Due to the achievable performance values, this technique has gained attention in a wide range of applications, such as infrastructure health monitoring, third party intrusion, pipeline supervision and more.

Figure 4 - Structure of complete Data Processing Methodology: from the optical sensor until the final user experience interface
3. Data processing methods
In its most simple scheme, one Processing and Sensor Unit, so-called DAS device, acquires raw data from the optical fibre, and then sends it to the algorithm unit, which is located inside the same DAS device. Here, there are a several developments and algorithms that process the data to obtain an alarm ready to be handle by a final customer.
This data processing work to detect, identify, classify, and rule under a logical condition the events occur in the device and transforms them in alarms as we explain below (see Fig. 5).

Figure 5 - Diagram of the data processing methodology
3.1. Detection
The raw data obtained in the first stage contains every stimulus recorded in the environment of the sensor, always with a time and space stamp along the monitored fibre. It also includes continuous signal that do not relate to events, which can be considered noise.
First, an initial step removes the noise, leaving the rest of data filtered and reveals the anomalies (events). Additionally, this code presents a highly recommended adaptative threshold, due to this noise is spatially and temporary inhomogeneous, due to the nature of the noise environment (wind gusts in air cable, traffic, and rush hour in TPI or perimeter solutions, etc.).
On this final detection branch, the anomalies (events) remarked are registered by algorithms of unsupervised Machine Learning, which means that there are no previous labels associated with the data points, and they are labelled as potential alarms. These data structures are events which presents some intrinsic characteristics that position them as potential alarms that are critical for the final customer, in the next process they must be contrasted to known patterns to be identified and classified.
3.2. Classification
Once the potential alarms are registered with time and space stamp, as well as some important features like intensity value, frequential window, auto-frequency, etc.; the next step in the data processing is the identification.
In general, for every application, there are a set of events, that present several features that can be registered as patterns and thus help to its identification in an automated algorithm, or what is so- called A.I or Machine Learning techniques. The parameters can be in the real (intensity and associates) and the complex field (phase and associates as frequency window or frequency value).
Some examples of these events for some applications are the following: 1) in TPI application activities from heavy equipment present certain frequencies; 2) in perimeter application, different kind of intrusion such as climbing and cutting fence present different level of intensity; 3) in subsea application, trawling net and changes in the seabed exhibit different signal characteristics both in time and frequency domain.
In this step of the identification and classification is crucial to have feedback from the real environment to improve the learning of the classification and reduce the false alarm rate. Basically, there is a first transitional period in which all alarms classified need to be confirmed to enhance the patterns libraries. The idea for this algorithm based in A.I is that the more potential alarms are classified, the better the algorithm of classification performs.
3.3. Conditional gates
As third block in the data processing pipeline, the logical gates are a series of rules or conditions totally customized for each application that help to reduce the false alarm rate.
These conditions rule different natures of the environment. Some examples are: 1) differential thresholds levels of the monitored fibre depending on the time (day, night, weekends-off) or the spatial locations (areas where there should be no be alarms); 2) overlapping zones, i.e., spatial zones where there is an active alarm, and the rule handle the notification of following events at the same location.
3.4. Alarms management
Finally, the last step of this data processing methodology is the notification of alarms to the final customer who handles the information. Depending on the Control Management platform of the customer uses, there are two ways to alert the alarms.
If the customer has a superior User Experience (UX) such as SCADA, which controls other systems like video-cameras, drones, etc., DAS system can send previously agreed information via mail, SMS, TFP, etc. to connect with the customer’s platform. On the other hand, if this kind of UX is not available, DAS system can offer a web application sustained by private server with a complete log of alarms that can serve as pattern library.
4. Applications
DAS technology can apply in several environments for Electric Power Utilities. This section covers several applications with a description of the needs and how DAS technology can be useful.
The applications are classified in two branches: 1) Third Party Intrusion (so-called TPI) and 2), Asset Perimeter Security.
4.1 TPI (Third Party Intrusion)
4.1.1 Underground power lines monitoring
Most EPUs have underground infrastructures where telecommunications and sensing cables are installed together with electric power cables. As all underground infrastructures, they can be exposed to external works (public or private) which are performed in the vicinity of these assets. Heavy or digging machinery are usually involved in these works.
Unfortunately, accidents can happen during these works and can damage the cable or part of it. When this occurs, a great deployment of resources is needed, both financial costs and technical staff to repair the situation as soon as possible in order to reduce the unavailability of the infrastructure.
With DAS technology, there is a proactive response from the EPU. They can monitor different lines connected at a single DAS system uninterruptedly. Figure 6 shows different threats infringed upon the underground cables and its associated pattern registered by the DAS and defined by its intensity and frequency (lower graph in figure 6). Based on these features, the system is able to detect the event, correlate its features with the pattern library and finally classify the event identifying its possible cause in order to help the owner of the infrastructure to decide if it is a threat or not. An early detection of this possible threats can be crucial for the threatened infrastructure’s integrity.
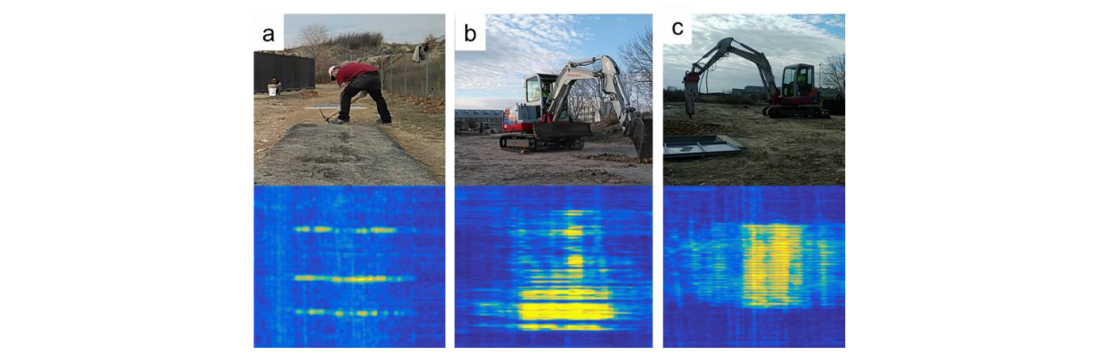
Figure 6 - Application DAS techonology as TPI (Third Party Intrusion). a) is a manual digging threat; b) column is a digging machine; and c) is a heavy hammer machine
4.1.2 Subsea power lines monitoring
On this scenario, the issues to resolve are similar to TPI application in underground cables but in a more isolated scenario. Subsea cables can suffer damages caused by anchors or trawling nets (fishing activities). On the other hand, these cables are also exposed to natural-caused changes in the seabed around the cable, creating new ‘free spans’. Moreover, seismic activity close to the cable could also present a potential risk for the infrastructure. For this application, proactive, anticipation and prevention are the three key points to avoid a repairing work that in this scenario becomes a major task.
In general, this kind of environment is more silent than others because there are less vibration sources and the water rapidly absorbs the mechanical perturbations. However, it is necessary to calibrate the sensor to determine high enough thresholds to listen the surroundings and do not lose critical events.
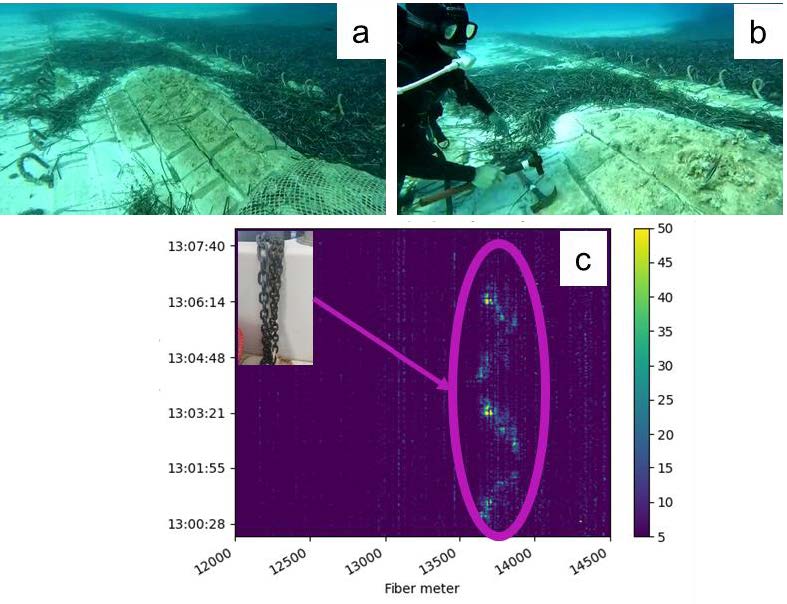
Figure 7 - Application of DAS technology in subsea power lines monitoring. Figure a) power cable subsea under a mound of bricks; b) diver hitting two hammers; c) energy of the stimulus recorded while dragging a chain close to the cable
Figure 7a. shows the subsea power cable, protected by a mound of bricks, which links the two electrical substations between islands.
Figure 7b. shows a diver hitting the seabed near the cable to evaluate the sensitivity of the DAS system (Fig.7 b).
Figure 7c. plots the energy value obtained from the equipment when a chain is dragged in the seabed near the cable. This scenario simulates the early stage of a potential aggression caused by trawling nets or anchors. In this case the chain is dragged along 50 m in the same direction of power cable, but in multiple steps with a different separation from the power cable (0, 2,4 and 8 m of separation). The graph shows the events registered on the system recovering the precise position of the chain and its trajectory as it was being dragged near the cable.
4.1.3 Overhead power lines monitoring
This third scenario of the TPI applications is the monitoring of power lines using overhead optical fibre cables. One of the main objectives of DAS systems in this area is the detection and monitoring of the different frequency vibration modes of the cable. These modes are excited by resonant processes induced by the wind affecting the cable. The magnitude of these frequencies and their variation over time give valuable information about structural parameters of the power line and environmental issues: cable sag [3], temperature variations [4], damping misfunction, fatigue failures, aeolians [5,6], etc.
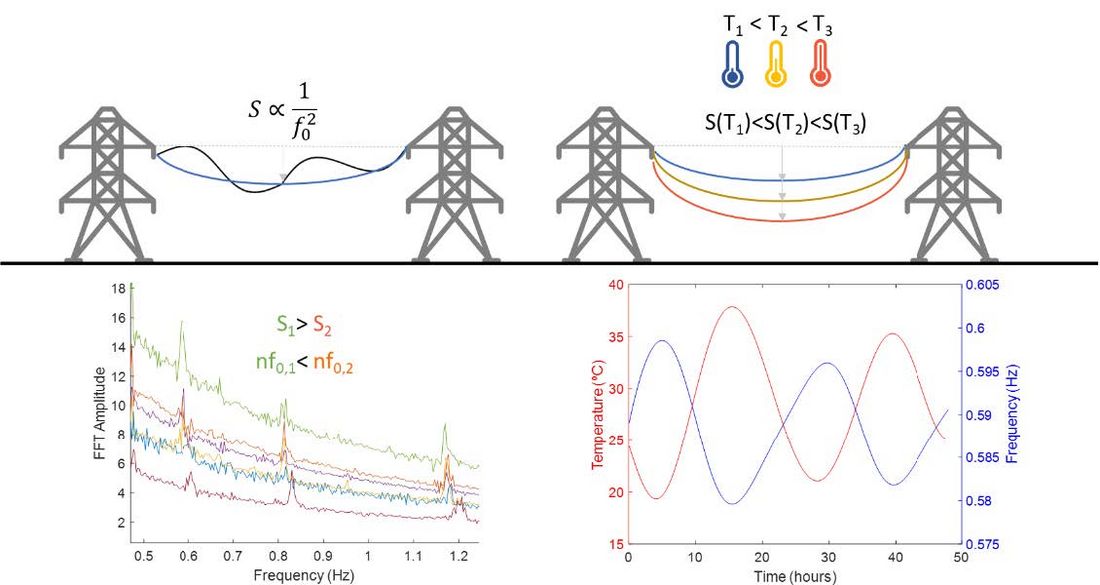
Figure 8 - Frequency’s intensity as function of (low) frequencies. There are four samples for different temperature and hour ranges
Figure 8, lower left, shows the frequency analysis of the recovered strain signal between two support points. There it can be seen the natural frequency and its harmonics for the different series corresponding with different temperatures as it is explained in the literature [3]. Not only does this information provide the live value for the sag in each span, but it also provides information of structural or thermal events that can be correlated to anomalous values or variations. Fig. 8, lower right, shows agreement between the variation of the measured natural frequency, consequently the sag, and the environmental temperature [4].
4.1.4 Asset perimeter security
DAS technology has yet another application: securing EPU assets. There is a real need to watch, protect and be reactive against non-authorized intrusions, sabotaging activities, or thefts in both substations and pylons.
We can distinguish two assets according to their perimeter size: 1) continuous assets, with a fibre sensor length longer than 100 m (perimetral fibres) and, 2) singular assets with sensing fibre lengths shorter than 100 m, as figure 9 shows. This classification impacts on how the data acquired from the DAS system is processed.
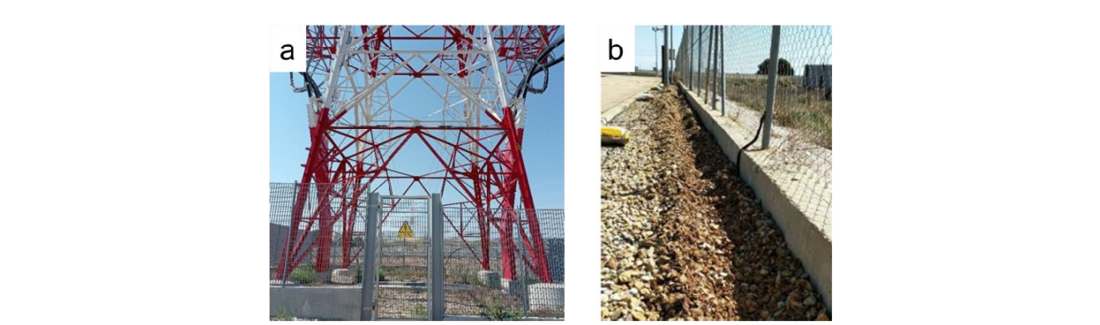
Figure 9 - Application of DAS technology for asset perimeter security. Figure a) shows a discrete asset (overhead-to-underground tower); figure b) shows a fence in a continuous asset
In general, the most important kind of events to be alerted in the two locations, both continuous and singular assets are trespassing caused by 1) climbing or 2) cutting the fences. Both intrusions were tested as it is shown in Fig.9 while the DAS system was tested and calibrated.
In this scenario the fibre was installed in two locations, along the fence and buried underground following the inner perimeter. In these kind of security systems, the alarm is activated when at least, one of the sensors is switched-on, either the sensor located just out of the asset, in the fence, or inside the asset, but for each case the reactive and proactive action is totally customizable. An important remark is that the alarm is the final notice about an event acquired from the DAS technology and after it is processed by different layers of Machine Learning techniques (as it is explained Chapter 3).
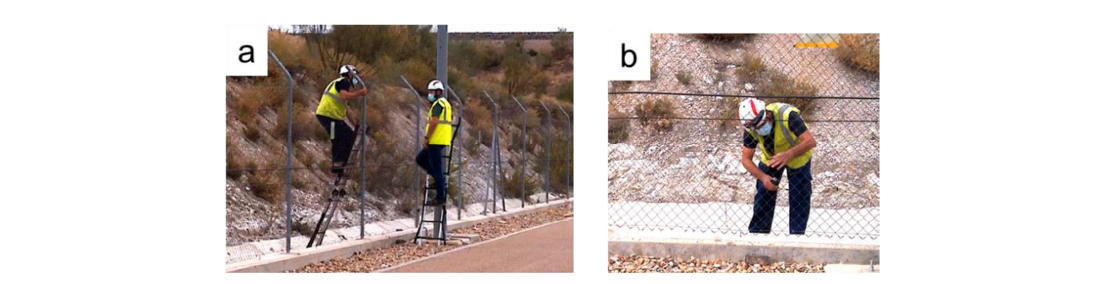
Figure 10 - Examples of intrusion's event in perimeter applications. Figure a) shows a fence’s climbing; figure b) shows fence cutting
Figure 11 shows how DAS technology can detect and identify an intrusion in a perimeter after climbing the fence and trespassing on the facilities. The images are a colormap representing the energy of the signal, which is related to the stimulus taking place close the optical sensor.
In Fig.11 a, the recorded event was constituted by two consecutive activities: 1) climbing the fence which stimulated the optical fibre on it, and 2) the irrupting on the installations stepping in the optical fibre buried on the ground.
On the other hand, in Fig.11 b, it is shown just the event of cutting fence along one minute. This picture presents a clear image of the contrast obtained for those location and times where the stimulus is taking place compared with the moments and places where no event is performed. For this event, the signal has been processed with a band-pass frequency filter that filters out the low frequency environment noise. This feature is related to the false alarm rate which has been proved to be critical in security applications.
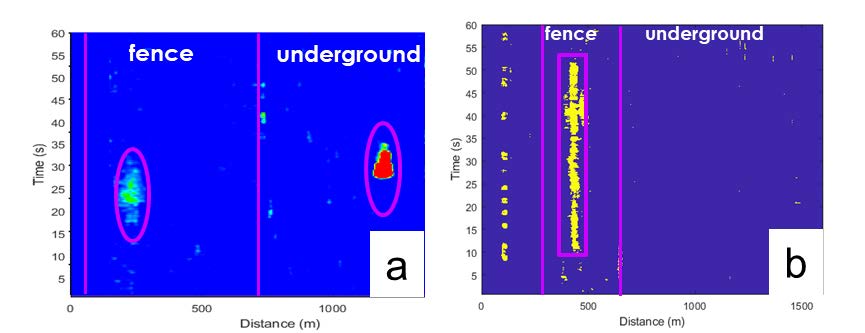
Figure 11 - Waterfall representation of events. a) climbing the fence; b) fence cutting
Sabotages in pylons have also been simulated in order to detect the removal of any the tower’s components such as screws or other metallic parts.
5. Conclusions
In this work we have presented the DAS technology. Different applications have been tested, particularly in the fields of asset management and security. Some of the results show the potential use of this technology in EPUs and its beneficial application in the maintenance field as it helps to prevent, warn, and be responsive when the assets integrity is compromised.
DAS technology has proven to be capable of obtaining distributed information along the line. Furthermore, this information is obtained automatically and in real-time.
Not only does the system provide novel information that could not be obtained by other means before (e.g., real-time information along the whole monitored line), but it also provides information we could already obtain, but in a more comfortable or quicker way (information can be received in a remote maintenance centre instead of patrolling lines, for instance).
Besides, this technology has the advantage to use the fibre optic network already deployed by EPUs for other original uses (i.e., communications), significantly minimizing its installation costs.
During the different pilot projects, we have realized that other unforeseen applications are possible such as detection of seismic events or impacts in overhead lines. This leads us to think in other potential uses of the DAS system by detecting other events, which makes our own fibre optic networks even more versatile.
References
- Y. Koyamadı, “Fiber-optic distributed strain and temperature sensing with very high measurand resolution over long range using coherent OTDR”, Journal of Lightwave Technology 27, no. 9, 2009.
- M. Fernández Ruiz, L. Costa, HF. Martins, “Distributed acoustic sensing using chirped-pulse phase-sensitive OTDR technology”, Sensors 2019, 19, 4368.
- A.U. Mahin, S.N. Islam, F. Ahmed, Md. F. Hossain, “Measurement and monitoring of overhead transmission line sag in smart grid: A review”, IET Generation, Transmission & Distribution, 2021
- B. Godard, “A vibration-sag-tension-based icing monitoring of overhead lines”, IWAIS 2019
- M. Kraus and P. Hagedorn, "Aeolian vibrations: wind energy input evaluated from measurements on an energized transmission line," in IEEE Transactions on Power Delivery, vol. 6, no. 3, pp. 1264-1270, July 1991, doi: 10.1109/61.85875.
- Powell, Alan, and A. Shulman. "Effects of wire resonance on aeolian tones." The Journal of the Acoustical Society of America 34.8 (1962): 1146-1147.