The impact of adoption of variable frequency drives on the bulk power system
authors
L. SUNDARESH, P. MITRA, D. RAMASUBRAMANIAN
Electric Power Research Institute - Palo Alto, USA

Summary
Focus on energy efficiency and equipment life combined with the decreasing price of solid-state devices has incentivized the adoption of variable frequency drives (VFDs) among industrial, commercial, and residential customers globally. The steady-state and dynamic behavior of VFDs are markedly different as compared to direct online connected induction motors and realistic load modeling is vital for power system studies. Hence, it is important to assess the impact of this technology adoption on both transmission planning as well as operations. This work analyzes the impact of large scale VFD adoption on both the steady state and dynamic performance of the power system through a demonstration on an example industrial system.
keywords
Induction motor - load modeling - variable frequency drive1. Introduction
Increased customer demand, stricter mandates on use of energy efficient devices, and surging energy prices have propelled the rate of adoption of VFDs for motoring applications [1,2]. Despite the large initial investment, advantages like better controllability, energy efficiency and reduction in wear and tear of the machines have made VFDs popular with industrial and residential customers. Since motor driven loads comprise an overwhelming majority of the total system electric load (in terms of MW), a large-scale adoption of VFDs can impact both the steady state as well the transient performance of a power system [3,4,5]
Compared to direct online (DOL) connected induction motors, VFD interfaced motor loads operate close to unity power factor in steady-state and have a significantly different response during faults both in terms of short circuit contribution as well as the dynamics related to motor reacceleration [6,7,8]. Additionally, VFDs do not provide any frequency dependent load damping, which is characteristic of all motor loads [9,10,11]. Furthermore, unlike motors that have standard (National Electrical Manufacturers Association) NEMA designs, the response of a VFD depends on its controller settings, which can be significantly different between different processes. The diversity in the VFD dynamic response brings additional challenges to assessing their impact on power system stability.
As VFDs become more ubiquitous in the system, power engineers need to be aware of their impact on the various aspects of power system behavior. The primary purpose of this study is to capture some of the macro effects of VFDs on the stability of bulk electric system. Currently, for such transmission level studies, the variable frequency drives are represented as constant loads. In this work, we have highlighted some meaningful differences in responses that can be captured using a positive sequence VFD model (capable of emulating exponential response) that are relevant to transmission planners especially after a disturbance. This paper highlights the impact of large-scale adoption of VFDs on the steady state response, the fault response, the frequency response, and the small signal response of a power system through a demonstration on an example industrial system.
The paper is organized as follows:
- Section II describes the example system and the models used in this work
- Section III analyzes the impact of VFD adoption on the steady state response of the system.
- Section IV analyzes the impact of VFD adoption on the fault response of the system.
- Section V analyzes the impact of VFD adoption on the frequency response of the system.
- Section VI analyzes the impact of VFD adoption on the small signal response of the system
- Section VII presents the conclusions of this study.
Understanding the impact of VFDs on the steady state, fault and frequency response of the power system is quite important but intuitive. The effect of VFDs on the small signal response, however, is more complex and requires some theoretical investigation. As such, a disproportionate and significant portion of the paper focuses on understanding this aspect.
2. System description
The simulation studies have been conducted using GE PSLF™ [12] (a positive sequence simulator) on a system that represents a large industrial facility with multiple processes as shown in Fig. 1.
The total load of the industrial facility is 125 MVA. There are six motor loads present in the system and the largest load is a 75 MVA motor running an air compressor for various pneumatic processes. One onsite generator (rated 150 MVA) supports the facility during loss of external tie. This facility is assumed to be away from the population centers and is connected with the external system with one strong tie line and one weak tie line.
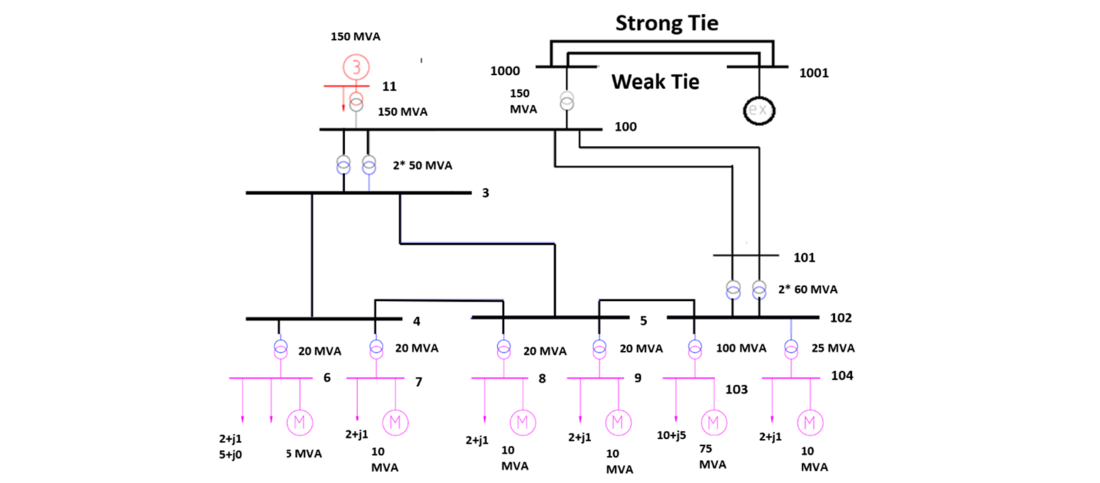
Figure 1 - Sample system representing an industrial facility away from population center
The onsite generator has been modeled using a 5-state round rotor synchronous machine model with a static exciter. Two separate scenarios with the loads modeled as DOL motors and motors connected via VFDs are developed. DOL motors are modeled using a 5-state model. The VFDs are modeled using a user-defined positive sequence model previously developed by EPRI [6] based on extensive lab testing of VFDs. The reduced form of the model presented in [6] used in this study is shown in Fig. 2. The study has been conducted in GE PSLF™ [12] (a positive sequence simulator) and the specific models for the generator, exciter and the motor are:
- genrou for synchronous machine
- exst1 for static excitation system
- motorw for the 3-phase induction motors
The parameters of some of the key models are presented in Appendix A.
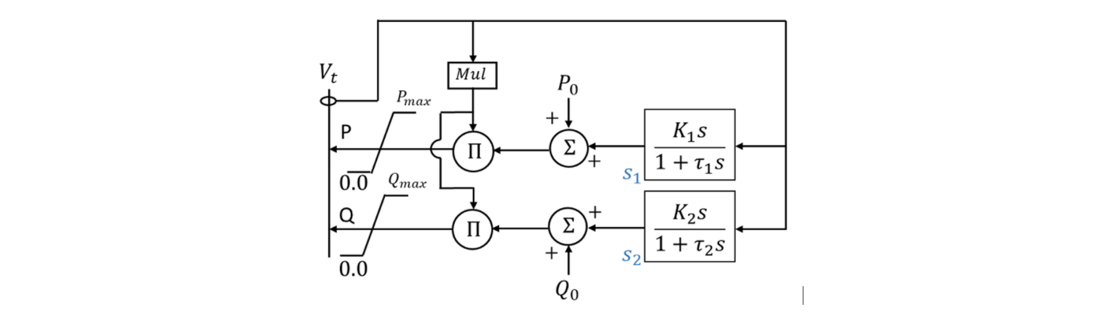
Figure 2 - Block diagram of the VFD model
3. Steady state response
Two cases are developed using the sample system shown in Fig. 1 to compare the steady state response of loads representing DOL motors with VFD. All the loads shown in Fig. 1 are assumed to be DOL motors in Case 1 and in Case 2 are modeled as VFD.Typically, DOL motors operate in a power factor range of 0.85-0.9 at full load [13]. In contrast, VFDs tend to operate close to unity power factor [8]. The effect of the improved power factor and reduced reactive power consumption on the system is demonstrated here. The DOL motors in Case 1 are assumed to operate at a power factor of 0.91 and the drives in Case 2 operate at a power factor of 0.95. A comparison of the steady state bus voltages and the onsite generator reactive power output is shown in Fig. 3 and Fig. 4, respectively. As compared to Case 1, the bus voltages of the facility are elevated in Case 2. The reactive power output of the onsite generator in Case 1 is also higher. The effect of low reactive power consumption of VFDs can result in over voltages if the generator voltage control set point and voltage controlling shunts are not adjusted appropriately.
Operators need to account for these changing characteristics during steady state operation and make appropriate adjustments to the tap settings/ shunt devices.
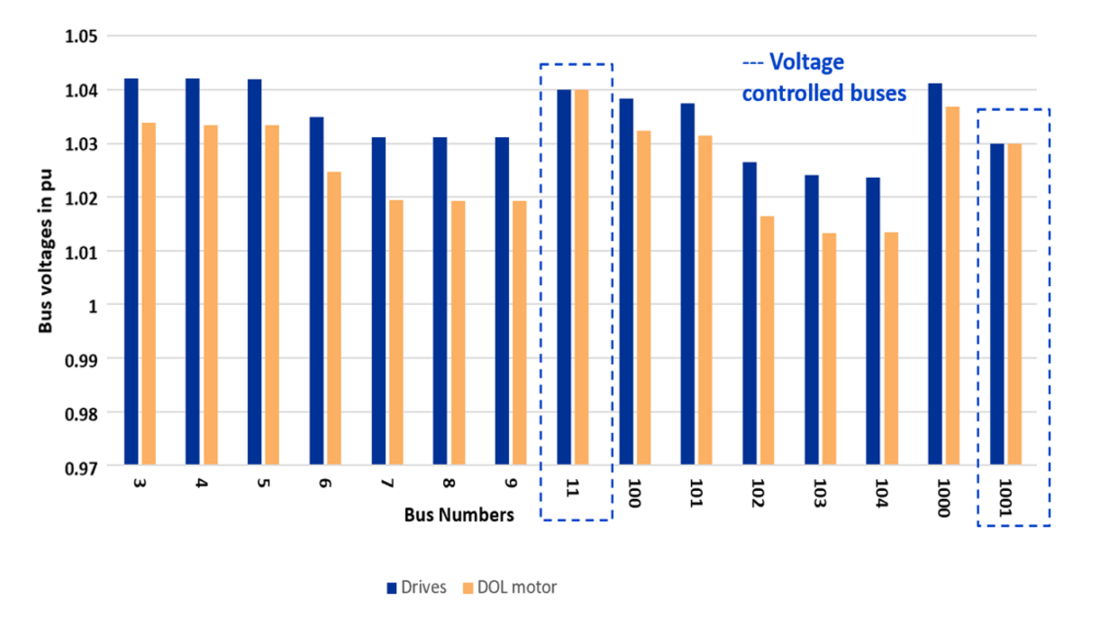
Figure 3 - Comparison of steady state voltages with loads represented as DOL motors and VFD
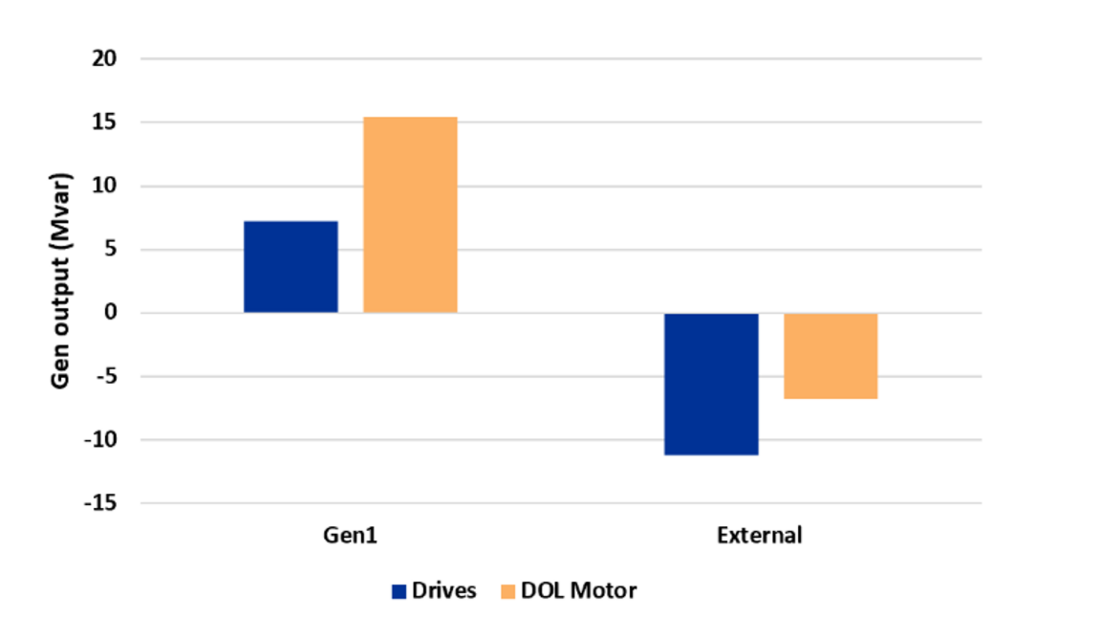
Figure 4 - Comparison of generator output with loads represented as DOL motors and VFD
4. Fault response
To understand the effect of VFDs on the fault response, a three phase -ground fault is applied on the strong external tie and the fault is cleared by disconnecting the line in 6 cycles. The terminal voltage, and the active and reactive power consumption of the 75 MVA compressor load connected at bus 103 (as depicted in Fig. 1) is shown in Fig. 5, Fig. 6 and Fig. 7, respectively. The two traces show the response of load and the terminal voltage when the load are driven by a DOL motor and a VFD respectively. The key differences in the fault response are as follows:
- During the fault, both active and reactive power consumption by the VFD model drops close to 0 as shown in Fig. 6, and Fig. 7. This is due to the reverse biasing of diodes that are present in the grid side converter of a VFD, that forces the current consumption to 0. As such, VFDs do not provide any short circuit contribution to the fault. In contrast, DOL motors contributes to the short circuit current as can be seen in the reactive power load curve shown in Fig. 7.
- The DOL motors draw a significantly large amount of active and reactive power during reacceleration after the fault is cleared. This results in a slower voltage recovery. VFDs, as the model shows, avoids the reacceleration inrush by ramping up the process in a controlled manner. This characteristic of VFDs and electronic starters causes the voltage to recover faster to the pre fault values. The results shown here highlights that adoption of VFDs helps in improving the voltage recovery in a system right after the fault.
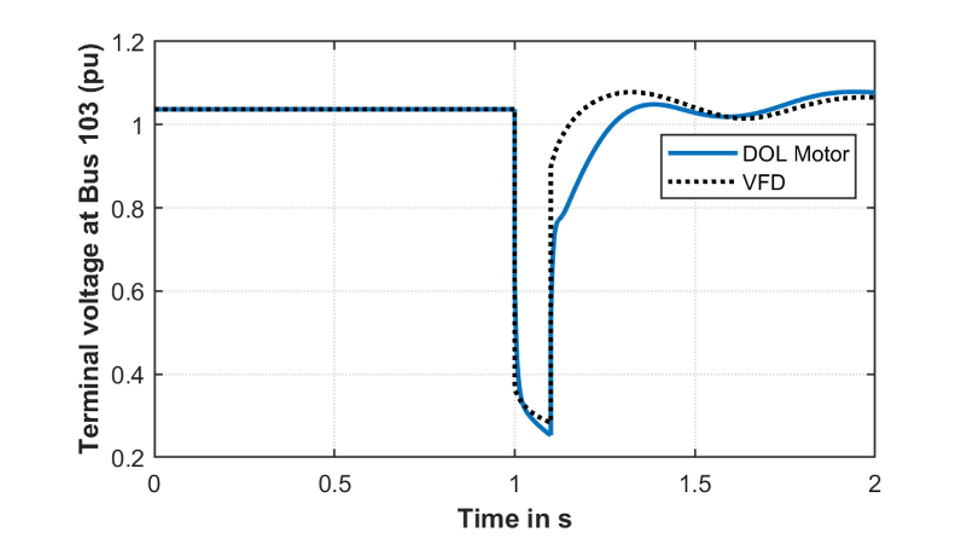
Figure 5 - Comparison of terminal voltage to a fault
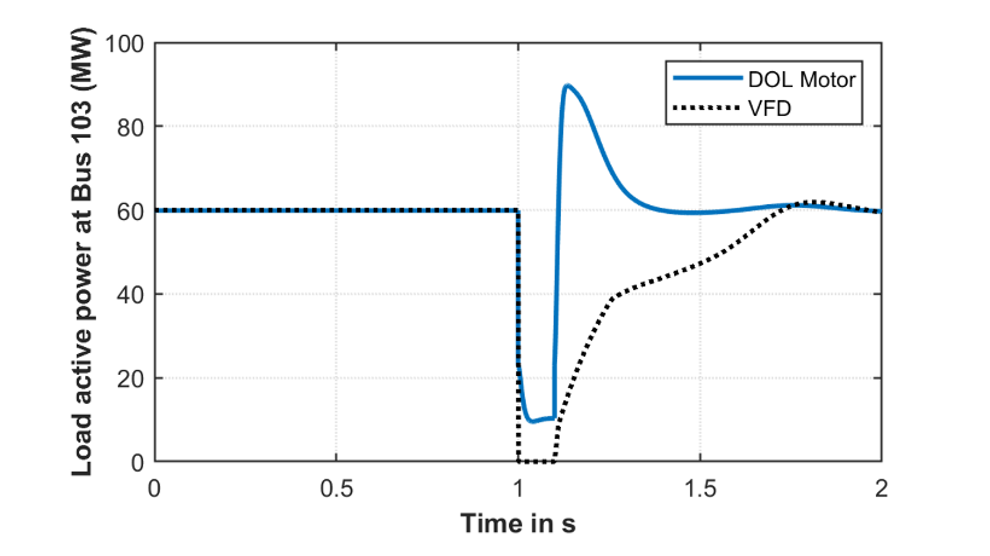
Figure 6 - Comparison of load active power during a fault
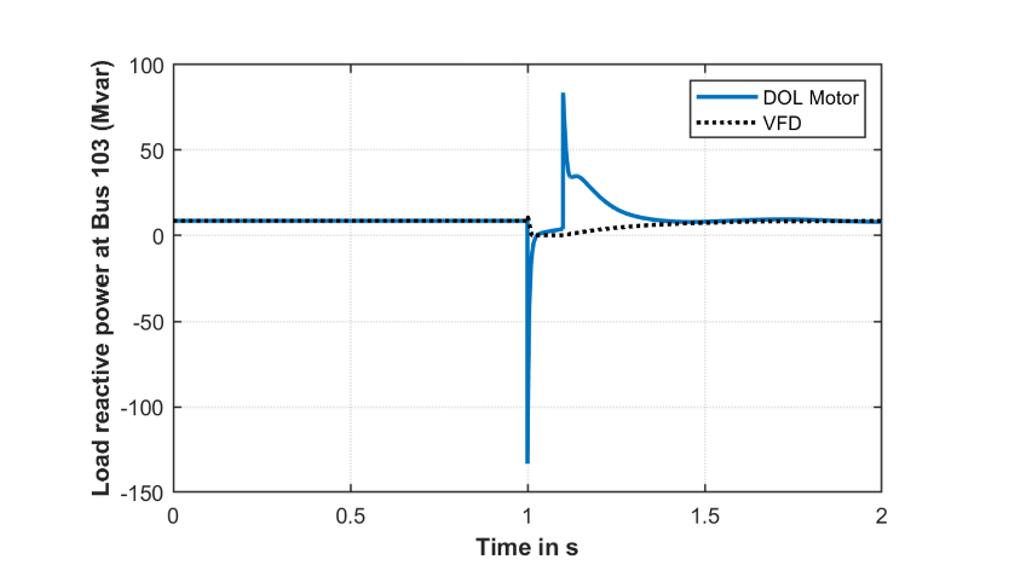
Figure 7 - Comparison of load reactive power during a fault
5. Frequency response
To study the frequency response of the system with DOL motors and after the adoption of VFDs, the example system is modified to include a 22.5 MVA generator at Bus 3 as shown in Fig. 8. This generator is disconnected at 1s and the active power consumption of the load and the generator speed is shown in Fig. 9 and Fig. 10 respectively. It can be seen that the active power consumption of DOL motor connected at bus 103 decreases as the speed drops, whereas when replaced with a VFD consumes near constant active power. The reduction in active power consumption with a drop in frequency is called load damping. The loss of load damping due to the adoption of VFDs will result in a lower frequency nadir as shown in Fig. 10. The results shown here highlights that the adoption of VFDs will result in a deepening of the frequency nadir for the same generation loss event.
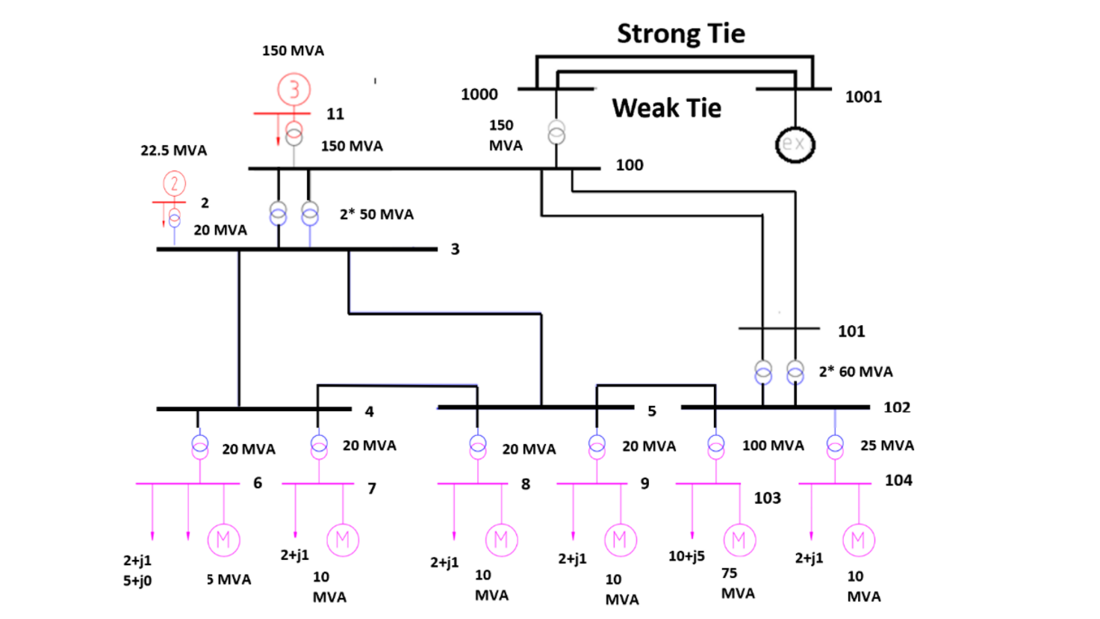
Figure 8 - Modified sample system with two onsite generators
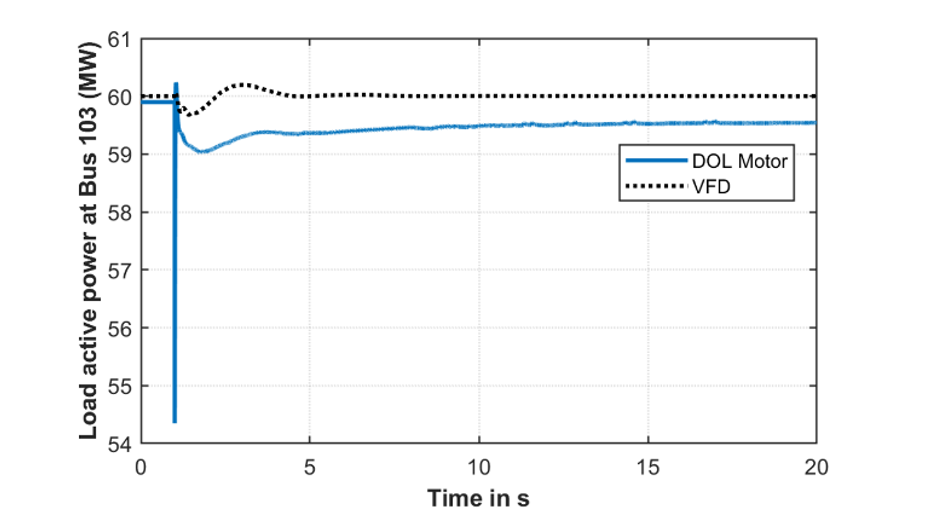
Figure 9 - Comparison of load active power during generator loss event
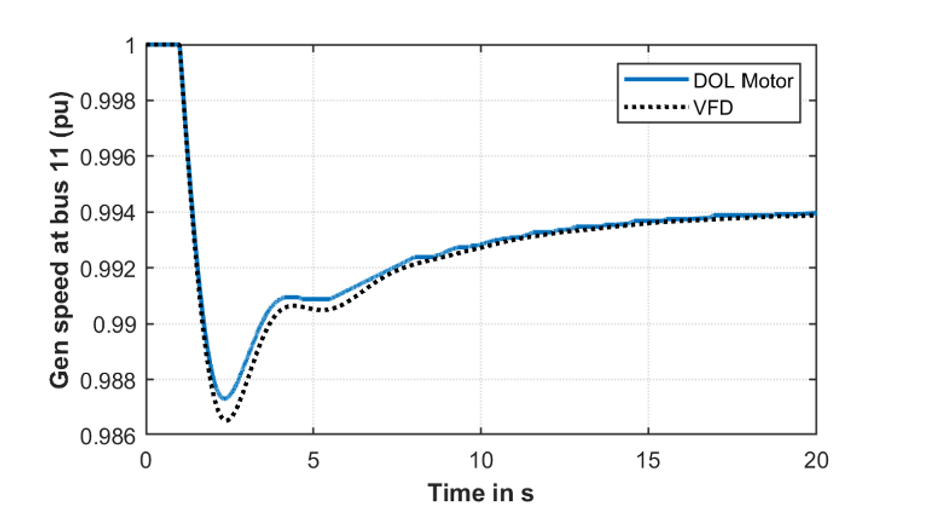
Figure 10 - Comparison of the frequency response during generator loss event

6. Small signal response
Prior to assessing the impact of large-scale adoption of VFDs on small signal stability of the system, it is important to first assess the impact of load dynamics on damping. The impact of load dynamics has been studied before [14,15,16]. However, these techniques rely on eigenvalue analysis approaches. Rather, in this paper an intuitive phasor-based approach is used that can be used directly to analyze the simulation results without the need for an eigenvalue assessment.
The effect of loads on damping can be understood by examining the effect of excitation systems on small signal stability. A single machine (without PSS) infinite bus model with a local load as shown in Fig. 11 is used to motivate this discussion. The small signal model for this system shown in Fig. 12. This model has been adopted from [17]. The constants K1, K2, K3, K4 and K6 are typically positive. However, the sign of the K5 is dependent on the operating condition of the generator and the external impedance of the system. When the generator is operating close to its limit and the external impedance is high K5 becomes negative and in most other conditions it is positive. The significance of the sign of K5 on system damping is explained using the normalized phasor diagrams shown in Fig. 13 and Fig. 14. It should be noted that the phasors are approximately drawn. Additionally, the phasors have been normalized because phase relationships are more pertinent to the discussion presented here. The phasors denoted as damp and synch in Fig. 13 and Fig. 14 represent direction of damping torque and synchronizing torque respectively.
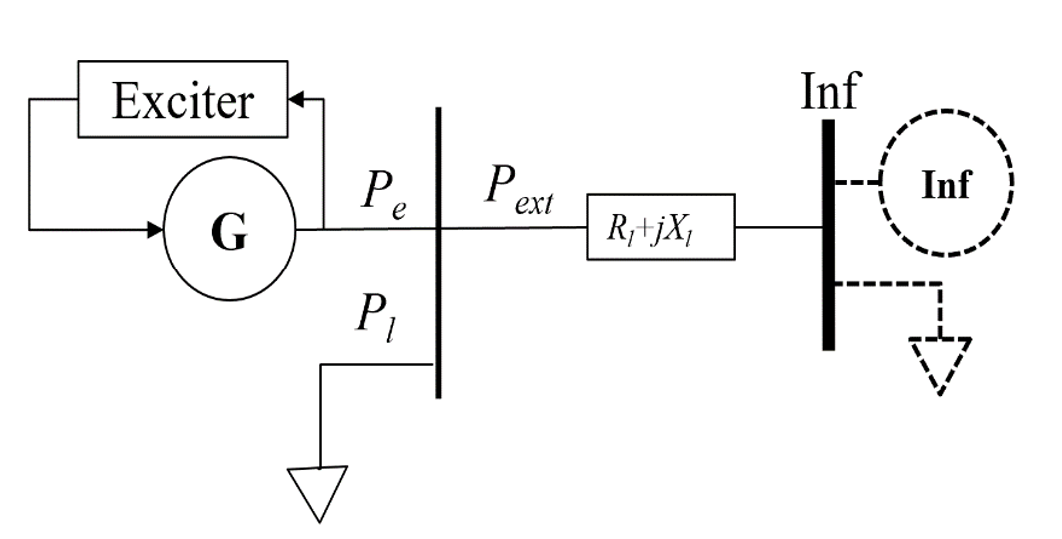
Figure 11 - Single machine Infinite bus representation
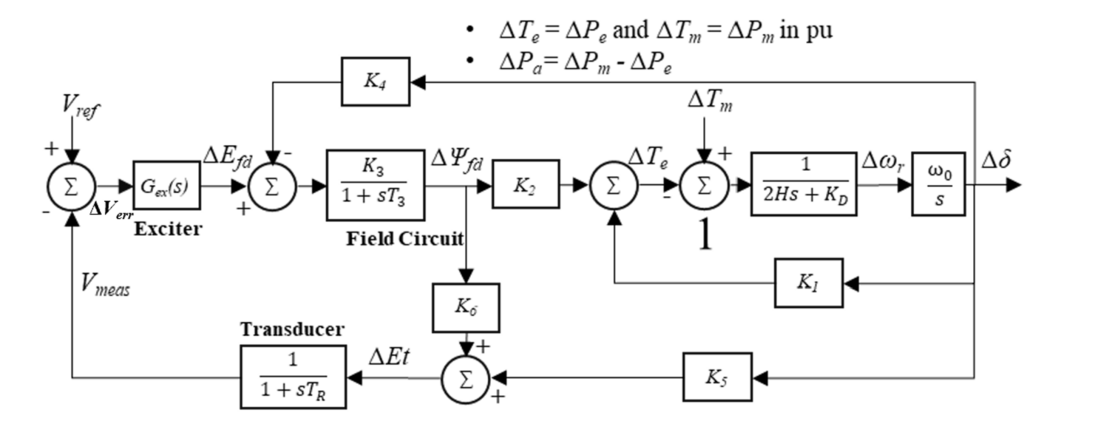
Figure 12 - Classical small signal representation of a system [17]
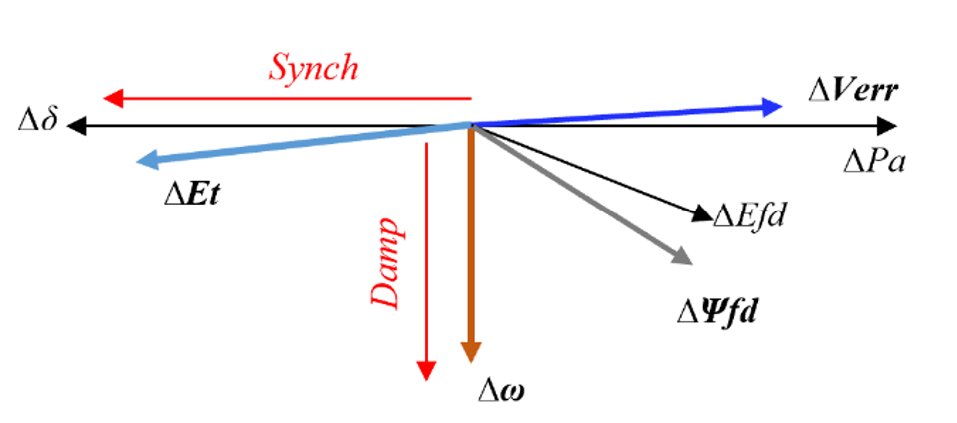
Figure 13 - Phasor diagram of a system with K5 positive
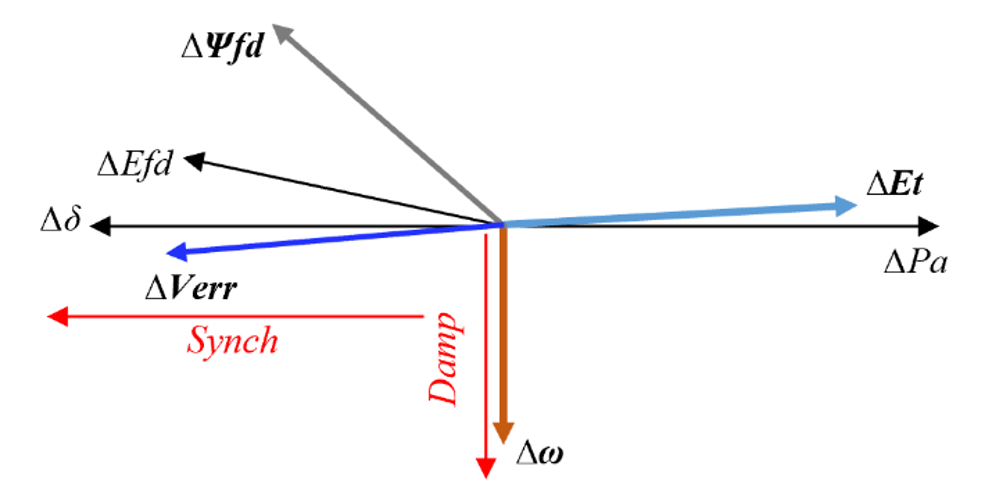
Figure 14 - Phasor diagram of a system with K5 negative
When the system is perturbed by a small disturbance ΔPm, the following phase relationships hold true under all system conditions:
- ΔPm is the same as ΔTm as the quantities are in pu,
- Δδ lags the Δω by 90 degrees.
- ΔVerr is out of phase with the ΔEt phasor
- ΔEfd and Δψfd lags the ΔVerr phasors
From Fig. 13 and Fig. 14, it can be seen that the relative position of the ΔEt phasor with respect to the Δδ phasor is dependent on the system conditions (sign of K5). Therefore, depending on the system conditions the torque produced by Δψfd (K2 Δψfd in Fig. 12) which leads the ΔEt phasor aids or negates the system damping. When K5 is positive (see Fig. 13) the Δψfd from the exciter contributes to the damping torque whereas, when K5 s negative (see Fig. 14) the excitation system negates the damping. The key takeaway from this exposition is that the local voltage is approximately in phase quadrature with the Δω and any electrical torque (same as the electrical power in pu) that leads the voltage will affect the damping in a positive or negative way depending on the system conditions. The electrical power perturbation of a load is dependent of the voltage perturbations at its terminal and the same approach discussed here can be used to understand the effect of loads on the damping of the system.
The impact of the load dynamics under different operating conditions is demonstrated using two scenarios:
- Scenario 1: In this case the industrial facility is importing 49 MW from the external system and the local generator is operating well within its limits.
- Scenario 2: In this case the industrial facility is exporting 1 MW to the external system and the local generator is operating closer to its limits and the system is stressed.
For each of these scenarios, the effect of replacing DOL motors with VFD is studied for an external system fault. The external fault is a single line to ground (SLG) fault applied for a duration of six cycles on the strong tie and later the line is disconnected Since most motor loads have standard design [18], their dynamic response can be modeled using standard parameters. However, VFDs are highly controllable, and their electrical response will depend on the end process. The effect of different control options on the dynamic response can be represented by selecting suitable values for K and τ as shown in Fig. 2.
Considering this, for each of the operating conditions: Scenario 1 and Scenario 2, the following three cases are considered:
- Case A: The motoring loads are driven by DOL motors
- Case B: The motoring loads are driven by VFDs with slow dynamics
- Case C: The motoring loads are driven by VFDs with fast dynamics
The values of K and τ (Fig. 2) used to represent slow and fast VFD dynamics for Case B and Case C is shown in Table I.
| Parameter | VFD with fast dynamics | VFD with slow dynamics |
|---|---|---|
K1 | 0.25 | 1.25 |
τ 1 | 0.02 | 1 |
K2 | 0.01 | 0.01 |
τ 2 | 0.1 | 0.1 |
A. Scenario 1
A single line to ground (SLG) fault is applied for a duration of six cycles on the strong tie and the line is disconnected. Fig. 15 shows the normalized phasors for the load active power (ΔP), the load terminal voltage (ΔV) and the onsite generator speed (Δω) for each of three cases, Case A, B, and C during the settling period of the fault response. Two important observations can be made from Fig. 15:
- ΔV at the load terminal lags the Δω phasor (indicating a positive K5).
- The load ΔP in all three cases lead ΔV and are within phase quadrature with Δω. The ΔP in all three cases have components in phase with Δω and are expected to provide positive damping contribution.
Fig. 16 and Fig. 17 shows the generator speed and generator voltages at Bus 11 for the three different cases. The frequencies and the damping ratios of the interarea modes are calculated using the eigen realization algorithm [19] for the three cases and are listed in Table II. Although the three cases have adequate damping, the damping ratio decreases as DOL motors are replaced by VFDs. Furthermore, using VFDs with slower dynamics results in the largest reduction in damping. It is also worthwhile to mention that the interarea oscillation frequency does not change appreciably as the load models are modified.
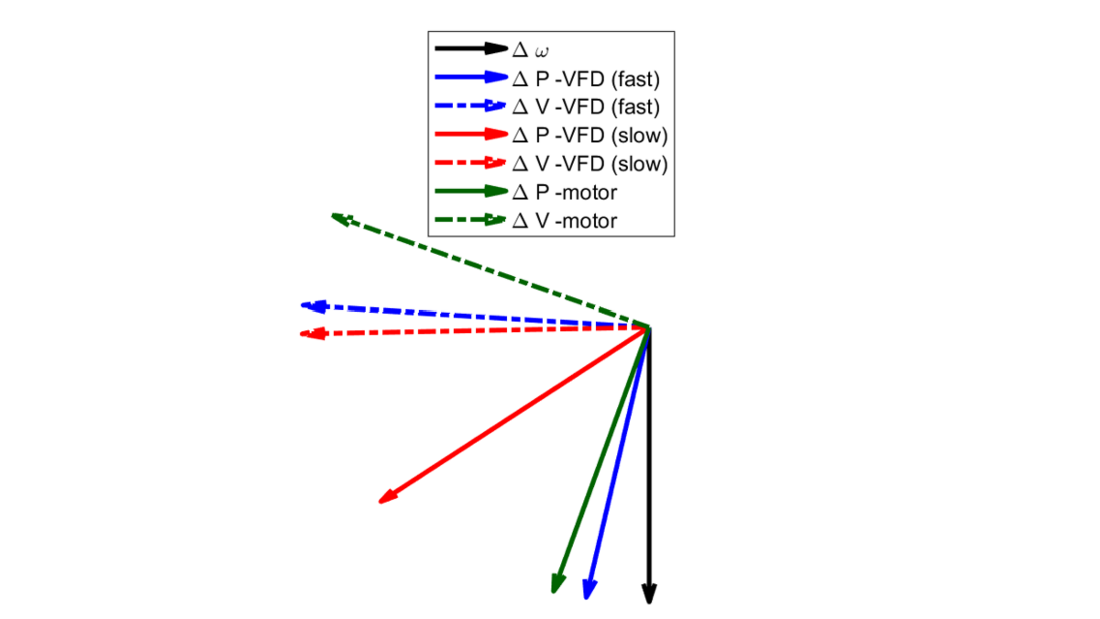
Figure 15 - Phasor diagram representing active power load (Case 1)
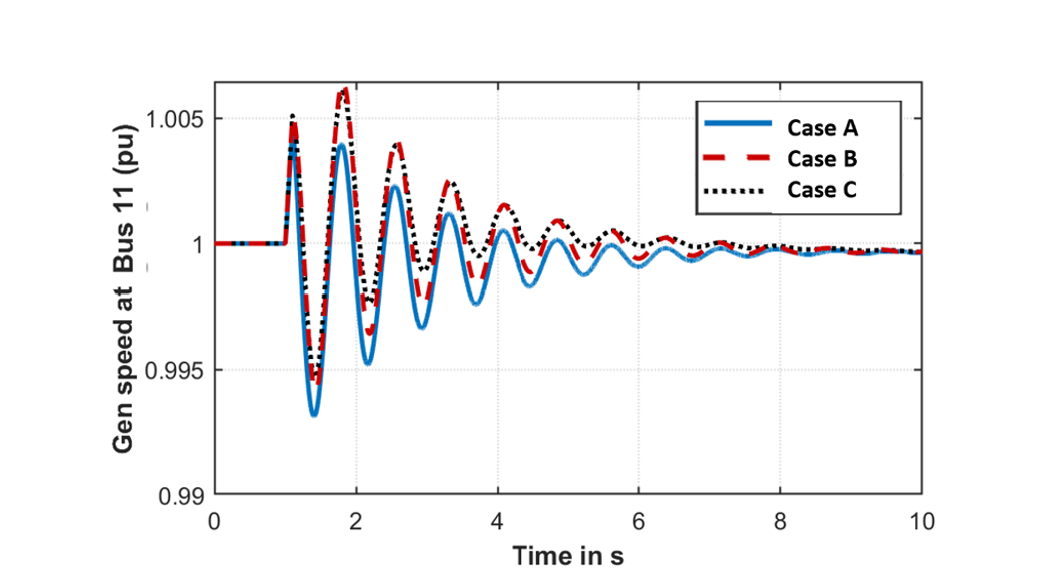
Figure 16 - Comparison of generator speed (Case 1)
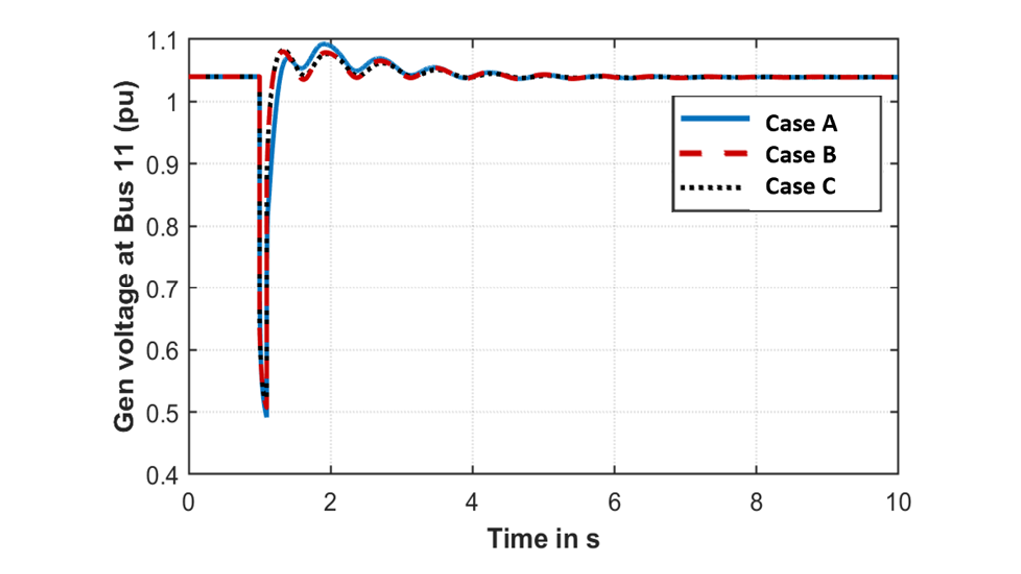
Figure 17 - Comparison of generator terminal voltage (Case 1)
| Scenario 1 | Load model | Damping ratio | Frequency |
|---|---|---|---|
Case A | DOL motor | 60.37 | 1.254 |
Case B | VFD (slow) | 41.89 | 1.312 |
Case C | VFD (fast) | 53.62 | 1.301 |
B. Scenario 2
The same fault as described in scenario 1 is applied on the strong external tie. Fig. 18 shows the normalized phasors for the load active power (ΔP), the load terminal voltage (ΔV) and the onsite generator speed (Δω) for each of three cases, Case A, B, and C during the settling period of the fault response. Two important observations can be made from Fig. 18:
- ΔV at the load terminal leads the Δω phasor (indicating a negative K5).
- The load ΔP in all three cases lead ΔV and lead Δω by more than 90 degrees. The ΔP in all three cases have components out of phase with Δω and are expected to negate the system damping.
Fig. 19 and Fig. 20 shows the generator speed and generator voltages for the three different cases. The frequencies and damping ratios of the interarea mode for the three cases are listed in Table III. From the damping ratios listed here, it can be seen that the damping in scenario 2 is much less as compared to scenario 1. This can be expected since scenario 2 is a more stressed condition where the onsite generator is trying to export more power over the remaining weak tie line. Similar to scenario 1, it can be seen that replacing the DOL motors with VFDs results in further reduction of damping. However, contrary to scenario 1, the maximum reduction in damping (to the extent that the system damping is negative) is observed when the VFDs have fast dynamics. This can be understood qualitatively by observing the phasors in Fig. 15 and Fig. 18. For the VFD with fast dynamics the load ΔP phasor has a larger phase lead with the terminal voltage (ΔV) which causes the ΔP to be more in phase with Δω in scenario 1 and more out of phase with Δω in scenario 2. This results in the VFD with fast dynamics to provide more positive damping in scenario 1 and more negative damping in scenario 2. This is further amplified by noting (from Table I) that the transient gain of the fast VFD is 10 times that of the slow response VFD.
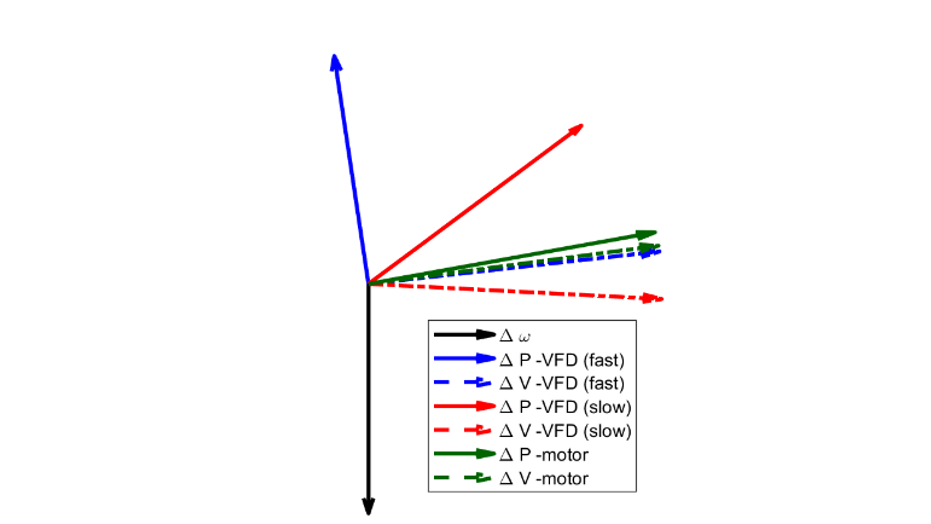
Figure 18 - Phasor diagram representing active power load (Case 2)
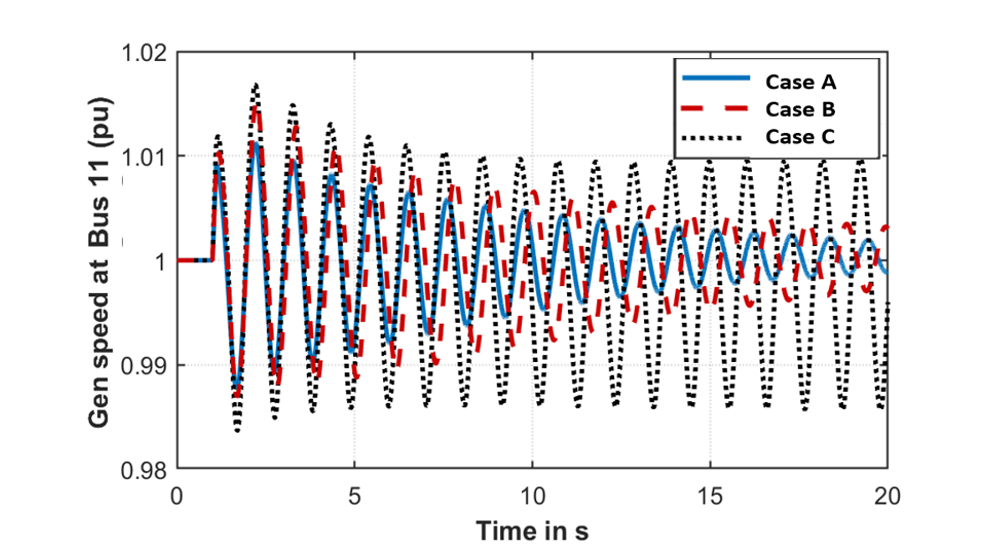
Figure 19 - Comparison of generator speed (Case 2)
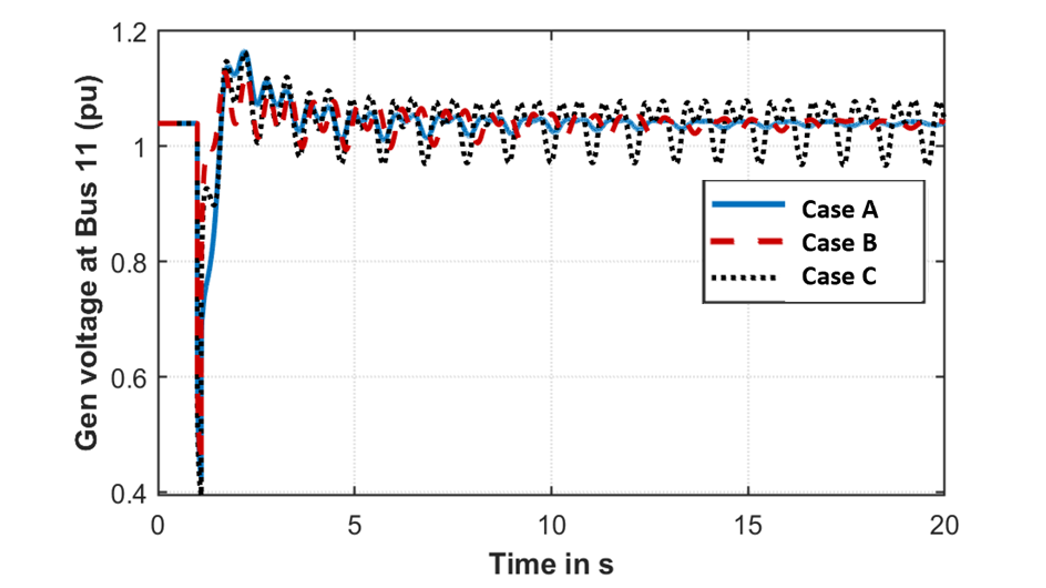
Figure 20 - Comparison of generator terminal voltage (Case 2)
| Scenario 2 | Load model | Damping ratio | Frequency |
|---|---|---|---|
Case A | DOL Motor | 13.63 | 0.921 |
Case B | VFD (slow) | 9.76 | 0.905 |
Case C | VFD (fast) | -1.26 | 0.939 |
7. Conclusion
In this work, the impact of large-scale adoption of VFDs on system response and stability is demonstrated using a sample system. The following recommendations can be made from the results:
- During steady state operation, large scale connection of motors via VFDs, may lead to elevated voltages and the operators might have to revisit tap setting
- During faults, the short circuit contribution might be reduced when motors are connected via VFDs and lead to lower on fault voltages as compared to DOL motors. However, using VFDs prevents reacceleration inrush currents that may help improve the voltage response after the fault is cleared.
- VFDs do not provide any load damping. As such transitioning to the use of VFDs will lead to lower frequency nadirs during generation loss events. System planners and operators need to ensure that this effect is considered during frequency response studies.
- Loads have a profound impact on the damping of the power system. The effect of the local loads on the damping depends on whether that portion of the system is importing or exporting power. Systems that tend to export power during peak load conditions need to evaluate how adoption of VFDs will impact the interarea oscillation modes of the system. Based on the changing landscapes, modal analysis and tuning of Power System Stabilizers will have to be conducted more frequently to ensure small signal stability [20]. Additionally, planners also need to properly parameterize the VFD models as VFDs can have a significant diversity in their control settings which govern their dynamic responses. The work presented here has demonstrated that a fast or slow response from VFDs can have an impact on its contribution to damping.
The work presented here has highlighted that as VFDs become more pervasive in the system, their impact on different aspects of power system reliability needs to be assessed. Presently, majority of commercial power system simulators lack such models, although these models are being considered for inclusion in these tools. In future as the models become available, the impact of VFDs will be demonstrated on a large-scale realistic transmission planning case.
8. Appendix A
Generator model at Bus 101:
genrou 11 "Gen3 " 13.80 "3 " : #9 mva=150.0 "Tpdo" 6.0 "Tppdo" 0.05 "Tpqo" 1.0 "Tppqo" 0.0500 "H" 3.5000 "D" 0.0000 "Ld" 1.5000 "Lq" 1.4000 "Lpd" 0.3200 "Lpq" 0.5000 "Lppd" 0.2000 "Ll" 0.1200 "Sl" 0.1000 "Sl2" 0.6000 "Ra" 0.0 "Rcomp" 0.0 "Xcomp" 0.0
Exciter model at Bus 101:
exst1 11 "Gen3 " 13.80 "3 " : #9 "Tr" 0.0 "Vimax" 1.0 "Vimin" -1.0 "Tc" 1.0 "Tb" 10.0 "Ka" 200.0 "Ta" 0.05 "Vrmax" 5.0 "Vrmin" -5.0 "Kc" 0.0 "Kf" 0.0 "Tf" 1.0
DOL motor model at bus 103:
motorw 103 "LC1 " 4.16 "ED" : #9 mva=-0.9 "Pul" 1.0 "Ls" 3.1 "Lp" 0.1384 "Ra" 0.0001 "Tpo" 0.1028 "H" 0.2 "D" 2.0 "Vt" 0.00 "Tv" 999 "Tbkr" 0.08 "Acc" 1.0 "Lpp" 0.121 "Tppo" 0.0028 "ndelt" 10 "wdelt" 0.8
VFD model with slow response at bus 103:
epcmod 103 ! ! "ED" : #9 "VFD_EPRI.p" 7.0 "Kp_l" 1.25 "Tp_l" 1 "Kp_h" 1.25 "Tp_h" 1 "Kq_l" 0.01 "Tq_l" 0.1 "Kq_h" 0.01 "Tq_h" 0.1 "Td" 0.2 "Tr" 0.005 "vl1" 0.75 "tvl1" 999 "vl0" 0.55 "tvl0" 999 "Vrf" 0.7
VFD model with fast response at bus 103:
epcmod 103 ! ! "ED" : #9 "VFD_EPRI.p" 7.0 "Kp_l" 0.25 "Tp_l" 0.02 "Kp_h" 0.25 "Tp_h" 0.02 "Kq_l" 0.01 "Tq_l" 0.1 "Kq_h" 0.01 "Tq_h" 0.1 "Td" 0.2 "Tr" 0.005 "vl1" 0.75 "tvl1" 999 "vl0" 0.55 "tvl0" 999 "Vrf" 0.7
References
- Variable Frequency Drive Market by Type, End-Users, Application (Pumps, Fans, Compressors, and Conveyors), Power Range, Voltage, and Region - Global Forecast to 2025, online
- Variable Frequency Drive Market Size, Share & Trends Analysis Report, online
- Rao, Prakash, Sheaffer, Paul, Chen, Yuting, Goldberg, Miriam, Jones, Benjamin, Cropp, Jeff, and Hester, Jordan. U.S. Industrial and Commercial Motor System Market Assessment Report Volume 1: Characteristics of the Installed Base. United States: N. p., 2021. Web. doi:10.2172/1760267.
- B. K. Bose, “Global energy scenario and impact of power electronics in 21st century,” IEEE Trans. Ind. Electron., vol. 60, no. 7, pp. 2638–2651, Jul. 2013.
- Waide, P. and C. Brunner (2011), "Energy-Efficiency Policy Opportunities for Electric Motor-Driven Systems", IEA Energy Papers, No. 2011/07, OECD Publishing, Paris,
- Y. Liu, V. Vittal, “Modeling of rectifier-controlled induction motor drive load in transient stability simulation tools,” IEEE Trans. on Power Sys., vol 3, no. 5, pp. 4719-4729.
- D. Ramasubramanian, V. Vittal, “Positive sequence induction motor speed control drive model for time-domain simulations,” IET Gen., Trans., and Dist., vol. 11, no. 7, pp. 1809-1819, June 2017.
- P. Mitra, D. Ramasubramanian, A. Gaikwad and J. Johns, "Modeling the Aggregated Response of Variable Frequency Drives (VFDs) for Power System Dynamic Studies," in IEEE Transactions on Power Systems, vol. 35, no. 4, pp. 2631-2641, July 2020, doi: 10.1109/TPWRS.2020.2966820.
- Technical Update on Load Modeling EPRI, Palo Alto, CA: 2020. 3002019260. Available online.
- R. Bravo, M. Norwalk, “Dynamic performance of air conditioners with variable frequency drive,” in Proc. IEEE PES T&D conf., Dallas, 2016
- F.P. DeMello, J.W. Feltes, “Voltage oscillatory instability caused by induction motor loads,” IEEE Trans. on Power Syst., vol. 11, no. 3., pp 1279-1285., Aug 1996.
- GE PSLF™ v21 User’s Manual
- Khodapanah, M., Zobaa, A.F. & Abbod, “M. Estimating power factor of induction motors at any loading conditions using support vector regression (SVR)” Electr Eng 100, 2579–2588 (2018) online
- J. V. Milanovic and I. A. Hiskens, "Effects of load dynamics on power system damping," in IEEE Transactions on Power Systems, vol. 10, no. 2, pp. 1022-1028, May 1995, doi: 10.1109/59.387947.
- I. Hiskens and J. Milanovic, “Load modelling in studies of power system damping,” IEEE Trans. Power Syst, vol. 10, no. 4, pp. 1781–1788, Nov. 1995.
- M. Garmroodi, D. J. Hill, G. Verbic, J. Ma, “Impact of load dynamics on electromechanical oscillations of power systems,” IEEE Trans. Power Syst, vol. 33, no. 6, pp. 6611-6621, Nov. 2018.
- P. Kundur, Power system stability and control. New York, NY, USA: McGraw-Hill, 1994.
- NEMA Motors and Generators, available online
- J. Juang, R. Pappa, “An eigen system realization algorithm for modal parameter identification and model reduction,” Journal of guidance dynamics and control, Nov. 1985
- "IEEE Recommended Practice for Excitation System Models for Power System Stability Studies," in IEEE Std 421.5-2016 (Revision of IEEE Std 421.5-2005) , vol., no., pp.1-207, 26 Aug. 2016, doi: 10.1109/IEEESTD.2016.7553421.