AI-Driven Web Application for the Evaluation of Renewable Energy Investments: A Case Study of 1MW Solar PV in Durban
M.M CHARFARAY - Engineering Institute of Technology, South Africa

Summary
In the current energy landscape, renewable energy projects are evaluated based on multiple factors, including environmental impact, financial viability, and combined socio-economic benefits such as cost savings, positive public perception, and tax incentives. Assessing these factors requires extensive data collection and complex calculations to determine the potential advantages of deploying renewable energy solutions. To streamline this process, a web-based application leveraging mathematical formulas and artificial intelligence was developed. This application simplifies the evaluation of solar power installations by automating financial and environmental impact assessments, thereby expediting decision-making. The application utilizes data from Helioscope (a solar design and simulation software) to estimate power output and financial metrics for solar installations. A case study involving a 1 MW solar photovoltaic (PV) deployment in Durban was conducted to validate the application’s capabilities. The developed tool processes Helioscope generated data to compute essential financial metrics, including Return on Investment (ROI), Internal Rate of Return (IRR), Net Present Value (NPV), Payback Period, and Levelized Cost of Energy (LCOE). Additionally, it integrates electricity tariff escalation rates and cost projections to estimate potential long-term return on investments. The application further quantifies carbon tax reductions, reflecting the cumulative environmental and economic benefits over the system’s lifespan. Notably, this analysis does not account for potential future increases in carbon taxation, which could further enhance financial returns on renewable energy systems. The user-friendly interface of the application allows seamless data input, requiring only basic parameters for the renewable systems. Upon data submission, the tool rapidly generates data, presenting key insights necessary for stakeholders to determine project feasibility. This capability empowers businesses, municipalities, and individuals to make rapid informed decisions regarding solar energy investments. The tool can be used not just for solar energy calculations but can also be adapted for wind energy provided existing data is available. This case study however, focuses purely on solar due to its relative viability in the region. To enhance system reliability and minimize errors, key machine learning features were integrated as redundancies. For energy generation prediction over time, machine learning models were used to forecast output based on system parameters. For cost prediction, regression models were utilized for estimating installation and operational expenses, while random forests improve maintenance cost projections. This model, with embedded redundancies, ensure accurate calculations, enhance system security, and provide a structured path for decision-making. At its core, the application is designed to deliver quick, reliable insights into carbon footprint reduction and financial projections, giving investors and stakeholders confidence in renewable energy projects. Additionally, it helps industries determine the optimal renewable energy capacity needed to offset carbon taxes efficiently and maximize long-term savings. By providing a clear and efficient evaluation framework, this initiative aims to accelerate the transition towards renewable energy adoption, for a cleaner and more resilient energy future.
Keywords
AI, Carbon Emission Reduction, Financial Modeling, Grid Tariffs, Levelized Cost of Energy, Regression Models, Solar Power1. Introduction
Renewable energy projects present a significant opportunity to mitigate environmental challenges resulting from anthropogenic activities, particularly with respect to carbon dioxide emissions. Although the environmental benefits of renewable energy systems are well-documented, financial feasibility often remains a primary concern that influences project viability. The financial assessment of such projects typically involves complex and time-consuming calculations, which can ultimately determine whether a project is approved or abandoned. To address this challenge, a computational application was developed to facilitate rapid, final-stage financial and environmental evaluations of renewable energy investments [1, 3, 4, 5, 6]. The current version of the application is in a preliminary developmental phase; however, with further programming enhancements and expanded research efforts, it holds the potential to offer substantially higher accuracy and broader applicability.
The application integrates fundamental machine learning algorithms with established mathematical models to automate the final evaluation phase of project assessment [1, 3, 4, 5, 6]. The mathematical formulas employed—detailed in subsequent sections—are designed to eliminate common computational errors, such as the premature application of incorrect parameter values. All essential input parameters are defined at the initial stage, after which the application executes the necessary calculations. Additionally, a reverse calculation feature is incorporated, enabling users to validate system capacity and carbon emission reductions over daily, monthly, or annual intervals, thereby ensuring the accuracy of both energy production and environmental impact estimates [1, 3, 4, 5, 6, 21].
The application outputs results in both tabular and graphical formats. All tables can be exported in PDF format, and graphical outputs can also be downloaded for presentation or reporting purposes. These features facilitate clear communication of results to stakeholders, clients, and financial decision-makers. Furthermore, the application’s current structure makes it particularly suitable for use in client presentations and financial planning discussions. As indicated, the application’s functionality can be significantly expanded through further research and development efforts [22, 23, 26, 27].
Future development may also include the integration of centralized databases containing verified datasets, thereby minimizing manual input requirements and enhancing result accuracy. For example, daily production hours—dependent on the specific renewable resource under consideration—could be automatically derived from real-time weather reports, solar irradiance data, or wind velocity measurements, thereby improving the precision of system performance estimates. Integration with corporate inventory systems may further enable project-specific cost modeling, replacing the reliance on industry-average estimates with real-time, project-specific financial data [22, 23, 26, 27].
2. AI-Driven Web Application for the Evaluation of Renewable Energy
The developed software tool, titled Solar & Wind Financial Analysis, integrates machine learning (ML) and artificial intelligence (AI) techniques to enhance system reliability and enable scalability for future expansions. The incorporation of these AI/ML features serves multiple purposes, including the normalization of heterogeneous data formats and the standardization of data processing workflows. Although the current version of the application is primarily designed for manual data input, the embedded machine learning components ensure that all calculations are executed accurately, consistently, and without computational interruptions.
The development of the application required, as a foundational step, the establishment of baseline mathematical models to support financial and environmental evaluations. Following the formulation of these models, the system was designed to manage intermediate variables—calculated parameters that may not be directly supplied by the user but are essential for subsequent computations. The machine learning modules assist in managing these intermediary datasets by temporarily storing computed values, which are subsequently utilized in downstream calculations and visualizations. These computational steps culminate in the generation of both tabular and graphical outputs, which are structured in sequential stages to support comprehensive result interpretation.
While machine learning assists in dynamic data handling and future interoperability, the primary computational processes are initially executed via conventional programming algorithms. Machine learning functions are selectively invoked when complex data relationships or missing values are encountered. In instances where essential input data is unavailable, the system is designed to generate appropriate error notifications. Specifically, missing values are flagged using the 'NaN' (Not a Number) standard, thereby maintaining computational integrity and user awareness.
Beyond its primary financial and environmental evaluation capabilities, the application’s machine learning architecture also offers potential for integration into broader grid management and control frameworks. For instance, coupling real-time weather forecasting data with the application could support predictive maintenance scheduling for power generation units and protective relays. Furthermore, with appropriate modifications, the system could facilitate the transition of large-scale electrical grids from carbon-based to renewable energy generation, by dynamically distributing load demands across multiple renewable resources. Such enhancements would leverage the system’s capacity to execute precise, multi-variable optimization algorithms, thereby extending asset lifespans and improving grid resilience.
The modular design of the machine learning framework further allows for seamless integration with external software platforms. The application can function as either a stand-alone evaluation tool or as a computational module within larger, more complex system architectures. However, such integrations may require additional interface development to ensure compatibility with external data structures and operational protocols.
3. Objective of this application
The primary objective of the developed application is to provide quantitative metrics that assist stakeholders in evaluating both the financial viability and environmental impact of renewable energy projects. By streamlining the calculation process, the application requires only a minimal set of input parameters to generate comprehensive assessments. This simplification accelerates project approval and decision-making processes by reducing the time typically required for extensive feasibility analyses. Nevertheless, the current version of the application remains under development, and ongoing refinement is expected to enhance its ability to accommodate a wider range of variables and to improve predictive accuracy.
Financial modeling for renewable energy investments often involves intricate calculations that extend beyond intuitive estimations. For example, determining the optimal size of a solar photovoltaic (PV) system requires the consideration of multiple variables, including the average number of peak sunlight hours per day, annual solar irradiance levels, and panel conversion efficiency. Comparable complexities exist for other renewable energy sources such as wind, hydroelectric, and tidal systems, each with distinct technical and environmental parameters. The application simplifies these multifactorial inputs by allowing users to input averaged daily energy production values. Furthermore, in situations where clients wish to verify the appropriateness of a proposed system size, the application offers reverse calculation functionality. This feature enables users to determine the required system capacity based on either a target energy output or a desired reduction in carbon dioxide (CO₂) emissions. Once these parameters are defined, the application executes the relevant calculations and presents the resulting financial and environmental projections.
The generated results serve to inform and encourage clients to proceed with renewable energy investments by clearly demonstrating both the economic returns and environmental benefits. In addition to standard revenue projections, the application accounts for system degradation and operational lifespan, thereby allowing the calculation of key financial performance indicators such as Net Present Value (NPV). These metrics assist stakeholders in assessing the long-term profitability and financial sustainability of a given project.
An additional objective of the application is to quantify the reduction in CO₂ emissions attributable to the deployment of renewable energy systems. The application is capable of translating emission reductions into easily interpretable metrics, such as the equivalent number of internal combustion engine vehicles offset or the corresponding reductions in corporate CO₂ tax liabilities. Such quantifications provide tangible incentives for organizations to pursue renewable energy projects, as they may directly influence tax rebates or carbon credit allocations, thereby improving the overall financial attractiveness of the investment.

4. Program formulae
Nomenclature
- Ct : Net cash flow at time t (USD)
- Et: Energy output at time t (kWh)
- r: Discount rate (%)
- IRR: Internal rate of return (%)
- LCOE: Levelized cost of electricity (USD/kWh)
- Q: Total energy output over lifetime (kWh)
- TIC: Total installed cost (USD)
1. Net Present Value (NPV)
(1)
- Ct : Net cash flow in year t (negative for costs, positive for savings/revenue)
- Degradation: Power Outputt=System Capacity×(1−Degradation Rate)t×Daily Production Hours×365Power
- Revenue: Electricity Pricet=Initial Electricity Price×(1+Electricity Price Increase)t
2. Internal Rate of Return (IRR)
(2)
- Solved iteratively to find the discount rate where NPV = 0
3. Return on Investment (ROI)
(3)
- Total Net Profit: NPV−Initial Investment.
4. Levelized Cost of Electricity (LCOE)
(4)
- Ct : includes initial investment, operational costs, and financing expenses
5. Payback Period
(5)
- Cumulative cash flows must offset the initial investment.
6. Yearly Carbon Reduction
(6)
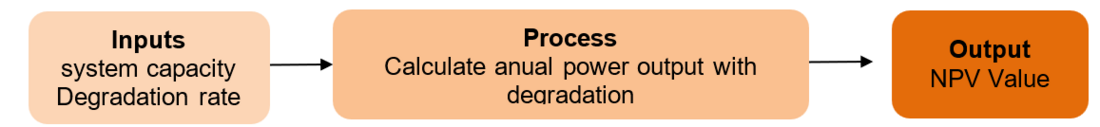
Figure 1 - NPV Calculation Process
- Inputs:
- System capacity, degradation rate, daily production hours, electricity price.
- Process:
- Calculate annual power output with degradation.
- Compute annual revenue using escalating electricity prices.
- Discount cash flows to present value.
- Sum all present values.
- Output:
- NPV value.
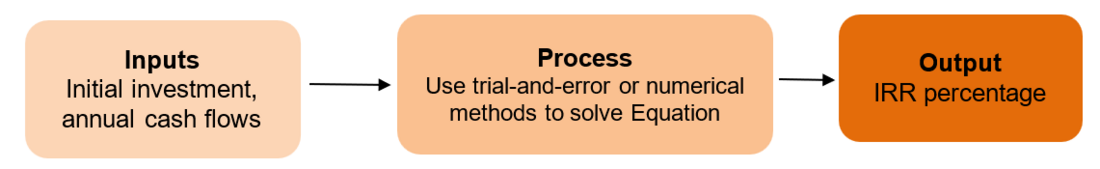
Figure 2 - IRR Determination (Chatgpt generated)
- Inputs:
- Initial investment, annual cash flows.
- Process:
- Use trial-and-error or numerical methods to solve Equation (2).
- Output:
- IRR percentage.
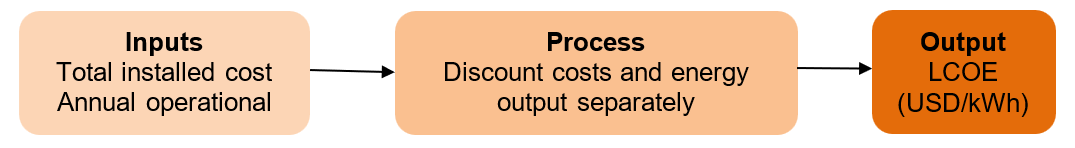
Figure 3 - LCOE Workflow
- Inputs
- Total installed cost, annual operational costs, energy output.
- Process:
- Discount costs and energy output separately.
- Divide total discounted costs by total discounted energy.
- Output:
- LCOE (USD/kWh).
Machine Learning Integration
- Regression models: Validate variable relationships (e.g., degradation vs. output).
- Neural networks: Optimize multi-variable calculations (e.g., NPV with fluctuating electricity prices).
- Random forests: Handle dataset variations (e.g., regional grid emission factors).
Equations are implemented programmatically with iterative checks to avoid computational limits, ensuring robustness
5. Usage results based on a 1MW solar installation in Durban generated in heliosphere software
Data used in application is listed below:
- Capacity = 1000kW
- Efficiency = 20%
- Grid emissions factor = 0.92kg of CO₂/ kW
- Operational lifetime = 20 years
- Cost per KW = R19 000
- System size = 1000kW
- Installation cost = R19 000 000
- Daily production hours = 6.8
- Degradation rate = 0.5%
- Operational costs = R120 000
- Electricity price = R4.2
- Electricity price increase rate = 12%
- Financing years = 10
- Interest rate = 4.5%
- Inflation rate = 3.5%
- Discount rate = 0%
With the values set as above the results displayed as follows:
- NPV = R658 994 492
- IRR = 56%
- Payback period = 2.18 years
- ROI = 3468.39%
- COE = R0.45 / kWh
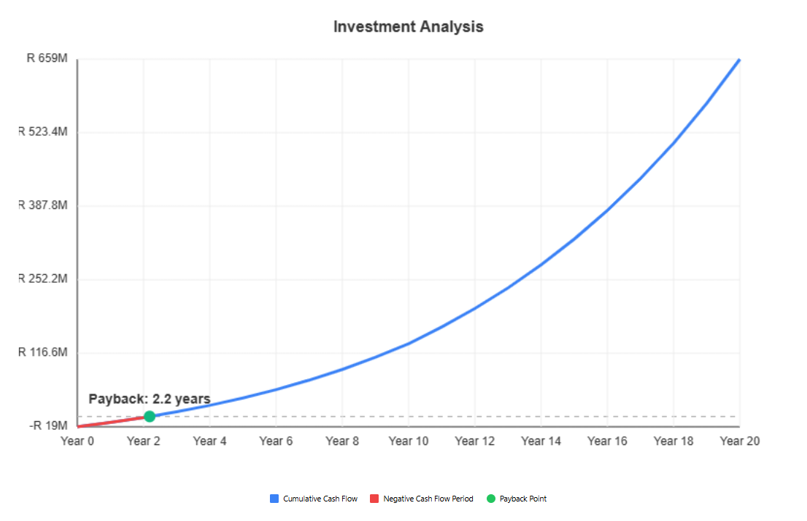
Figure 4 - Graph of Investment Analysis over life time of the system
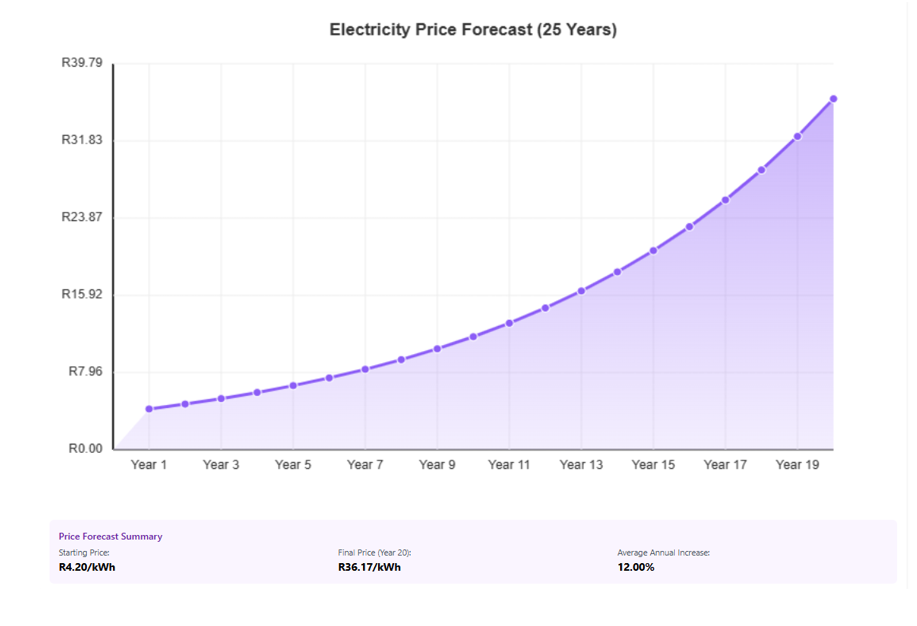
Figure 5 - Graph Forecasting price of Electricity over the next 25 years
- Electricity price final after 20years = R36.17 /kWh
- Energy generation prediction daily = 6.8MWh
- Energy generation prediction monthly = 204 MWh
- Energy generation prediction yearly = 2.48 GWh
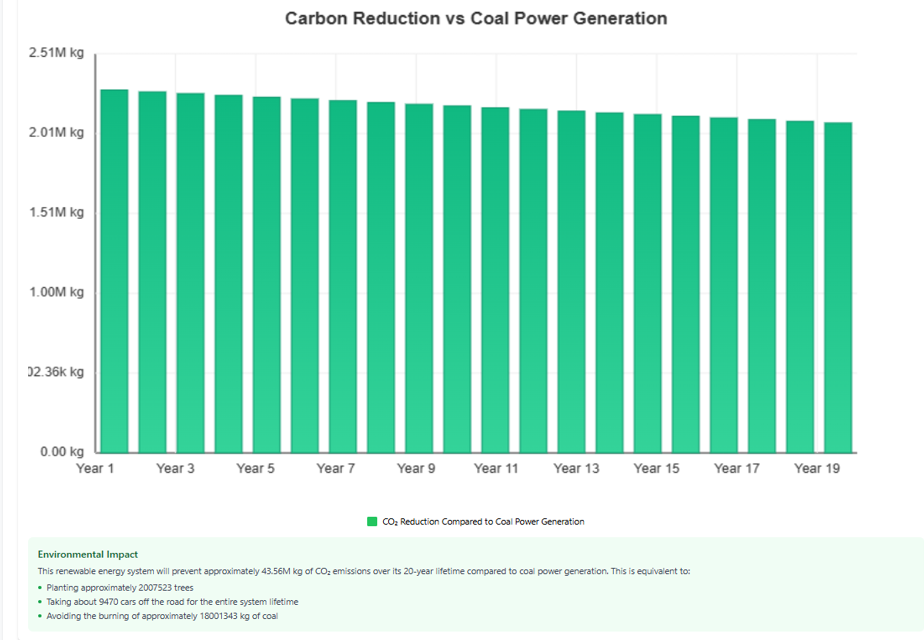
Figure 6 - Graph showing the Carbon emission reduction based on coal power generation over 20 years
- Total energy produced over 20-year life span = 47.35 GWh
- Carbon emission reduction lifetime = 43.56M Kg CO₂ emission reduction
6. Discussion
The application successfully generated reliable outputs based on the provided inputs, with results easily validated through independent calculations. The straightforward nature of the calculations, such as annual power generation and adjustments for current electricity price increases, allowed for simple confirmation of financial metrics.
The results indicate a notably high return on investment (ROI), with values exceeding 3000%, confirming strong financial viability and surpassing typical benchmarks. Additionally, the application demonstrated significant reductions in carbon dioxide emissions, highlighting substantial environmental benefits. These factors collectively position solar PV as a compelling and sustainable investment option for stakeholders.
7. Conclusion
This application provides clear and concise information to assess the value and potential savings of implementing a renewable energy system compared to relying solely on grid power. By presenting straightforward financial metrics and highlighting environmental benefits, the tool enables stakeholders to make informed decisions regarding solar adoption. Ultimately, it serves as a practical resource for those seeking both economic advantages and environmental responsibility.
References
- Renewable and Sustainable Energy Reviews, vol. 183, Art. no. 113478, Sep. 2023.
- Levelized Cost of Energy for PV and Grid Scale Energy Storage Systems arXiv:1609.06000, Sep. 2016. [Online].
- E. K. Kaldellis, K. A. Kapsali, and G. T. Papadopoulos, "Methods for financial assessment of renewable energy projects: A review," Processes, vol. 10, no. 2, Art. no. 184, Jan. 2022, doi: 10.3390/pr10020184.
- S. S. Suresh, D. A. Anagnostou, and A. K. Anagnostopoulos, "A through-life cost analysis model to support investment decision-making in concentrated solar power projects," Energies, vol. 13, no. 7, Art. no. 1553, Mar. 2020, doi: 10.3390/en13071553.
- R. Naude, "Most cost-effective energy source...? Solar takes the crown," Aug. 15, 2024.
- U.S. Department of Commerce, "Energy resource guide: South Africa - Renewable energy," [Online].
- PVConsult, "Carbon credits," [Online].
- Journal of Energy in Southern Africa, vol. 22, no. 4, pp. 8–12, Nov. 2011.
- R. Spalding-Fecher, "What is the carbon emission factor for the South African electricity grid," J. Energy South. Afr., vol. 22, no. 4, pp. 8–12, Nov. 2011, doi: 10.17159/2413-3051/2011/v22i4a3225.
- ResearchGate, "What is the carbon emission factor for the South African electricity grid," [Online].
- S. S. S. Barnard, A. M. Smit, S. L. Middelberg, and M. J. Botha, "Financial and environmental benefits of a 54 MW solar photovoltaic plant in the South African mining industry," J. Energy South. Afr., vol. 32, no. 3, pp. 1–15, 2021. [Online].
- SESSA. "Calculating ROI & payback." SESSA [online].
- TÜV SÜD. "Yield studies." TÜV SÜD [online].
- Government of South Africa. "South Africa’s 2021 grid emission factors report," Feb. 2, 2024 [online].
- Earth Journalism Network. "A journalist’s guide to covering net zero finance in South Africa." Earth Journalism Network [online].
- "A. S. R. Sekar, S. S. Suresh, and A. K. Anagnostopoulos, "A through-life cost analysis model to support investment decision-making in concentrated solar power projects," Energies, vol. 14, no. 6, Art. no. 1666, 2021, doi: 10.3390/en14061666.
- Nedbank. "Expected return on investment in solar energy." Nedbank [online].
- Climatiq. "Data region ZA." Climatiq [online].
- Mordor Intelligence, "South Africa solar energy market," Mordor Intelligence, [Online].
- Eskom, "Emissions," Eskom, [Online].
- South African Revenue Service, "Carbon tax," South African Revenue Service, [Online].
- Department of Forestry, Fisheries and the Environment, "South Africa 2021 grid emission factors report," [Online].
- "Construction innovation and sustainability: A bibliometric analysis," Emerald Insight, [Online]. Available: https://www.emerald.com/insight/content/doi/10.1108/ecam-10-2020-0778/full/html.
- "Sustainable construction project finance in South Africa," Emerald Insight, [Online].
- "The impact of green energy policies on business in Africa," EJEBs, [Online].
- Nina Mazyavkina, Sergey Sviridov, Sergei Ivanov, Evgeny Burnaev,. "Reinforcement Learning for Combinatorial Optimization: A Survey," arXiv preprint arXiv:2003.03600, Mar. 2020. [Online].
- “Optimizing Resource Allocation with Reinforcement Learning and Genetic Algorithms: An AI-Driven Approach”, IJAIML, vol. 1, no. 2, Jan. 2020, Accessed: May 14, 2025. [Online].