Meteo-Hydrological Analysis of Climate Change on the Volta River, Akosombo Hydroelectric Dam
Authors
Clement BOAKYE, Kwadwo Asante ADDO, Thelma Setor ADJIDJONU, Gilbert Kwarteng KUSI - Volta River Authority, Ghana

Summary
Climate change has been shown to significantly impact hydrology and water resources globally, and the Volta Lake and Basin, which plays a critical role in West-Africa’s energy sector and water resource management is of no exception. This study presents an advanced hydrological analysis on the water elevation at the Akosombo reservoir on the Volta Lake in Ghana, utilizing statistical modelling techniques to assess elevation trends, meteorological influences, and potential adaptation measures for reservoir management as a case study for the wider Volta Basin. This study incorporates meteorological variables to assess the Volta Basin's hydrological dynamics. Using a Multiple Linear Regression (MLR) model validated through a 10-fold cross-validation machine learning technique, the study analyzes a dataset of daily reservoir elevations and meteorological variables from 2020 to 2024 to evaluate the effects of climate variability on the Akosombo reservoir. Key findings reveal that a one-degree Celsius increase in mean temperature results in a 0.0233 ft decrease in the Volta River reservoir elevation, significantly affecting hydropower potential assuming constant humidity, dew point, and solar energy. The model demonstrates strong predictive accuracy with a Mean Absolute Error (MAE) of 0.04. The study confirms the non-stationarity of elevation data and proposes adaptation strategies, including integrating predictive models into dam operations and pursuing hybrid energy systems to reduce sole reliance on hydropower. Findings support climate-resilient hydropower management and provide a replicable framework for future reservoir studies in Sub-Saharan Africa.
Keywords
Hydrology, Climate Change, Akosombo, Meteorological Modeling, Reservoir Management, Machine Learning, 10-Fold, Cross-Validation1. Introduction
In an era of increasing climate variability, the global power industry is facing unprecedented challenges. Hydropower-dependent countries, in particular, are at heightened risk due to the substantial link established between water levels and climatic conditions [1].
In West Africa, numerous dams in Burkina Faso, Ivory Coast and Ghana rely heavily on consistent inflows from the Volta basin, and thus depend on accurate hydrological data to optimize dam operations and ensure consistent energy generation [2]. Reports of rising and volatile water levels on the Volta Lake, largely attributed to climate change, threaten to disrupt the availability of water resources essential for the reliability of hydropower and the advancement of Sustainable Development Goals (SGDs) for such Low- and Middle-Income Countries (LMIC) [3].
Therefore, the purpose of this study is to assess the impact of select meteorological variables on the hydrology of the Volta Lake, which is used to produce 1,020 MW of electricity from Ghana’s Akosombo Dam, and thus assess the impact of climate change on the hydrology of the wider Volta Basin. This study is intended to contribute to the improvement of water level prediction modelling, bolster clean energy security and planning for the Sub-Saharan region.
2. Background
2.1. Importance of Hydrological Studies in Dam Management
Climate change is significantly impacting hydrology and water resources globally, ushering in unprecedented challenges for water resource management [4]. Rising greenhouse gas concentrations are altering the atmospheric radiative balance, leading to temperature increases and changes in various climatic variables prompting researchers to emphasize the need for expansive study [5].
Research shows that the wider Volta River Basin of southern West Africa, which spans several countries, is highly susceptible to climate change effects, raising concerns about long-term hydro energy security in the region. A study by Neumann et al.6 has identified significant increases in temperature and evaporation rates, contributing to reduced water levels in rivers and reservoirs. Furthermore, the Volta River Basin is projected to experience increased peak inflows and outflows by the mid-to-late 21st century due to climate change, reinforcing the need for continuous monitoring and analysis on the Akosombo Dam for energy security [7].
2.2. Research Gaps and Objectives
While global studies, such as those conducted in Western Canada, reveal inverse relationships between streamflow and temperature [8], research on Sub-Saharan African water systems remains limited, necessitating region-specific insights. Furthermore, while several studies mention temperature and precipitation trends, few incorporate multiple meteorological variables in a unified model to explain hydrological behaviour. Again, studies focus on long-term, annual or decadal changes in streamflow, precipitation, or water availability, while this paper analyses daily elevation during a period of graduating increases in inflows (2020–2024), providing high-frequency insights, which capture seasonal and intra-annual elevation shifts, which are critical for dam operations and power planning. Furthermore, review of existing literature on climate and hydrology lacks the discussion on model validation techniques to ensure reliability application in the region, especially in localized dam settings [4] [9].
This study intends to build upon existing research under a rigorous Machine Learning linear regression modelling technique, the 10 Cross-Fold model, by incorporating seven (7) meteorological variables to evaluate the effects of climate variability on the reservoir elevation and improve model accuracy. In doing so, it aims to address this existing research gap and provide actionable insights for reservoir management under changing climate conditions.
2.3. Study Objectives
This study aims to:
- Identify key meteorological drivers of water elevation changes in the Akosombo Reservoir.
- Enhance predictive models for reservoir management.
- Recommend adaptation strategies for improving hydropower sustainability and resilience.
3. Methodology
3.1. Data
- Hydrological Records: Akosombo Dam Reservoir Elevation levels sourced from the Hydro Generation Department of the Volta River Authority (VRA), covering daily observations from January 2020 to March 2024
- Meteorological Data: Obtained from Weather Data Services Satellite Station #65460099999, covering the variables of atmospheric temperature, humidity, solar energy, sea level pressure, dew point, solar radiation and ultraviolet (UV) Index [10]
- Frequency: Daily observations from January 2020 to March 2024
Data from September 15, 2024 - October 30, 2023 was excluded from the study to adjust for a controlled spillage by the dam operators (VRA) during the period, culminating in 1,504 observations.
3.2. Study Area
The Akosombo Dam is located at 6.2997°N and 0.5667°E in southeastern Ghana. Constructed in 1965, it impounds the freshwater Lake Volta, one of the world’s largest man-made reservoirs, with a full supply level of approximately 276 ft (84.12 meters) and a capacity of approximately 150 billion cubic meters. The dam serves as a hydroelectric power station and a vital water resource for agriculture, navigation, and ecosystem sustainability.
3.3. Methodological Analysis
The analytical approach centres on using a Multiple Linear Regression (MLR) model, validated through a 10-fold cross-validation (CV) technique. Cross-validation techniques are widely regarded as essential tools in model calibration and evaluation. Studies show that in streamflow prediction, k-fold cross-validation—particularly when paired with data preprocessing techniques such as standardization—tends to outperform traditional time series approaches in terms of accuracy and reliability as reported by Darabi Cheghabaleki et al [11].
In addition, Rakovec et al. [12] demonstrated that 10-fold cross-validation successfully captures streamflow dynamics when applied to river basins across Europe. These findings reinforce the value of using robust validation techniques like 10-fold CV in hydrological studies, especially when applied to environments like that of Akosombo.
This study adopts a similar approach to ensure a statistically sound evaluation of the relationships between meteorological variables and changes in reservoir elevation, with the goal of producing a highly accurate and adaptable model for future use in operational decision-making.
4. Data Analysis
4.1. Water Elevation Trends
A statistical analysis of historical elevation data from 2020 to 2024 reveals clear cyclical patterns aligned with seasonal fluctuations. These seasonal patterns directly influence hydroelectric output at the Akosombo Dam. As shown in Figure 1, the annual average reservoir elevation increased steadily from 262.15 ft in 2020 to 269.67 ft in 2023, indicating an upward trend across the dataset.
Seasonal peaks (typically observed in October - November) were consistently higher than troughs recorded during non-peak periods (June–July), reflecting the reservoir’s sensitivity to seasonal climatic dynamics. Notably, peak elevations rose from 269.01 ft in 2020 to 276.08 ft in 2023, reinforcing the notion that climate variability is intensifying hydrological extremes. This non-stationarity—where the mean and variance do not remain constant over time—supports findings by Kundzewicz1 regarding the increasing volatility of freshwater basins under climate change.
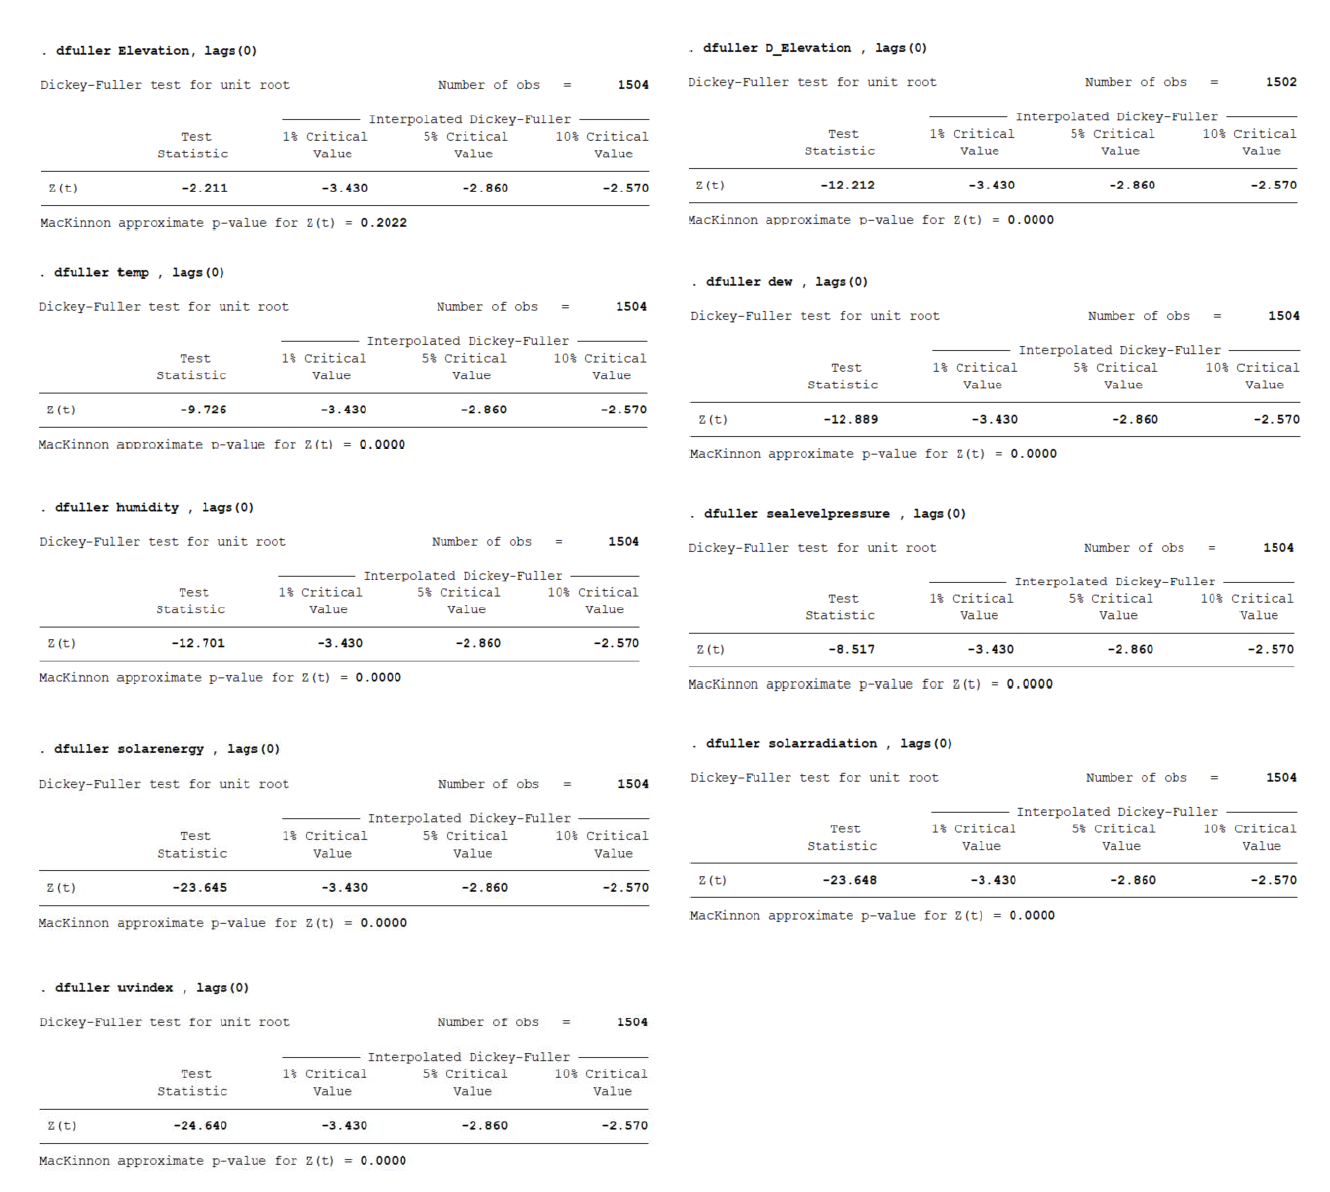
Figure 1 - Akosombo Dam Elevation (Jan 2020–Mar 2024) showing annual averages, peak season averages and linear trendline
4.2. Meteorological Analysis
An inspection of the meteorological parameters—namely temperature, dew point, humidity, sea level pressure, solar radiation, solar energy, and UV index—reveals considerable fluctuations over the study period. As illustrated in Figure 2, these variables exhibit cyclical patterns and abrupt shifts, underscoring high levels of variability.
For instance, temperature patterns demonstrate seasonal cycles with peaks typically occurring around the middle of each year, aligning with Ghana’s dry season, while dips align with the cooler, wetter periods. Similar seasonal fluctuations are observed in the solar energy, solar radiation and UV index graphs, indicating a strong link to solar radiation dynamics. Humidity, on the other hand, appears relatively more stable but still displays intermittent sharp declines, likely corresponding to dry spells. Sea level pressure varies significantly as well, with alternating periods of high and low pressure indicative of changing weather systems.
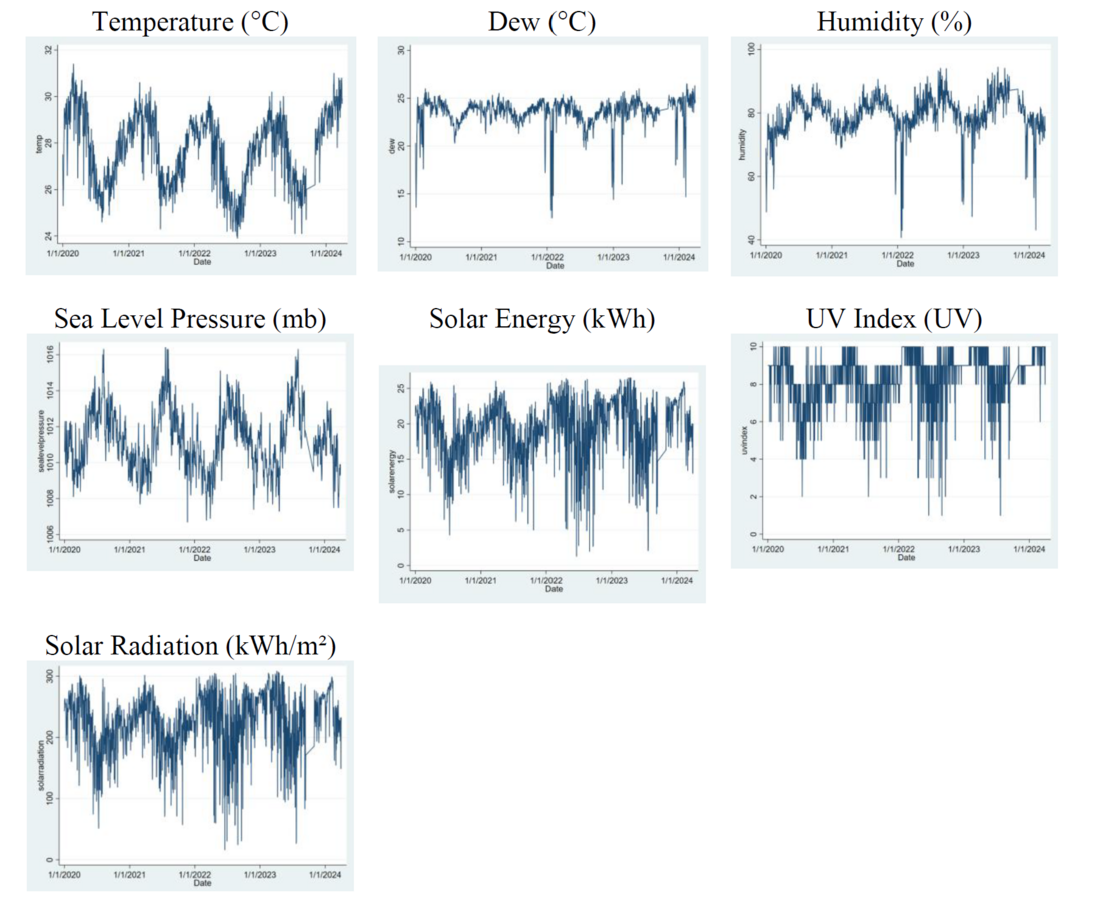
Figure 2 - Time series of meteorological variables (Jan 2020–Mar 2024)
4.3. Augmented Dickey Fuller Test
The apparent irregularities across the variables suggest a non-stationary nature, which has important implications for modelling suitability and whether the MLR model may be adequate for capturing the underlying dynamics of the reservoir and meteorological variables. Consequently, the Augmented Dickey Fuller Test (ADF) was employed to evaluate the presence of a unit root in the time series, with the following hypotheses:
- Null Hypothesis (H₀): The series is non-stationary.
- Alternative Hypothesis (H₁): The series is stationary.
The decision rule is to reject H₀ if the test statistic is less than the critical values at 1%, 5%, or 10% significance levels.
As reflected in Tables 1 and 2, for the elevation dataset, the ADF test returned a test statistic of -2.211 for the reservoir elevation level (Elevation), which is greater than all the critical values at 1% (-3.430), 5% (-2.860), and 10% (-2.570). The p-value of 0.2022 also exceeds the standard threshold of 0.05, further reinforcing the conclusion that the elevation data is non-stationary in its original form.
Despite the high volatility observed visually in the meteorological variables, the ADF test results for these variables (temperature, dew point, humidity, sea level pressure, solar energy, solar radiation and UV index) revealed stationarity, implying suitability for further analysis models without transformation.
| 1% | 5% | 10% | |
|---|---|---|---|
| Critical Value | -3.430 | -2.860 | -2.570 |
| Variable | Test Statistics | P-Value | Interpretation |
|---|---|---|---|
| Elevation | -2.211 | 0.2022 | Non-stationary |
| Temperature | -9.726 | 0.0000 | Stationary |
| Dew Point | -12.889 | 0.0000 | Stationary |
| Humidity | -12.701 | 0.0000 | Stationary |
| Sea Level Pressure | -8.517 | 0.0000 | Stationary |
| Solar Energy | -23.645 | 0.0000 | Stationary |
| Solar Radiation | -23.648 | 0.0000 | Stationary |
| UV Index | -24.640 | 0.0000 | Stationary |
Due to the non-stationary nature of the elevation data, first-order differencing was applied on the data (Elevation) and denoted as D_Elevation, to assess whether transformation would eliminate the non-stationarity. Differencing involves transforming the original series by subtracting each data point from its preceding value, effectively analyzing the change in elevation rather than the absolute values. Mathematically, this is represented as:
(1)
Upon differencing, the ADF test yielded a test statistic of -12.212 as displayed in Table 3, which is significantly lower than all critical values at the 1%, 5%, and 10% significance levels confirming stationarity, and therefore making it appropriate for time series modelling and regression analysis alongside the selected meteorological parameters. Further details available in Appendix A.
| Variable | Test Statistics | P-Value |
|---|---|---|
| D_Elevation | -12.212 | 0.0000 |

4.4. Correlation Matrix
To preserve the integrity of the analysis and avoid multicollinearity, a correlation analysis was conducted between D_Elevation and the meteorological variables as indicated in Figure 3. Among the meteorological variables, Temperature (temp) exhibited the strongest correlation with D_Elevation, with a correlation coefficient of -0.5534, or -55.34%. This negative relationship implies that as temperature increases, the daily change in elevation tends to decrease, and vice versa. However, the negative sign underscores the need for careful interpretation and validation within a multivariate framework, especially when integrating other variables that may moderate this effect.
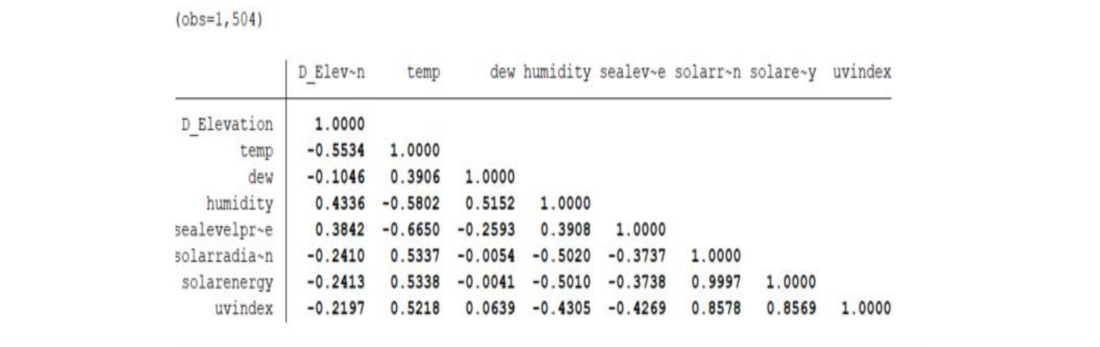
Figure 3 - Pearson’s Correlation Matrix (D_Elevation vs. meteorological variables)
4.5. Anova Test
To refine the model and focus on variables with significant impact, an Analysis of Variance (ANOVA) test was conducted to help distinguish which meteorological variables had a statistically significant effect on the change in elevation (D_Elevation).
The results shown in Figure 4 reveals that Sea Level Pressure, Solar Radiation and UV Index returned p-values of 0.107, 0.807 and 0.535 respectively, which exceed the alpha threshold of 0.05, indicating that their influence on the change in elevation was not statistically significant. As a result, these three variables were excluded from further modelling under the Multiple Linear Regression framework, ensuring that only the relevant predictors (temperature, humidity, dew point and solar energy) were used for optimal model performance.
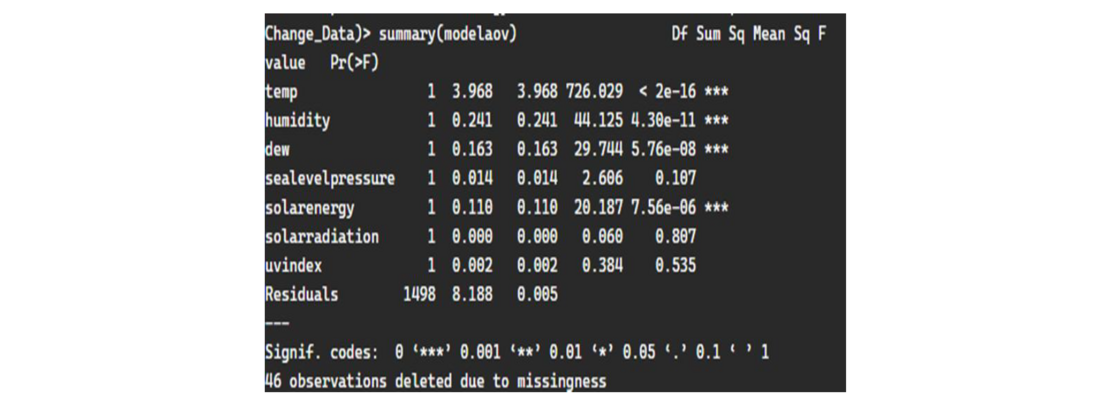
Figure 4 - Anova Table for all Variables
4.6. 10 Fold Cross-Validation Model
To boost model reliability, the Multiple Linear Regression approach in this study was paired with a 10-fold Cross-Validation technique—a machine learning method used to enhance predictive accuracy.
In this method, the dataset is split into 10 subsets (folds). For each iteration, the model is trained on 9 folds and tested on the remaining 1 fold, cycling through all combinations. This process ensures that the model is exposed to multiple variations of the data, helping to reduce overfitting and improve generalizability. Model performance is then evaluated using the Mean Absolute Error (MAE)—a standard metric in machine learning. Lower MAE values (closer to zero) indicate higher accuracy and better predictive strength.
5. Results and Discussion
5.1. Results of 10-Fold Cross-Validation Model on the Influence of Meteorological Factors
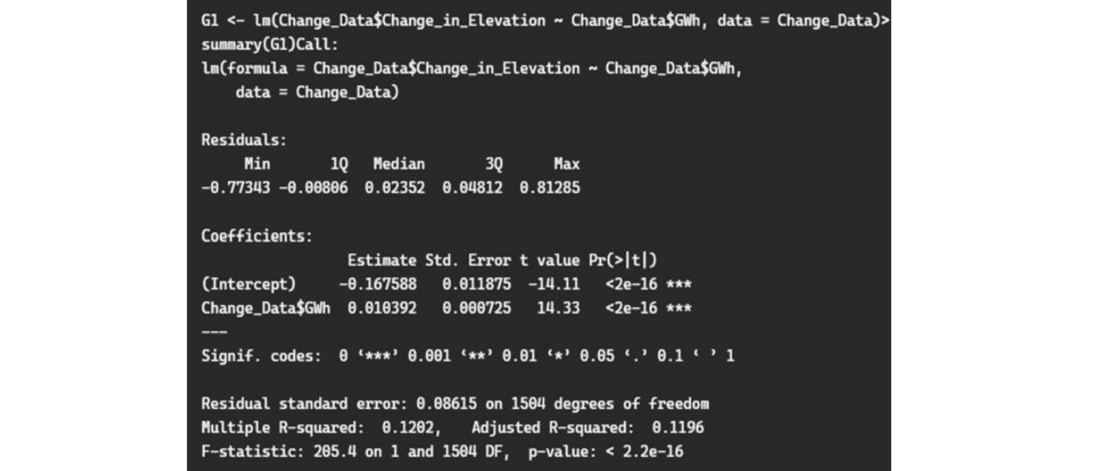
The findings from the model revealed that a one-degree Celsius increase in mean temperature resulted in a 0.0233 ft decrease in the Volta River reservoir elevation, thereby significantly affecting hydropower potential, assuming constant humidity, dew point, and solar energy. These results align with previous studies by Milly et al. [13], which demonstrate how temperature affects streamflow by altering evapotranspiration. The combination of the statistically significant meteorological variables (temperature, humidity, dew and solar energy) accounted for 40.41% of the variation in the Akosombo reservoir elevation as displayed in Figure 5. This was a significant improvement over a comparative univariate model which focused solely on using hydropower generation from the reservoir’s power generating station to explain the change in reservoir elevation level (R-squared of 12.02%) as indicated in Appendix B.

Figure 5 - Results from 10-Fold Multiple Linear Regression Model — Impact of temperature, humidity, dew point, and solar energy on daily elevation changes
5.2. Model Performance and Predictive Accuracy
The model's predictive accuracy, with a Mean Absolute Error (MAE) of 0.04 in Figure 6, is classified as "Very Good" according to the standards set by the National Oceanic and Atmospheric Administration (NOAA)[14] in Appendix C. This suggests that the model offers a robust framework for predicting hydrological changes in response to temperature fluctuations, providing valuable insights for future resource management and policy development in the region.
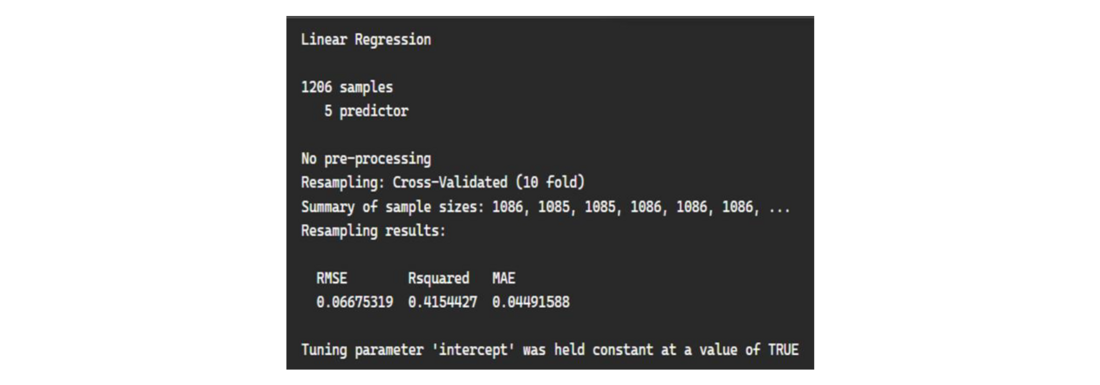
Figure 6 - Model Accuracy — 10-Fold Mean Absolute Error (MAE) Results
6. Conclusion
This study presents a machine-learning-enhanced statistical model that significantly improves the understanding of hydrological dynamics at the Akosombo Dam, using meteorological variables such as temperature, humidity, dew point, and solar energy. The model confirms that climatic variability—particularly rising temperatures—has a measurable impact on reservoir elevation in the Volta basin, with a one-degree Celsius increase resulting in a 0.0233 ft reduction in water levels. With an MAE of 0.04 and an explanatory power of 40.41%, the model demonstrates high predictive accuracy and practical relevance. Given this finding, our estimates on the impact of a one-degree Celsius change in the temperature, could impact the generation of Akosombo Dam by as much as 7.9 gigawatt hours per day or 292 megawatts of generating capacity.
These findings are consistent with broader regional analyses, such as those from an ongoing Climate Change Risk Assessment (CCRA) study for the Akosombo and Kpong dams. That study shows a historical warming trend of 1.2°C since 1950 in the basin and projects further increases of up to 2.5°C–4.5°C by 2100 under high-emissions scenarios—changes that are expected to significantly influence inflows, evaporation rates, and electricity demand patterns [16].
6.1. Adaptation Measures for Reservoir Management
The study reinforces the need for integrated meteo-hydrological models to inform policy decisions and adaptive operational strategies, ensuring the resilience of the West African hydropower sector in the face of climate change. The World Bank recommends the incorporation of hydrological based climate risk in infrastructure planning, including real-time forecasting models in developing economies [15].
While small reductions may not significantly affect operations, in alignment with the CCRA Phase 2 report, the findings advocate for updating reservoir rule curves based on future climate conditions and conducting climate stress tests to assess system vulnerabilities under future scenarios. By integrating this model into hydropower planning systems in the Volta Basin, dam operators can anticipate and prepare for seasonal or climatic stress periods of water level declines, enabling more strategic spillage and energy scheduling decisions [16].
Furthermore, the integration of this model can also aid in aligning hydroelectric generation with meteorological forecasts to improve efficiency.[17].
6.2. Mitigation Strategies and Broader Implications
Although the model primarily supports adaptation, its insights also offer important contributions to climate mitigation planning. It highlights the urgency of reducing greenhouse gas emissions, as sustained temperature increases could jeopardize the reliability and redundancy of green energy infrastructure within the Volta Basin. Research by IRENA supports the development of mitigation strategies through investments in hybrid systems that integrate hydropower with solar or wind energy, thereby reducing overreliance on climate-sensitive reservoirs [18]. Additionally, the model provides robust, data-driven evidence of vulnerability and adaptation needs, which can be leveraged to strengthen proposals for international climate finance—particularly for resilience-focused investments in dam infrastructure across the basin.
Also, the findings support the growing consensus among energy and climate experts that integrating renewable sources like solar and wind with hydropower offers a viable path forward. Diversifying energy sources not only reduces the stress on water-dependent systems during dry periods but also helps maintain energy security in a changing climate. One key approach is the integration of solar hybridization with existing hydro facilities. This enables the reservoir to serve as a “Battery” by storing water during peak solar generation periods and releasing it when solar output declines, thereby improving flexibility and reliability. Additionally, the findings align wither broader initiatives within Ghana and the WAPP interconnected grid to reduce over-dependence on water reservoirs.
As climate change continues to challenge water availability in the Volta Basin, this study not only contributes to the hydrological and energy modelling literature, but also provides a practical, replicable framework for real-world climate adaptation planning. Future work should explore the integration of this model into real-time dashboards and test its applicability across other reservoirs within the Volta Basin and Sub Saharan-Africa.
References
- Kundzewicz ZW. Climate change impacts on the hydrological cycle. Ecohydrology & Hydrobiology. 2008;8(2–4):195–203. https://doi.org/10.2478/v10104-009-0015-y
- New directive announced on the construction of large dams in West Africa. [Internet]. IUCN; 2017 Jul 27 [cited 2024 Apr 25]. Available online.
- Dembélé M, Vrac M, Ceperley N, Zwart S, Larsen J, Dadson S, et al. Contrasting changes in hydrological processes of the Volta River basin under global warming. Hydrol Earth Syst Sci. 2022;26(5):1481–506. https://doi.org/10.5194/hess-26-1481-2022
- Wang X, Liu L. The impacts of climate change on the hydrological cycle and water resource management. Water. 2023;15(13):2342. https://doi.org/10.3390/w15132342
- Gleick, P. H. (1989). Climate change, hydrology, and water resources. Reviews of Geophysics, 27(3), 329–344. https://doi.org/10.1029/rg027i003p00329
- Neumann R, Jung G, Laux P, Kunstmann H. Climate trends of temperature, precipitation and river discharge in the Volta Basin of West Africa. Int J River Basin Manag. 2007;5(1):17–30. https://doi.org/10.1080/15715124.2007.9635302
- Jin L, Whitehead PG, Addo KA, Amisigo B, Macadam I, Janes T, et al. Modeling future flows of the Volta River system: Impacts of climate change and socio-economic changes. Sci Total Environ. 2018;637–638:1069–80. https://doi.org/10.1016/j.scitotenv.2018.04.350
- Du X, Goss G, Faramarzi M. Impacts of hydrological processes on stream temperature in a cold region watershed based on the SWAT Equilibrium Temperature model. Water. 2020;12(4):1112. https://doi.org/10.3390/w12041112
- Jones JA. Hydrologic responses to climate change: considering geographic context and alternative hypotheses. Hydrol Process. 2011;25(12):1996–2000. https://doi.org/10.1002/hyp.8004
- Visual Crossing Corporation. Weather history [Internet]. Leesburg (VA): Visual Crossing; 2025 Feb 14 [cited 2025 Apr 25]. Available online.
- Cheghabaleki SD, Fatemi SE, Mavadat MH. Enhancing spatial streamflow prediction through machine learning algorithms and advanced strategies. Appl Water Sci. 2024;14(6). https://doi.org/10.1007/s13201-024-02154-x
- Rakovec O, Kumar R, Mai J, Cuntz M, Thober S, Zink M, et al. Multiscale and multivariate evaluation of water fluxes and states over European river basins. J Hydrometeorology. 2015;17(1):287–307. https://doi.org/10.1175/jhm-d-15-0054.1
- Milly PCD, Kam J, Dunne KA. On the sensitivity of annual streamflow to air temperature. Water Resour Res. 2018;54(4):2624–41. https://doi.org/10.1002/2017wr021970
- NOAA’s National Weather Service. Overview by Weather Forecast Office (WFO). [Internet]. [cited 2024 Apr 25]. Available online.
- Hydropower Sector Climate Resilience Guide. [Internet]. International Hydropower Association; 2019 [cited 2024 Apr 25]. Available online.
- COBA Portugal, Artelia. Climate Change Risk Assessment (CCRA) for Akosombo and Kpong Hydro Generating Stations in Ghana. Phase 2. December 2024 (Ongoing)
- Zulfialda DH, Nugroho CA, Malasan HL. Prediction of hydropower plant electricity production dependence on weather conditions using the SARIMAX model. J La Multiapp. 2025;6(1):1-11. doi:10.37899/journallamultiapp.v6i1.1841
- International Renewable Energy Agency (IRENA). Climate change and renewable energy: national policies and the role of communities, cities and regions. Abu Dhabi (AE): IRENA; 2019. Report No.: 978-92-9260-136-2. Available online.
Appendix A - ADF Test Results
APPENDIX B - Linear Regression Model Elevation & Hydro Generation
APPENDIX C - NOAA MAE Range
| MAE Range | Quality |
|---|---|
| ≥ 0% & < 5% | Very Good |
| ≥ 5% & < 10% | Good |
| ≥ 10% & < 20% | Fair |
| ≥ 20% & < 30% | Poor |
| ≥ 30% | Very Poor |