Frequency Performance and Regional Inertia Analysis in High IBR Penetration Systems – An SRP Case Study on WECC System
Authors
Chengwen ZHANG, Parag MITRA, Deepak RAMASUBRAMANIAN, Vikas SINGHVI - EPRI, USA
Matthew RHODES, Bo GONG, Scott W. ANDERSON - SRP, USA

Summary
The integration of inverter-based resources (IBRs) has been speculated to cause deterioration in power system inertia levels and frequency performance. However, with proper control and parameterization, they can be valuable sources of frequency support services. In fact, it will become a must to have these resources to be configured to participate in frequency support as they become the predominant type of resources in high IBR penetration systems. This paper presents key findings out of a frequency study on a Western Interconnection planning model, covering the impact of high IBR penetration levels, how these IBRs can be utilized in turn for frequency services, comparison of different technologies in frequency support provision, and an inertia regionalization study for identifying regional inertia and local frequency dynamic issues in large-scale power systems.
Keywords
inverter-based resources, frequency dynamics, regional inertia1. Introduction
Frequency dynamics are expected to change with the increasing integration of the inverter-based resources (IBRs). Unlike traditional synchronous generators whose inertial energy stored in their rotating masses can be instantly extracted during frequency transients, IBRs either do not possess inertial energy or have limited capability of delivering it through inverter interfaces. Since inertia is not distributed evenly across the system and the concentration of IBR in certain areas may aggravate the inhomogeneity, regional inertia issues and strong regional frequency dynamics are expected to arise before system-inertia becomes a problem [1]-[3]. Also, due to a lack of incentives and performance verification requirements, IBRs are not widely participating in frequency response today in the U.S., despite the fact that many of them are already equipped with the capability to do so [4]-[5]. In higher penetration systems, such as those in Australia, Europe, as well as ERCOT in U.S., there have been investigations and implementation of IBR frequency service provisions, demonstrating their role and effectiveness in power system frequency control amid evolving generation fleets [6]-[9]. The impact of the speed and amount of IBR fast frequency response on the minimum inertia required to maintain satisfactory frequency performance is also discussed. However, these studies are system-specific, and conclusions may change across different systems and assumptions. There remains a lack of understanding regarding how IBRs could contribute to frequency control and where the regional-level inertia aspect stands for the Western Interconnection in the U.S. Hence, with the support from Salt River Project Agricultural Improvement and Power District (SRP), this paper aims to explore the impact of IBR integrations, the potential of these resources for frequency support, and the regionalized analysis of inertia in the Western Interconnection to facilitate informed decision-making for operators, planners, and policy makers. Salt River Project (SRP) is a community-based, not-for-profit utility that provides electricity and water to over 2 million people in central Arizona. Service territory of SRP sits in the southern part of the Western Interconnection, which is one of the major power grids in North America spanning 14 U.S. states, two Canadian provinces (British Columbia and Alberta), and a portion of northern Baja California in Mexico.
First, this study investigates the impact of the increasing IBR on the Western Interconnection’s frequency performance, including the rate of change of frequency (RoCoF) and the frequency nadir (the minimum system frequency observed after a disturbance). In such a process, a marginal case is identified where the frequency nadir on the transmission system near the disturbance location (SRP area) is close to the under-frequency load shedding (UFLS) threshold. This case is further used for subsequent frequency support studies with IBRs.
Then, in the marginal case, studies are conducted to use SRP battery energy storage systems (BESSs) for fast frequency support. Although IBR resources have been considered the main cause of the declining inertia and frequency response in the past decades, it will be soon reaching a point where these IBRs must be treated as valuable resources instead as they become the predominant type of resources in high penetration systems. The fast response capability of these resources makes them valuable assets for this purpose when controlled and parameterized properly. This study aims to explore the role these IBRs can play in high penetration systems, with a conservative assumption that only the BESSs in the SRP footprint are configured to provide frequency response as a pre-emptive study due to the lack of information about the IBRs in the rest of the interconnection. The reason of choosing the BESS systems for this study is because they are existing BESSs in SRP’s system or interconnection queue that can be readily available for frequency response participation, and as compared to other resources like PV and wind, using BESS for frequency control leads to less lost opportunity cost as long as their state-of-charge is managed properly. Along with demonstrating the incorporation of IBRs for frequency support, a comparison between different technologies, including IBRs and synchronous condensers, as well as a discussion about grid-forming (GFM) and grid-following (GFL) controls in providing frequency support, are provided for assisting effective resources selection and decision making.
In addition to the interconnection-wide frequency dynamics, the regional aspect of frequency is also investigated, which is largely affected by regional inertia levels across a system. The analysis is facilitated with an inertia regionalization algorithm developed to provide insight into key dynamics among the rotating masses across a large-scale power interconnection and to identify areas with high risks of regional inertia issues [3]. Such analysis informs system operators and planners for the efficient conduction of further detailed studies when necessary.
2. Impact of IBR Integration on Frequency Performance
To study the impact of the increasing integration of IBRs on the frequency performance of the Western Interconnection, high penetration scenarios are created by retiring large power plants with high kinetic energy (MVA∙s values) that are representative of coal-fired plants, and subsequently replacing them with IBRs. The dynamic simulations in this study are conducted on a positive sequence simulation platform, and WECC-approved generic models are used for dynamic simulation of the IBRs’ inverter, electrical control, and plant control.
The base case has a total load of 132,218 MW with 23,103 MW from renewables, leading to an IBR penetration level of 17.5%. The total amount of synchronous inertia of the base case is 244,882 . This case is representative of a snapshot of the WECC system when the wind and solar generation supports a high percentage of the total system load. As such, this case is expected to have lower levels of synchronous generation and therefore well suited for frequency response assessment. Among the higher-penetration cases created, a case with 69.6% IBR penetration level is identified as the marginal case in which the frequency nadir observed near the disturbance location (SRP area) is close to the UFLS threshold. The marginal case has the same total load level but with a total renewable generation of 91,961 MW. The total inertia is reduced to 63,204 due to the retirement of synchronous machines. The disturbance used is the simultaneous tripping of two generation units totaling 2750 MW of generation, which is usually considered the largest credible contingency in the Western Interconnection. The newly added IBRs in this scenario are assumed to not be providing frequency support yet, but they will be enabled for frequency support later in Section 3.
The frequency dynamics in the base case are shown in Figure 1. Following the generation trip of 2750 MW in the southern tip of the Western Interconnection, the RoCoF calculated from the dynamic simulation result is 607 mHz/s near the disturbance (the yellow curve) with a time window of 0.1 seconds. The frequency nadir near the disturbance location is 59.73 Hz, with a 0.23 Hz margin from the UFLS threshold of 59.50 Hz.
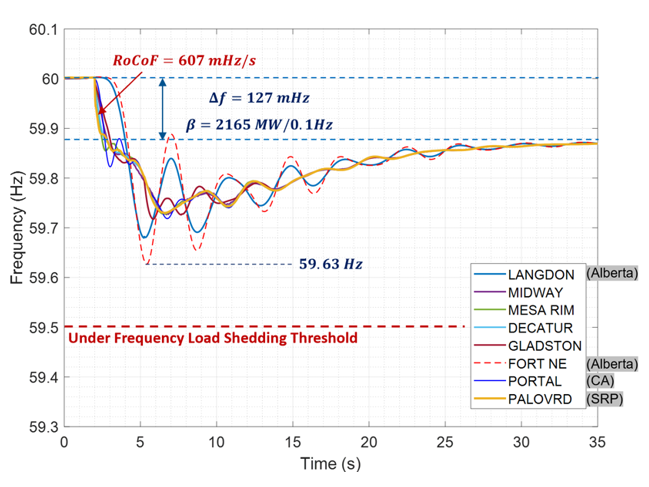
Figure 1 - Frequency dynamics of the base case
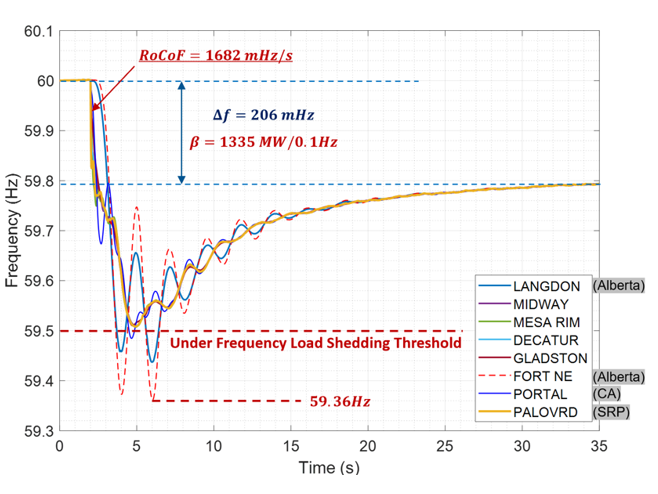
Figure 2 - Frequency dynamics of the high penetration case
In the high penetration scenario with 69.6% inverter-based generation, as shown in Figure 2, local RoCoF calculated from the simulation result increased to 1682 mHz/s near the disturbance location. The frequency nadir (59.508 Hz) near the frequency disturbance location has only 0.008 Hz of margin from the UFLS threshold of 59.500 Hz. The frequency response β also reduced significantly from 2165 MW/0.1Hz to only 1335 MW/0.1 Hz with the penetration hike. It is noted that because of frequency response deadbands in governors and controllers, the actual β exhibited by the system can be affected by factors like pre-disturbance operating frequency and the size of the disturbances [10]. The two events shown here made sure the systems had the same pre-disturbance frequency and disturbance size for a fair comparison. Also noted is that in both the base case and the high penetration case, the lowest frequency nadir in the system takes place in Alberta, Canada, which is thousands of miles away from the disturbance location. This is because the region is weakly connected to the rest of the system and has a small fleet of synchronous generators in the region, which make the area prone to regional frequency dynamics. This phenomenon will be discussed with more details in Section 4 which focuses on regional inertia analysis.
It is observed in these two cases that a significant increase in IBR penetration, with the assumption that these IBRs do not actively participate in frequency services, leads to deterioration in the frequency performance of the system, including the RoCoF and frequency nadir levels. In the next section, discussions will be given on enabling the IBRs to support system frequency during transients, as well as comparing different resources and controls in providing frequency services.
3. Leveraging IBRs for Frequency Support
The high penetration case introduced in Section 2 has an IBR penetration level of 69.6% and the frequency nadir is close to the UFLS threshold near the disturbance location. This is assuming IBRs are not actively providing frequency support during a disturbance. As the IBRs become the dominant type of resources in this situation, they shall take the responsibility to participate in frequency support. In fact, their fast responding capability positions them well for providing such services when controlled properly.
3.1. Frequency Response and Parameterization of SRP IBRs
The following studies investigate potential benefits that IBRs can bring to the system frequency dynamics. Eleven BESSs within SRP identified with headroom available for frequency response are utilized to participate in such service. This is a conservative scenario assuming all IBRs in the rest of Western Interconnection are not providing frequency support due to the lack of information about how IBRs outside of SRP would be configured for frequency service. Hence, the results in this paper do not aim to produce the most realistic future scenario where a larger pool of IBRs across the whole interconnection could potentially participate in frequency services. Rather, it represents a conservative scenario with the goal of exploring the potential benefits these resources could bring and how they should be configured to maximize such benefits, if any. The total headroom available for frequency response on these eleven SRP BESSs is 1420 MW.
The frequency dynamics resulting from several different configurations of the IBR frequency response are presented in Figure 3. Table 1 provides an overview of the five scenarios being compared. Scenario 1 is the 69.6% penetration scenario shown in the previous section, without any IBR frequency response, Scenarios 2 and 3 have IBR frequency response but are with different droop gains of 20 and 100, respectively. Scenarios 4 and 5 are based on scenarios 2 and 3, but the IBRs are further tuned to provide faster response by increasing the PI proportional gain in the plant controller. The droop gain and the PI control gains are shown in the plant controller diagram in Figure 4.
Scenario # | Description | ||
SRP BESS Frequency Response | Droop Gain | PI Controller Gains | |
1 | Disabled | N/A | N/A |
2 | Enabled | 20 | Default (Kpg = 0.1, Kig = 0.05) |
3 | Enabled | 100 | Default (Kpg = 0.1, Kig = 0.05) |
4 | Enabled | 20 | After Parameterization (location specific) |
5 | Enabled | 100 | After Parameterization (location specific) |
With the default droop gain (Kdroop = 20) and PI controller parameters (Kpg = 0.1, Kig = 0.05), frequency response from the BESS improved the frequency nadir margin above the UFLS threshold, from 8 mHz to 21 mHz. After the parameterization with larger droop gains and faster PI controller parameters tuned for each of the locations toward higher Kpg values without risking stability, the frequency nadir margin was improved significantly from 8 mHz to 100 mHz. While only the SRP BESSs are used to provide frequency response, the benefit in frequency nadir is seen across the whole Western Interconnection.
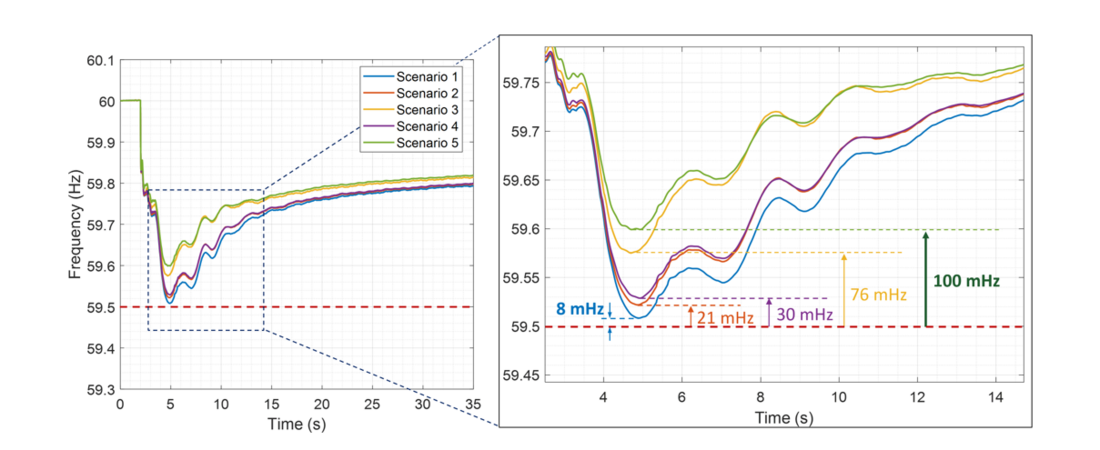
Figure 3 - Frequency dynamics with different frequency response configurations on SRP BESSs
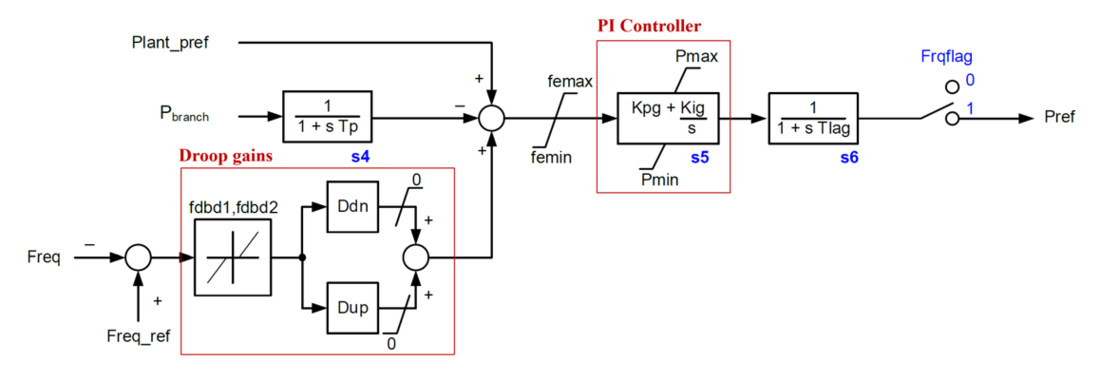
Figure 4 - Droop gain and PI control in IBR plant controller REPC_A
The benefit of the parameterization can be observed in Figure 5, which depicts the total active power output of the SRP BESSs corresponding to the scenarios presented in Figure 3. In addition to the stronger response due to higher droop levels, the higher proportional gain in the PI controller was able to improve the speed of response, especially in the first few seconds after the disturbance, as demonstrated by the difference between the solid lines (after parameterization) and dashed lines (before parameterization).
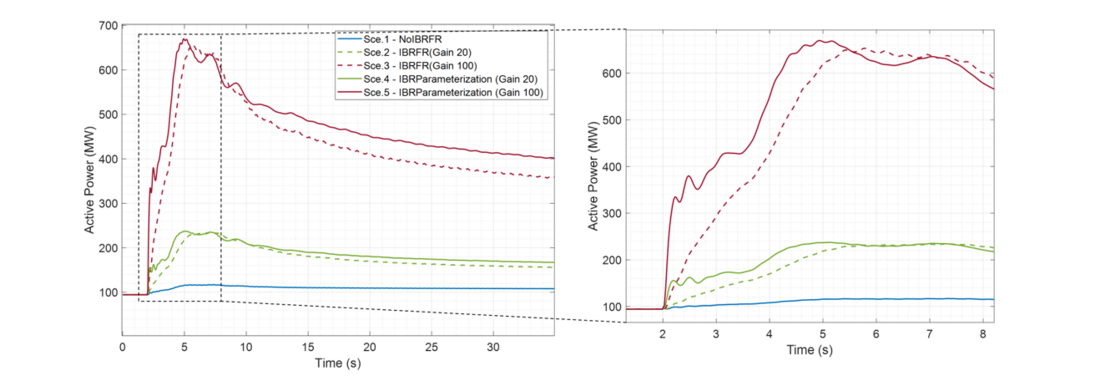
Figure 5 - Total Active Power from SRP Energy Storage IBRs
Despite the significant improvement in the speed and strength of IBR frequency response, it is notable that the total amount of IBRs in SRP providing such response is minimal compared to the size of the Western Interconnection, yet the benefit it yielded (frequency nadir improvement) is seen across the whole system. This is because the speed these IBRs are capable of when providing the service. For Scenario 5 shown above, Figure 6 further depicts a comparison between the total SRP BESS frequency response power injection and the total injection from generators in the rest of the interconnection. After the instantaneous yet unsustainable energy injection immediately following the disturbance due to generator inertia (blue curve), the active power support in the next few seconds provided by the SRP BESSs (orange curve) peaked at around 42% of the total frequency response among all resource in the Western Interconnection. However, the total headroom on these SRP BESSs comprises only 2% of the total headroom across system. Although the IBRs are not as fast as the physical rotating mass, they are fast enough to provide critical support during the first few seconds after the frequency discursion. In addition, the IBR fast frequency response can sustain much longer than the inertial response so that it could effectively raise the frequency nadir. Such fast yet sustained response would be critical for low-inertia systems as it buys time for other slower resources to ramp up, avoiding drastic frequency declines and extreme frequency nadirs that could lead to activation of UFLS, frequency instabilities, and system separations.
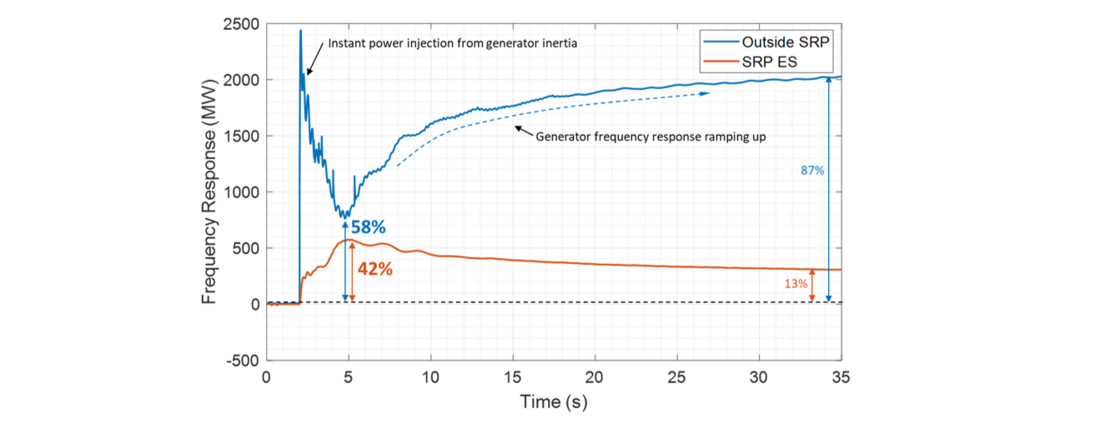
Figure 6 - Active power from SRP BESSs and the remaining generators in the Western Interconnection
It is cautioned that this is a conservative scenario where it is assumed only the BESSs within SRP are providing frequency response, which hence take up an unproportionally high share of frequency response, due to the lack of information about the plan of the deployment and configurations of IBRs in the rest of the Western Interconnection. In realistic scenarios, IBRs outside SRP would also participate in frequency support. The share taken by SRP IBRs in that case will reduce to a more reasonable level and the frequency performance can be expected to further improve with a larger pool of IBRs across the interconnection.
3.2. Enhancing Headroom Utilization
Having enough headroom is always paramount for ensuring sufficient frequency support from any resource participating in frequency response, including IBRs. Situations could arise where there is headroom available on BESSs sited within a hybrid plant, but it cannot be used to deliver frequency response due to limits on the total plant power at the point of interconnection when the wind or solar within the plant is generating at a high level. With the limits on total plant power being enforced, the usable headroom on SRP BESSs reduced from 1420 MW to 610 MW. This is because 810 MW of BESS headroom became undeliverable as some BESSs are located in hybrid plants whose PVs are generating at high levels. The remaining 610 MW accessible headroom is concentrated in 4 BESSs. This will significantly reduce the amount of frequency response provided by the resources.
It is important to note that in Figure 5, the actual highest headroom usage is only 580 MW (active power rising from 90 MW to 670 MW in response to the frequency discursion), as indicated by the red solid curve. This means if controlled appropriately with proper headroom reservation strategy, the total headroom after the plant-limit reduction (610 MW) might be able to cover the power needed for the frequency response. To explore strategies to maximize the headroom utilization when it is limited, hypothetical scenarios are proposed below in which it is assumed possible to properly redispatch resources to allow distributing headroom or change the control of the BESSs’ frequency response. While these scenarios are not intended to represent realistic or economic operating conditions, the goal is to demonstrate the impact of headroom distribution and different IBR frequency response controls on the effectiveness of utilizing a certain amount of total headroom.
Two approaches are explored to this end. First, when the operator has the flexibility to re-allocate the headroom across a number of BESS locations through proper dispatch, it is always preferred to distribute the total headroom to a number of resource locations. Second, as an alternative for when the headroom has to be concentrated in certain locations, step fast frequency response may be used.
The first approach assumes that operators have the flexibility to distribute the limited total headroom across multiple plants, each of the plant will have to only reserve a small portion of their capacity for response and can be configured at lower droop gain levels on each of the resources. In the SRP case, based on considerations of plant configuration and location, it was assumed that the operators were able to redispatch the resources so that the 610 MW total headroom could be distributed across 10 SRP BESSs with each plant having 61 MW of headroom for frequency response.
However, it is not always feasible to be able to distribute the 610 MW of headroom across a number of resources – there could be situations where it has to be concentrated within certain locations. In this case, to deliver the same effectiveness of IBR frequency response, the droop gains would have to be configured to unrealistically high levels. For this situation, an alternative is step fast frequency control that simply ramps up IBR power to its maximum quickly once a frequency discursion greater than the deadband is detected.
Both approaches have been tested on the SRP BESSs in the Western Interconnection model, as shown in Figure 7. Descriptions of the five scenarios plotted in Figure 7 are listed in Table 2.
Scenario # | Description | |
SRP BESS Frequency Response | Headroom | |
1 | Disabled | N/A |
2 | Enabled | Original headroom of 1420 MW across 11 SRP BESSs, hybrid plant power limits not enforced |
3 | Enabled | Remaining 610 MW headroom on 4 SRP BESSs due to enforcement of hybrid plant power limits |
4 | Enabled | Hypothetical scenario with a total headroom of 610 MW re-distributed across 10 SRP BESSs |
5 | Enabled | Hypothetical scenario with a total headroom of 610 MW on 4 SRP BESSs, with step fast frequency response control |
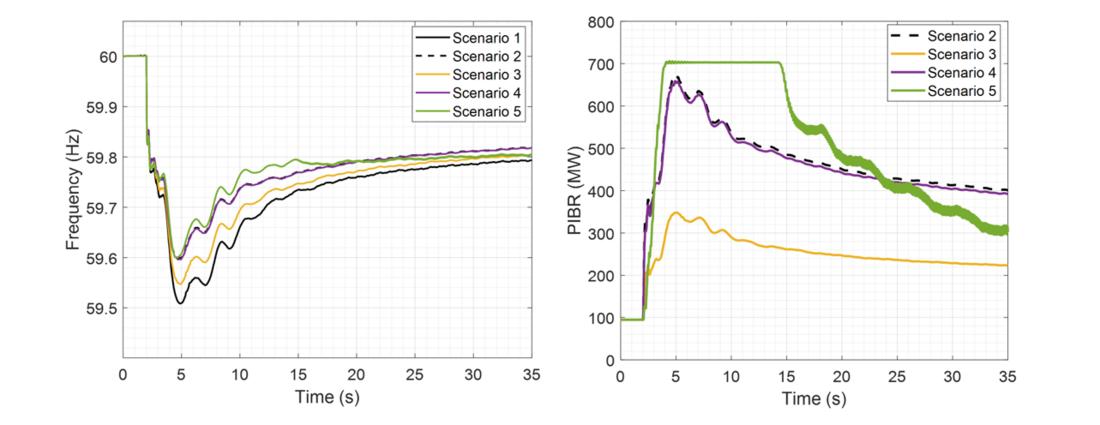
Figure 7 - Comparison of frequency dynamics and IBR active power with different headroom strategies
It is noticed in Figure 7 that with the reduced headroom (610 MW), both the distributed headroom strategy and the step fast frequency control are able to improve the utilization of the limited headroom and achieve similar frequency performance as the case where the full 1420 MW headroom is available. Step fast frequency control here is realized by using a large droop gain combined with an active power limit. The goal of such an approach is to quickly demonstrate the control concept with existing plant control mechanisms - the slight oscillation towards the end is purely an artifact of such an approximated approach and does not compromise the observations made in the timeframe of interest in this study – the first few seconds following a disturbance.
It should be noted that whenever possible, the distributed headroom approach is preferred as it lowers the droop gain needed at each of the plants, reducing the risk of stability issues, and avoids violation of equipment limits. While the step fast frequency control has the potential to improve utilization of headroom that is concentrated on certain BESSs, its use should be approached with caution because it increases the risks of frequency instability, lacks accuracy and flexibility in compensating power imbalances, and may cause stress on other system equipment if not properly controlled . Thorough examination is recommended to ensure stability and satisfactory performance of such control strategies.

3.3. Comparison between Different Resources and Controls
3.3.1. Synchronous Condensers vs. IBRs
Even if the IBRs are configured to provide fast frequency response, the fact that they do not possess physical rotating mass and the way they are controlled bring differences to the speed and shape of the response as compared to traditional generators and synchronous condensers. To compare the frequency response characteristics, time domain simulations are conducted where synchronous condensers and IBRs are located in the same region close to the disturbance so that they experience the same frequency discussion. The synchronous condensers are assumed to be equipped with flywheels for enhanced inertia provision (inertia constant = 10 seconds), which is based on the typical range of 7-12 seconds for machines with flywheels [11]. The synchronous condensers have a total capacity of 2836 MVA, adding 28,360 MVA . s of inertia to the system. As mentioned in Section 1 in Figure 8 has a total inertia of 244,882 MVA . s ; the inertia is reduced to 63,204 MVA . s in Scenario 2; with the addition of synchronous condensers, Scenario 3 has a total inertia of 91,564 MVA . s ; Scenario 4 has the same total synchronous inertia level as Scenario 2. Figure 8 shows the frequency dynamics for these four scenarios with different inertia levels and different frequency response from SRP BESSs.
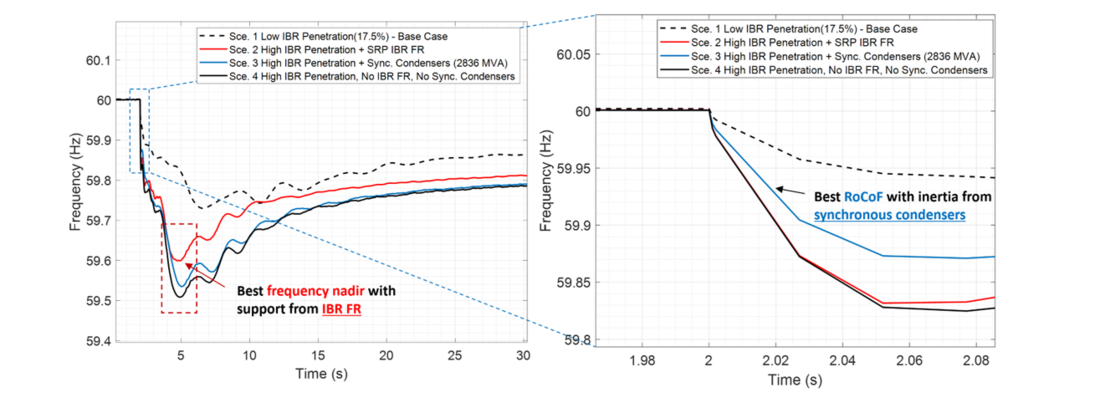
Figure 8 - Performance comparison between synchronous condensers and BESS frequency response
The synchronous condensers mostly improve RoCoF due to the instantaneous release of inertial energy (the blue and red curves in Figure 8). However, such support is transitory and does not sustain long enough to have a meaningful impact on frequency nadir.
Energy storage IBRs, on the other hand, can provide fast yet sustained response and hence improve frequency nadir (the light blue curve in the left plot in Figure 8). However, since they do not have physical inertia that provides instant inertial energy injection, they are not as effective as synchronous condensers in limiting RoCoF in the first few moments following the frequency discursion.
When allocating resources, planners shall consider the strengths and weaknesses of different technologies, and coordinate them to yield the best frequency performance across different time frames.
3.3.2. Grid Forming vs. Grid Following Inverters in Providing Frequency Response
As inverters with different control architectures with advanced grid services (could be called grid forming (GFM) under certain specific situations) are becoming increasingly popular and even mandated for future deployments in certain systems, it is important to understand how they compare to the conventional control inverter topology in providing frequency response.
In the event of a frequency disturbance, a GFM inverter control system autonomously and naturally allows an increase in its power output (due to lower bandwidth control loops) and subsequently adjusts its angle according to an internal active power control strategy (ex. droop, virtual synchronous machine, etc.). This allows GFM IBRs to rapidly increase active power output (i.e., nearly instantaneously and within a similar time frame as synchronous inertia) following a frequency decline.
However, conventional inverters (also known as grid following (GFL) under certain specific conditions) can also be parameterized to provide similar fast frequency response as GFM units. This is illustrated in Figure 9 as an example of GFM/GFL frequency responses, where the red curves represent GFM response, and the blue curves represent GFL response. Both the GFM and GFL units are with the same MVA and placed in the same location, so the frequency dynamics experienced by both devices are consistent. As shown in the close-up view in the right plot in Figure 9, the primary difference in behavior occurs in the first few cycles after the disturbance, in which GFM-controlled IBRs provide faster active power injection. In most cases, this minor difference in the beginning of the response does not significantly impact frequency nadirs. In large interconnections, the combination of GFL-controlled IBRs and other frequency control mechanisms are usually sufficient to provide fast and sustained response to maintain nadirs above UFLS thresholds. In cases where rate of change of frequency (RoCoF) is a concern due to loss-of-mains protection, addition fast response mechanisms are present, or other stability attributes are desired, the benefit of GFM may be further analyzed and quantified.
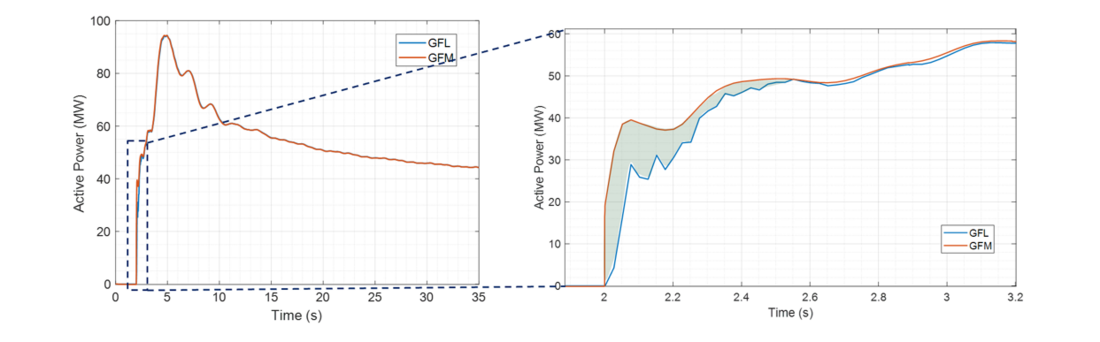
Figure 9 - Comparison between GFM and GFL inverters providing frequency response
It is important to note that, regardless of the control strategy of the inverter, it is always essential have sufficient energy reserve and headroom to support the provision of fast frequency response.
4. Analysis of Regional Inertia and Local Frequency Dynamics
In addition to the interconnection-wide frequency response, frequency dynamics can have a strong regional aspect in certain systems, as discussed in Section 2 (Figure 1 and Figure 2). This is especially evident in systems where there are pockets in the system with weak connections to the rest of the interconnection and low inertia levels in the area. In this section, an inertia regionalization algorithm will be applied to the Western Interconnection to first identify generator clusters, within which the rotating masses behave coherently during a frequency transient. The algorithm then quickly assesses, without the need for time-domain simulations, the risks of regional inertia and local frequency issues for each of the clusters. These regional inertia and frequency dynamic issues can be overlooked in system-wide frequency studies, but it is critical to study and understand them for stable operation of the system.
The inertia regionalization analysis is conducted on the base case with 17.5% penetration level to provide insights into the regional inertia in today’s Western Interconnection. As such analysis looks specifically at the regional perspective of the frequency dynamics, the hypothetical high-penetration (69.6%) marginal case does not provide locationally accurate projection of the future scenarios. Analysis for higher penetration level scenarios can be conducted in future studies once an interconnection-wide planning scenario is produced with accurate projection information across balancing authorities and system operators.
4.1. The Inertia Regionalization Analysis Process
The inertia regionalization algorithm uses only basic system information, such as system topology, branch impedances, generator inertia constants, and generator sub-transient impedances, to form a matrix representation of the system dynamics for analysis. An eigen-analysis approach is then used to decompose the matrix and extract inherent dynamic characteristics of the system in the forms of eigen values and eigen vectors for the subsequent spectral clustering [3]. Figure 10 shows the process of the inertia regionalization analysis. For the clusters identified, the risks of regional inertia insufficiency are assessed for each of the regions.
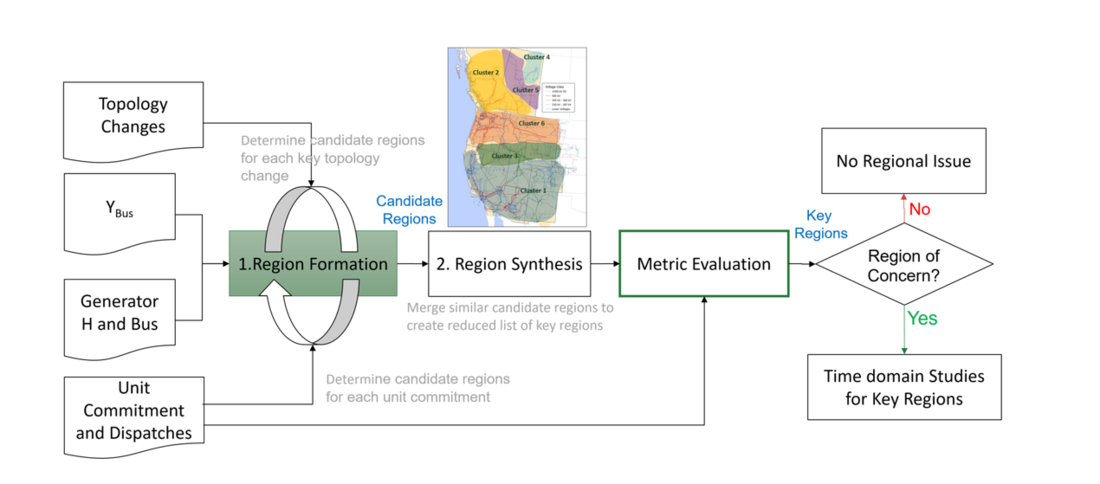
Figure 10 - Process of the inertia regionalization analysis
4.2. Results of Inertia Regionalization Analysis
The inertia regionalization algorithm identified six clusters in the Western Interconnection, as shown in Figure 11 overlaying the WECC map [12], with three clusters in the U.S. and three clusters in Canada. The number of clusters is determined by the algorithm to achieve best division among the clusters during the spectral-clustering process.
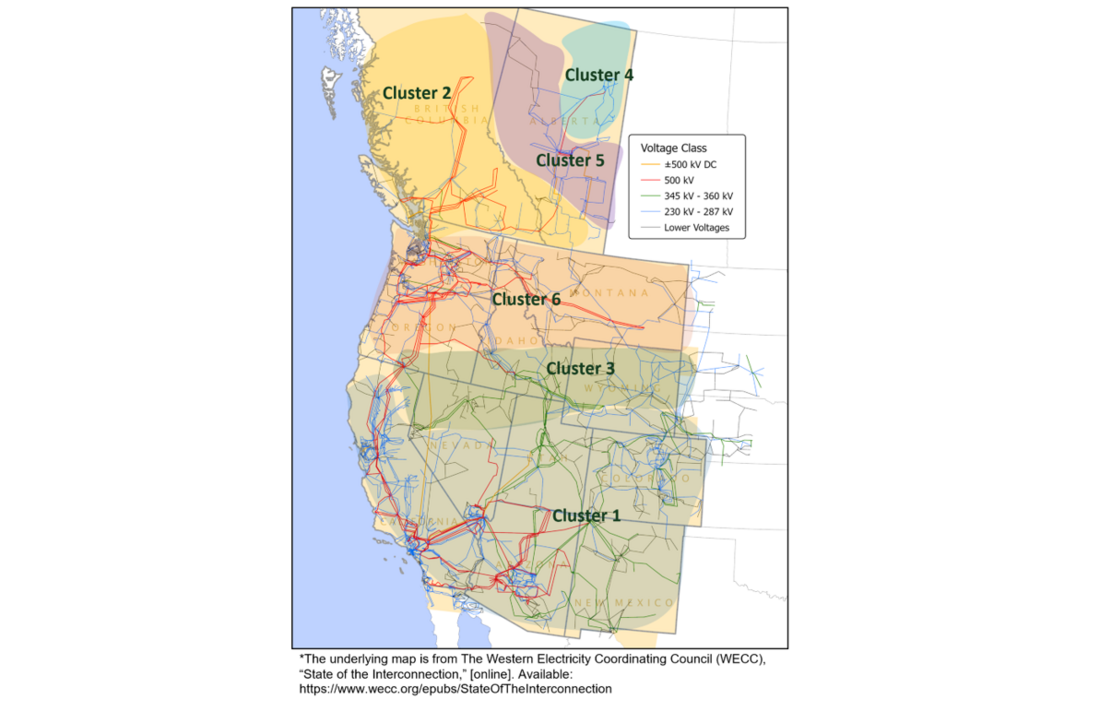
Figure 11 - Clustering result of the Western Interconnection
Among the six divisions, clusters 3, 4, and 5 are assigned high risk levels by the algorithm. Clusters 4 and 5, being in the Alberta region in Canada, have been well known to the industry as the ‘dragon tail’ that can be easily excited for oscillations against the rest of the system because of their weak connection to the system and low inertia level within the region. This is validated by time-domain simulation of the largest generation trip in the region as in Figure 12. While the largest generation trip of 400 MW in this region is relatively small compared to the largest credible contingency of 2750 MW in the Western Interconnection, the RoCoF observed in the region reaches a high level of 442 mHz/s. In addition to the high RoCoF level, oscillations are also observed in the region (light blue and purple curves).
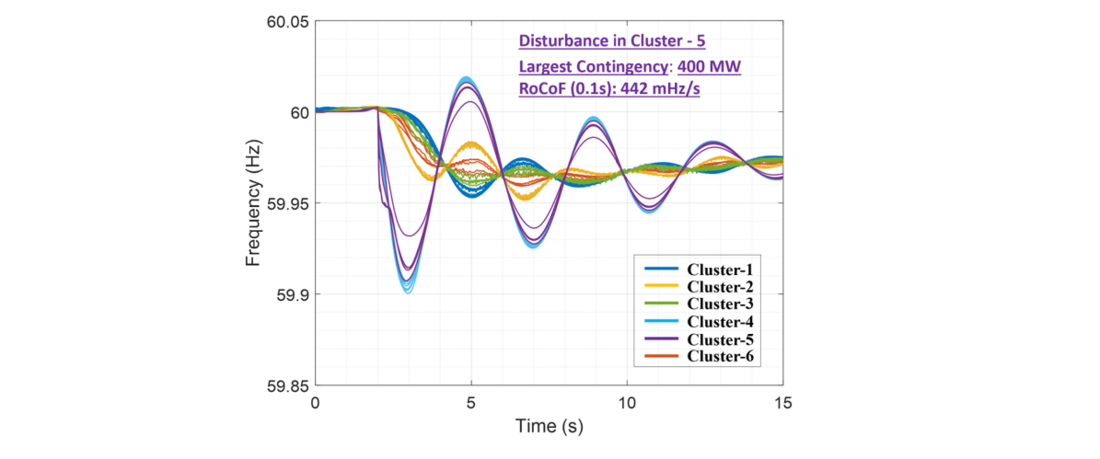
Figure 12 - Frequency dynamics following generation trip in Cluster 5
Another region assigned with a high regional inertia risk level is Cluster 3. This is not a location that would draw attention in traditional system-wide frequency studies because it sits in the middle of the U.S. part of the Western Interconnection and the largest generation trip within this region is also small considering the size of the Western Interconnection. For verification, time-domain simulation is conducted and the result is shown in Figure 13. With only a generation trip of 420 MW, a high RoCoF of 920 mHz/s is observed in the region.
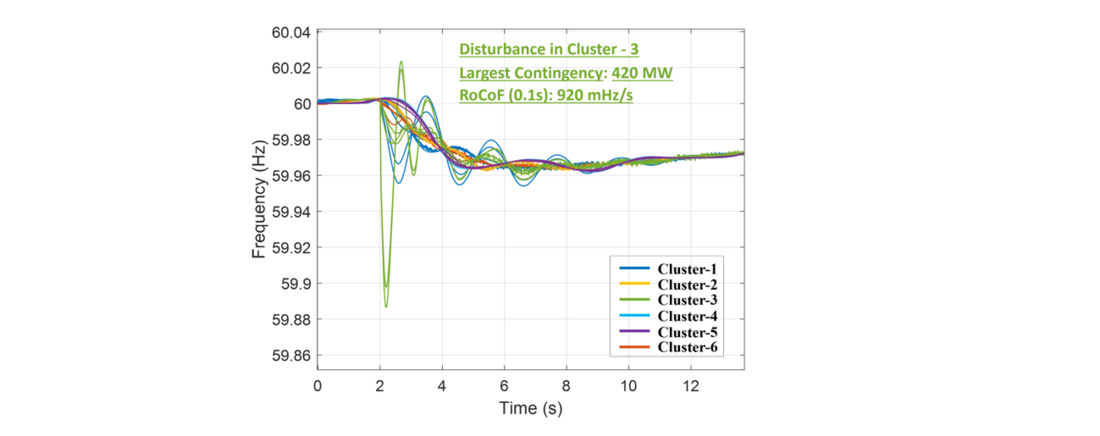
Figure 13 - Frequency dynamics following generation trip in Cluster 3
In interconnection-wide frequency studies, generation trip events like the 420 MW one in Cluster 3 could be easily missed as the focus is usually on the largest contingencies across the whole system (2750 MW for the Western Interconnection). However, with just a small disturbance size, these events could cause a high RoCoF and strong local frequency dynamics. With a closer look at Cluster 3, the region is in the void of the 500 kV transmission backbone as indicated by the red lines in the map (Figure 11), constituting a weak connection to the rest of the system despite its central location in the U.S. The region also has a sparse distribution of rotating mass resulting in a low regional inertia level.
While the regionalization analysis on the 17.5% penetration base case successfully identifies regions where regional frequency dynamics are prominent even with relatively small disturbances, the authors would like to point out that this does not cause immediate concern for the Western Interconnection as RoCoF-based protection schemes are rare in the U.S. and the frequency nadirs in these regions are still well above the UFLS thresholds. However, these analysis results still provide insights that could assist informed decision making. If an interconnection-wide higher-penetration planning case becomes available in the future with accurate generation fleet information from across balancing authorities and operating entities , this inertia regionalization can be conducted again and provides further insights into how the regional inertia picture shifts in those future scenarios and how various frequency support services, including the BESS fast frequency response, synchronous condensers, and other measures can be deployed and allocated to maintain satisfactory frequency performance.
5. Conclusions and Discussions
This study explored the impact of the increasing IBRs on the frequency performance of the Western Interconnection, roles that IBRs can serve to improve the frequency performance by participating frequency response, comparison frequency service provided by different resources and controls, and the inertia regionalization study that rapidly identifies high-risk regions for regional inertia insufficiency and strong local frequency dynamic issues.
In the high penetration scenario created for the Western Interconnection, the frequency nadir near the disturbance location in SRP has decreased from 59.730 Hz to 59.508 Hz, leaving only 8 mHz from the 59.500 Hz UFLS threshold. RoCoF in the region also increased significantly to 1.682 Hz/s for the 2750 MW generation trip. There are also areas in Alberta, Canada dipping below the UFLS due to the oscillations.
With this marginal case, the utilization of IBRs for frequency support has been studied. The IBRs were able to provide fast frequency response and the benefit of such participation can be further enhanced with proper parameterization. Thanks to the fast responding capability, a small amount of IBR fast frequency response reserve has the potential to significantly improve frequency nadir by providing the critical support the system needs in the first few seconds after a disturbance. This fast support provision buys time for other slower resources in the system to ramp up and guardrails the frequency nadir. In addition to the parameterization of IBR frequency response, strategies for increasing the utilization of headroom are also explored. Both the distributed headroom approach and step fast frequency control were able to provide sufficient frequency response performance with a reduced total amount of headroom, but the distributed headroom approach is preferred when feasible as it provides better stability performance and reduces the risk of exceeding equipment or network transfer capacity limits.
Compared to the IBRs, synchronous condensers are more effective at limiting the RoCoF thanks to their inherent physical inertia, but they are not as effective in arresting the frequency nadir since the inertial energy injection is transitory and does not last. Although IBR responses are slightly slower than the physical rotating masses, they are still fast and last long enough to significantly improve the frequency nadir. Among GFM and GFL control in IBRs, both of them can provide fast frequency response as long as they are controlled and parameterized properly. For the sole purpose of frequency response, GFLs are usually sufficient. In cases where the RoCoF can be a concern due to loss-of-main protections or stability improvement is needed, the benefit of GFM shall be further studied in a quantitative manner, which could also inform market design and decision making in resource procurement. It is important to note that, regardless of how the inverters are controlled, having sufficient headroom reserve that supports fast energy injection is always essential for successful frequency support provision.
It is important to note that while some IBRs do have frequency response capability and are tested before commission, it is recommended that relevant entities (e.g. transmission owners and operators, balancing authorities, generation operators, etc.) track and verify IBRs’ provision of frequency service in field operations. This will require establishment of specific technical requirements and procedures to effectively measure and assess the power and energy supplied by the IBRs, as well as the delivery timeframe, in support of system frequency. Such performance verification is a critical step towards high-penetration future where the system increasingly relies on IBRs as the frequency service provider.
Also investigated is the regional inertia and potential local frequency dynamic issues in the Western Interconnection. As inertia is usually not distributed evenly across the system, most interconnections can expect to experience regional inertia issues before interconnection-level inertia insufficiency. This can be further aggravated by the increasing integration of IBRs. In weakly-connected low-inertia regions, a small disturbance could have the potential to cause high local RoCoF levels and strong frequency dynamics. Without the need for time-domain simulations, the inertia regionalization analysis screens for areas at high risk of regional inertia issues that could be otherwise overlooked in system-wide frequency studies. In the Western Interconnection base case with 17.5% renewable penetration, the algorithm identified six generator clusters and assigned three clusters with higher relative risks of regional dynamics. While the two of them in Alberta, Canada have been well-known to the industry, the other one (Cluster 3 in Figure 11) located in the center of the U.S. part of Western Interconnection can be easily missed in traditional system-wide frequency studies. This area sits in the void of the 500 kV transmission backbone and has a low regional inertia level due to the sparse resources. This leads to distinct regional frequency dynamics in the region and leads to a high RoCoF level with a small contingency (as compared to the largest contingency in Western Interconnection) in the area. It is important to note that these regional dynamics are not considered an immediate concern for the Western Interconnection as RoCoF-based protection schemes are rare in the U.S. and the frequency nadirs in these regions are still well above the UFLS thresholds. With that said, the regionalization analysis provides valuable insights that could assist informed decision making in operations and planning. System operators and planners are encouraged to conduct such analyses regularly to assist effective resource allocation and mitigation measures pre-emptively as the patterns can shift with an evolving generation mix and different operating conditions.
References
- G. S. Misyris, S. Chatzivasileiadis, and T. Weckesser, “Robust frequency control for varying inertia power systems,” in Proc. 2018 IEEE PES Innovative Smart Grid Technologies Conference Europe, 2018, pp. 1–6.
- W. Winter, K. Elkington, G. Bareux, and J. Kostevc, “Pushing the limits: Europe’s new grid: Innovative tools to combat transmission bottlenecks and reduced inertia,” IEEE Power and Energy Magazine, vol. 13, no. 1, pp. 60–74, 2015.
- G. Misyris, B. Graham, P. Mitra, D. Ramasubramanian, and V. Singhvi, "Methodology for Identifying Regional Inertia Issues in Future Power Grids," in Proc. 2023 IEEE Power & Energy Society General Meeting (PESGM), Orlando, FL, USA, 2023, pp. 1-5
- Ulbig, T. S. Borsche, and G. Andersson, “Impact of low rotational inertia on power system stability and operation,” in Proc. International Federation of Automatic Control (IFAC), Cape Town, South Africa, 2014, pp. 7290–7297.
- National Renewable Energy Laboratory, ‘Variable Renewable Generation can Provide Balancing Control to the Electric Power System’, Sept. 2013; Golden, Colorado. [online]
- Australian Energy Market Operator, “2022 Inertia Report,” Dec. 2022; Melbourne, Victoria, Australia. [online]
- Australian Energy Market Operator, “Fast Frequency Response Implementation Options,” Apr. 2021. [online]
- European Network of Transmission System Operators for Electricity (ENTSO-E), ‘Fast Frequency Reserve – Solution to the Nordic Inertia Challenge,’ Dec. 2019. [Online]
- ERCOT, “Inertia: Basic Concepts and Impacts on the ERCOT Grid,” Apr. 2018 [Online]
- C. Zhang, H. Li, Z. Jiang, W. Wang, C. Zeng, C. Chen, H. Yin, Y. Liu, M. Baldwin, "Appropriate Evaluation of Primary Frequency Response and Its Applications," in Proc. 2023 IEEE PES GTD International Conference and Exposition (GTD), Istanbul, Turkiye, 2023, pp. 119-123.
- S. Kadam, ANDRITZ, “Boosting Inertia of Synchronous Condensers,” [online]
- The Western Electricity Coordinating Council (WECC), “State of the Interconnection,” [online]