Development and validation of a test cell by CIGRE WG D1.78 for reproducible partial-discharge tests in eco-friendly gases
Authors
Michael M. WALTER, Stefan M. NEUHOLD, Glenn BEHRMANN, Paul DEMEL - FKH, Switzerland
Svetlana GOSSMANN – Siemens, Germany
Austin EICHELBERG – ETH Zurich, Switzerland
Zeljko TANASIC – Hivoduct, Switzerland
Karsten JUHRE, Rona DEHARI – Siemens Energy, Germany
Niclas DÖLZER – University of Stuttgart, Germany
Ingo SCHULZ – Axpo Grid, Switzerland on behalf of CIGRE WG D1.78

Summary
CIGRE D1.78 Working Group is planning extensive round-robin tests examining partial discharge (PD) behavior of environmentally friendly insulating gases and gas mixtures, with up to 10 laboratories participating, using charge-based (IEC 60270), UHF, and other PD measurement methods. This study investigates the possible differences in behavior of the gas mixtures synthetic air, C4-FN/CO2/O2, CO2/O2 and N2/CO2 compared to the industry standard SF6.
A versatile test cell was developed, constructed as a prototype, and later validated by pre-testing with SF6- and synthetic air. Three sets of interchangeable electrodes allow three of the typical GIS PD defect types to be investigated: needle-plane, free-moving (‘hopping’) particle, and ‘particle-on-insulator’. This paper details the test cell, pre-tests of the needle-plane arrangement, specific experimental aspects, and the achievable measurement uncertainty.
Keywords
High Voltage, GIS, Partial Discharge, UHF, Experimental Setup, Alternative Gases1. Introduction
According to the CIGRE D1.78 Working Group TOR [1], the partial discharge behavior of typical defects is to be investigated using conventional charge-based partial discharge—measurement- [2] and UHF PD techniques [3, 4, 5]. This investigation builds on earlier work using natural-origin insulating gases [6] and gas mixtures with halogenated components [7], but with a clear focus on the partial discharge behavior of typical GIS-defects frequently found on site.
The CIGRE WG D1.78 working group is planning extensive round-robin tests in synthetic air and gas mixtures such as C4-FN/CO2/O2, CO2/O2 and N2/CO2, comparing them to the industry standard SF6. The partial discharge behavior in insulating gases and gas mixtures with lower global warming potential (GWP) in comparison to SF6 will be experimentally investigated with up to 10 laboratories participating. To ensure comparability between the laboratories, a test-cell with standardized electrode geometry and clearly defined experimental conditions has been developed. This paper focuses primarily on the needle-plane defect with the other defect types planned for discussion in subsequent publications. For the selected defect, the test cell was validated by pre-tests to find the optimal setup for the round-robin tests. The test-cell design, test set-up, observations and results of these pre-tests are presented here, along with the achieved reproducibility.
Modern Gas Insulated Switchgear (GIS) is designed to be PD-free up to the AC power frequency withstand voltage. For on-site acceptance tests (SAT), PD-measurement for high-voltage (HV)-GIS at is common practice, even though IEC62271-203 allows measurement at for networks with an effective star-point ground. For both SAT and during normal operation (e.g. if on-line PD monitoring systems are installed), PD activity is usually detected using purpose-built near-field radio-frequency (RF) sensors integrated and installed inside the GIS. Partial discharge diagnostics employing (RF) techniques, often termed ‘the UHF method’, have been employed for PD testing and quality control, especially during on-site high-voltage acceptance testing, for over 40 years [12-16] and more recently for UHF-based PD monitoring systems [17-19]. As a result, one of the focuses of the work in D1.78 is performing UHF measurements to examine differences in PD signal behavior as a function of different gases and gas pressures.
Any phase-correlated PD-signal measured in a GIS (excluding signals from any external effects or PD from the high-voltage test source itself) always indicates the presence of an undesired defect which can substantially reduce the voltage withstand capability of the GIS, especially under (but not limited to) transient overvoltage conditions. Typical defects found in GIS are shown in Figure 1. Defects most commonly found on site are particles laying on or adhering to insulator surfaces (‘particle-on-insulator’), free-moving (‘hopping’) particles, and protrusions on HV or ground potential.
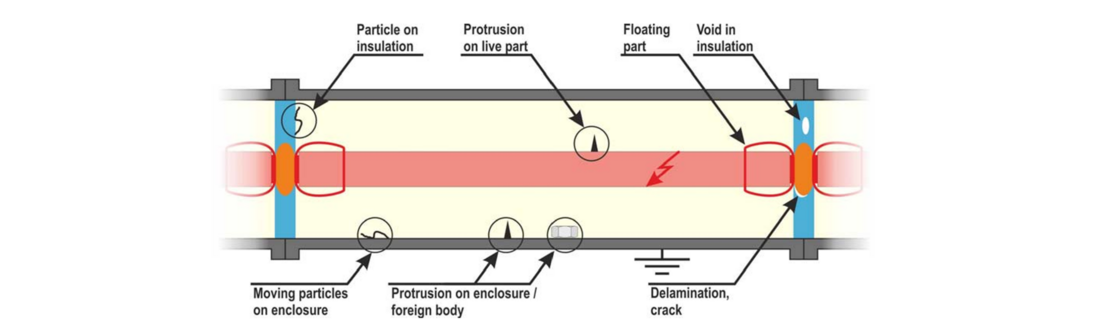
Figure 1 – Typical defects found in gas insulated switchgear [8]
When dealing with alternative insulation gases, it is essential to understand the following in comparison to SF6:
- whether these common defects (if present), will create the same PD-pulse shapes and repetition rates at a given electric field condition and typical operating pressure for the gas,
- whether these gases exhibit the same margin between PD-inception voltage and breakdown voltage at typical operating pressures, and
- whether the UHF-spectrum created by these defects varies in its frequency content or signal energy comparable to SF6 conditions.
Section 2 describes the design aspects of the proposed test cell and the experiment design used to investigate the needle-plane defect. Section 3 documents the validation steps carried out with this test cell. Section 4 discusses the measurement uncertainty achievable for breakdown voltage and PD-inception voltage for the needle-plane tests.
2. Experimental design
Experimental setup: The experimental setup includes an AC-transformer, a test cell with one of three interchangeable defects installed, a conventional charge-based PD-measurement setup according to IEC 60270 and a UHF PD-measurement setup, as shown in Figure 2. The test-cell is placed inside a section of sheet metal tubing (commercial ventilation duct) 140 cm in diameter. This adds some additional protection around the test-cell, creates a defined ground potential surrounding it, and provides mounting support for UHF-sensors at a constant, defined position. While this arrangement does allow UHF PD measurements, it does not reach the low background levels typically encountered within an actual GIS-enclosure with its inherent Faraday shielding. For the charge-based measurements, a coupling capacitor of 400 pF along with a quadripole and an Omicron MPD600 PD instrument were used. For breakdown measurements, a water resistor (approximately 70 kΩ) was inserted between the AC source and the test cell (including the capacitive voltage divider) to limit the short circuit current so as not to damage the secondary winding of the HV test transformer.
2.1. Design of the test cell
The test cell designed and developed by CIGRE D1.78 working group is capable of simulating all defects illustrated in Figure 1. However, within the scope of D1.78, only the needle-plane, free-moving particle, and particle-on-insulator defect types shown in Figure 2 were selected to be investigated. The installation of additional electrode arrangements representing other defect types is also possible. This article primarily focuses on the validation of the needle-plane defect setup.
Design targets: The electrode geometry of the test cell aims to simulate the conditions in a GIS as realistically as possible in a compact geometry. However, to optimize reproducibility, the design reflects other academic arrangements [6, 9, 13]. To allow for possible maximum voltage limits of some of the participating laboratories, a maximum voltage of URMS <100 kV was specified for the gases and pressures expected to be tested, albeit at gap distances smaller than those typical of actual GIS; the results are to be correlated with those from other laboratories testing in actual GIS compartments under comparable conditions.
Simultaneous measurement using both charge-based (IEC 60270) and UHF PD techniques was a fundamental requirement. In addition, setting the test cell’s protrusion electrode at ground potential and isolating the needle tip from the spherical electrode allowed it to be connected directly to the inner conductor of a coaxial cable; this allows direct measurement of the PD pulses on an oscilloscope [9]. Using a borosilicate glass cylinder as a non-conductive housing (see Figure 3), visual observation of the defect during the partial discharge process is possible, as is using optical (solid-state or photomultiplier) sensors, or high-speed video cameras. Simultaneous optical observation of PD phenomena offers advantages especially for e.g. investigating particular movement modes of particles, or whether glow discharge is taking place. Lastly, acoustic sensors can also be mounted on the ground electrode, if desired.
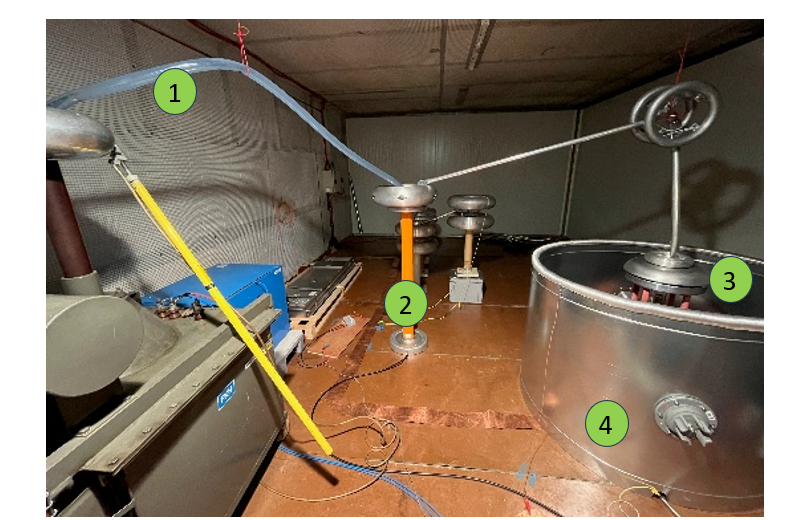
a) Experimental setup for breakdown experiments
- Water resistor
- High-voltage capacitive divider
- Test cell with metal tube
- Ventilation duct and UHF PD-sensor
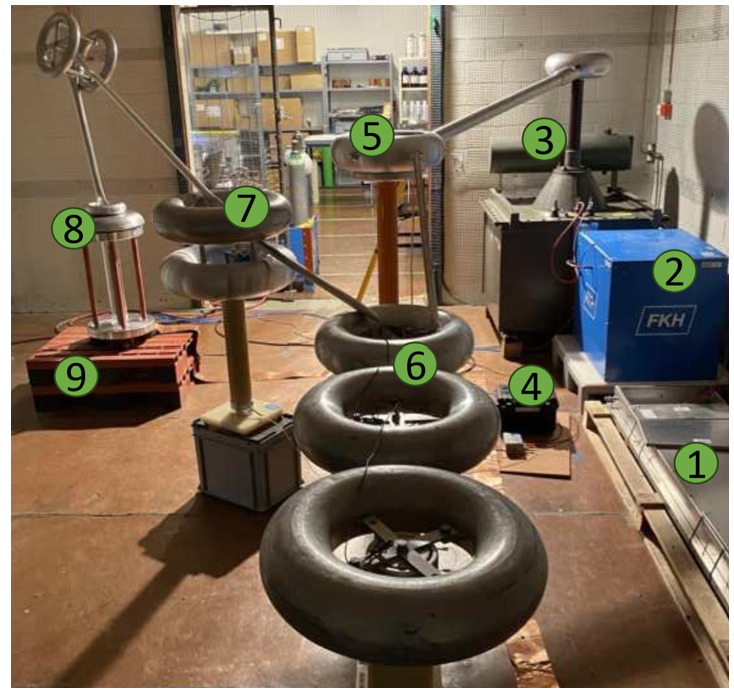
b) Experimental setup for UHF- and charge-based PD-measurements
- EMI-Filter
- Isolating transformer
- HV-Transformer
- Omicron MPD600
- HV capacitive divider
- Parallel compensation capacitors
- Coupling capacitor (charge-based PD circuit)
- Test cell
- Grounding of test cell and gas inlet at ground potential (the ventilation duct is absent here)
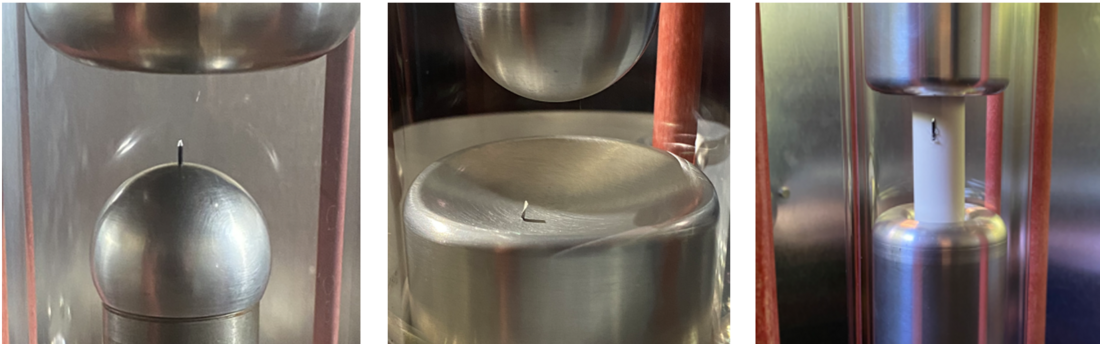
c) Needle on LV-potential - d) Free-moving particle - e) Particle adhering to insulator
Figure 2 - D1.78 test-cell setup for PD and breakdown experiments with exchangeable defects
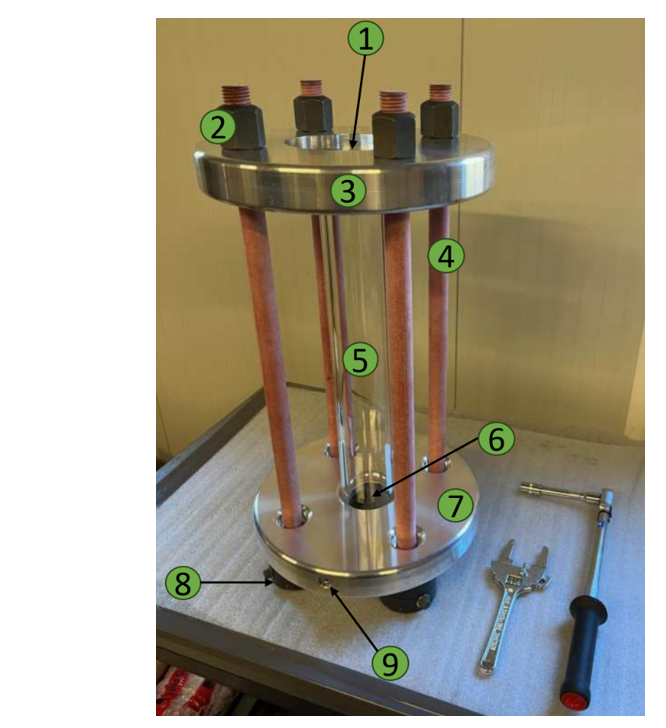
Figure 3 – D1.78 test cell for investigating PD in alternative gases in the presence of defects
- HV- electrode insert (exchangeable)
- four M30 nuts on HV potential
- HV-electrode holder
- four symmetrically arranged non-conductive M30 pull-rods
- hollow borosilicate glass cylinder
- LV-electrode insert (exchangeable)
- LV-electrode holder
- four clamping nuts with reduction gear drive
- DN8 gas inlet (underside of LV-electrode)
Test cell structure: The test cell shown in Figure 3 is designed for a maximum pressure of prel = 15 bar (Note: throughout this report, we will adhere to the convention that all pressures are expressed as absolute, i.e. 0 bar = vacuum). It consists of a hollow borosilicate glass tube and two aluminum electrode holders forming the enclosure of the closed gas chamber. Fixation is ensured by four insulating M30 pull rods (Durostone EPRS1) whose surfaces are flat along their length between the electrodes. This design ensures very high structural stability of the test cell when a force of 6.1 kN is applied to the electrode holders at maximum filling pressure. Four special clamping nuts equipped with reduction gearing (MDR 120 M30) are used to precisely set the tension on the four Durostone pull-rods and thus pre-compress the flat sealing rings (Aramid fiber) between the electrode holders and the glass tube. During testing, high voltage is applied in open air to the HV-electrode holder and the low voltage (LV) electrode-holder is grounded. The HV-electrode holder is covered by a shielding electrode to avoid field enhancement and the resulting unwanted corona discharges. The whole assembly ensures PD-free conditions up to URMS = 100 kV when no defects are present. A standard DN8-gas-inlet is embedded into the LV-electrode for filling and evacuation.
2.2. Design of the needle-plane defect arrangement
Design goal for the needle-plane defect arrangement: The arrangement was designed to allow PD inception only between the grounded needle tip and the HV plane electrode, but at the same time, to prevent breakdown or PD elsewhere in the test cell, up to URMS = 100 kV. The field-inhomogeneity posed by the needle tip should be sufficient to induce PD-inception in SF6 at pabs= 11 bar at a maximum of 80 kV. This ensures a 20% margin for checking a potential gap between PD-inception and breakdown within the same experiment. Breakdown experiments are possible in the arrangement; however, it was not a goal of the test cell’s design to have breakdowns in SF6 at pressures above 3 bar.
Electrostatic design of the test cell: As a starting point for the design, the electrode geometry of CIGRE D1.67 was first considered. The geometry features the well-defined Ogura needle with a 200 µm tip radius protruding 3 mm into the gap, on a sphere of 40 mm diameter with a 15 mm gap distance [7]. The D1.67 design had been optimized for breakdown experiments and has the advantage that breakdown data is already available for 5% C4-FN / 5% O2 / 90% CO2 -mixture and pure SF6. PD-measurements were proposed in WG D1.67, but the design was not fully validated for PD-experiments back then.
In the present test cell developed for D1.78, some deviations to the D1.67 design were necessary. The needle is insulated from the sphere and placed on LV-potential to enable direct measurement of the PD current pulses occurring at the needle tip. The borosilicate glass was selected with an outer diameter of 90 mm and inner diameter of 72 mm. For the desired maximum design pressure of 75 bar (in order to provide a safety factor of 5 for a maximum test pressure of 15 barrel), it was not possible to procure a glass cylinder of larger diameter. Therefore, the diameter of the HV-electrodes were reduced to a maximum of 68 mm. During the pre-testing phase, it was found that a needle with 200 µm tip radius protruding 3 mm from the sphere surface (creating a degree of homogeneity of η=0.056) did not provide sufficient field enhancement to achieve stable PD inception at low pressures in air. As a result, the group experimented by slightly increasing the distance the needles protrude from the spherical electrode and also with sharper radius needles. It was finally decided to have the needles protrude by 5 mm. To keep the gap between the needle tip and plane electrode at 15 mm, the distance between sphere’s surface (not including the protrusion) and the HV plane-electrode was increased from 18 mm to 20 mm.
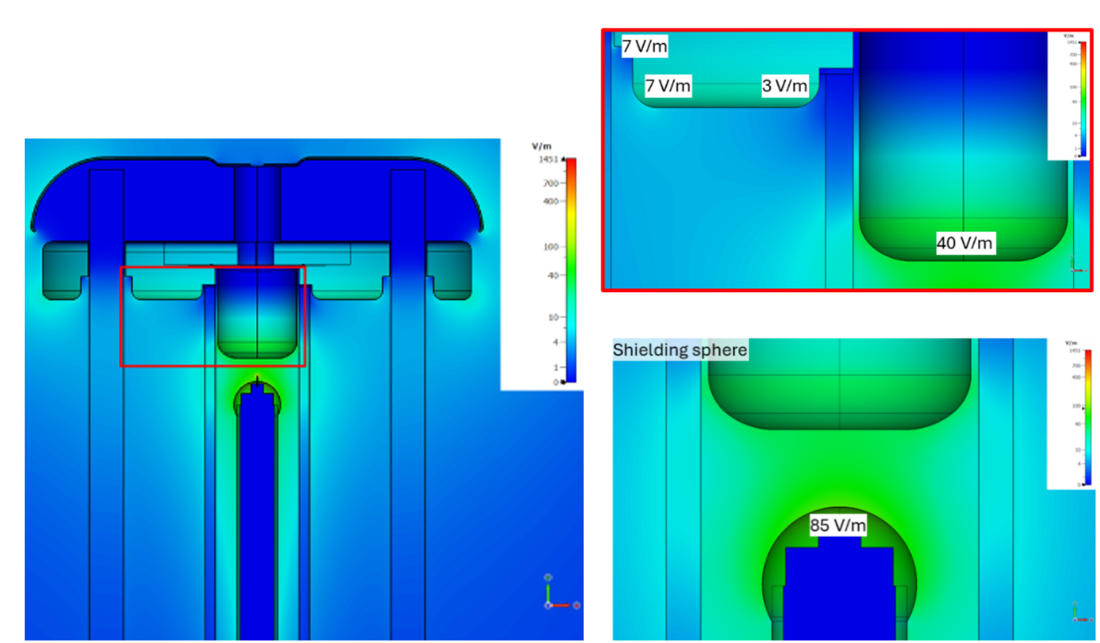
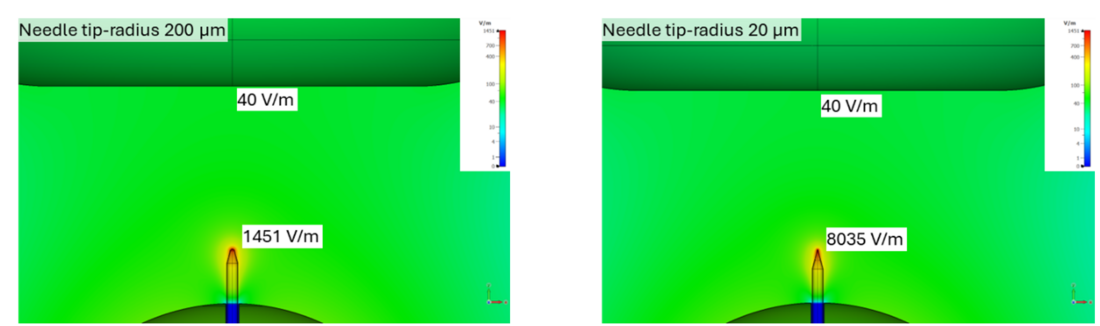
As shown in Figure 4, field simulations were carried out for the final D1.78 test setup, including the HV-electrode holder, for an applied voltage of 1 V (the field values can be proportionally scaled with the actual test voltage). Needles protruding by 5 mm with tip-radius of 200 µm create a field enhancement of 1451 V/m, needles with a tip-radius of 20 µm result in a field enhancement of 8035 V/m, while the background field at the sphere is 85 V/m and the field on the plane is 40 V/m. For a needle with a tip radius of 200 µm, the resulting degree of homogeneity is η=0.046, while for a 20 µm tip radius it is η=0.0083: this is a factor of 1.2X and 6.7X, respectively, more inhomogeneous than the conditions presented in the D1.67 test-cell [7]. Special care was taken to shield the triple point between the glass and the HV-electrode and between the HV-electrode holder and the pull-rods. By shifting the HV-electrode down 50 mm relative to the electrode holder surface, an electric field strength of ≤7 V/m was achieved. For a maximum test voltage of 100 kV, an electric field strength of ≤0.7 kV/mm results at which no PD-activity is created by the test-cell itself.
a) electric field simulation with a protrusion (needle) on low voltage potential | b) background field without the protrusion (needle) installed |
c) field enhancement at the tip of a needle with 200 µm tip radius protruding 5 mm from the sphere surface | d) field enhancement at the tip of a 20 µm radius needle protruding 5 mm from the sphere surface |
Figure 4 – Field calculations of the needle-plane defect arrangement at 1 V on the HV-electrode
Provisions made for direct measurement of the current pulse on the needle: The needle assembly and feed-through is shown in Figure 5. The shielding sphere has a 2 mm hole, leaving an insulating gap of 0.5 mm around the needle (1 mm diameter). Two O-rings separate the outside of the hollow LV-electrode (at test gas pressure) from its inside (at ambient pressure), see Figure 5 (right). The needle is installed by directly inserting it into a special gas-tight SMA feed-through connector. A very low-loss, high bandwidth (18 GHz) 50 Ω coaxial cable (Sucoflex 104) of 1.5 m length is connected on the room pressure side of the SMA feed-through, just long enough to extend past the ventilation duct. This connects directly (via SMA feed-through) to a second cable of the same type, 5 m long, which connects to a digital oscilloscope or spectrum analyzer, allowing direct measurement of the PD pulse currents. The shorter cable on the test cell allows for easier handling (e.g. lifting the test-cell onto a workbench); the high bandwidth (18 GHz) SMA feed-through connector has negligible effect on the PD pulse-shape (the end-to-end frequency response was verified with an RF network analyzer).
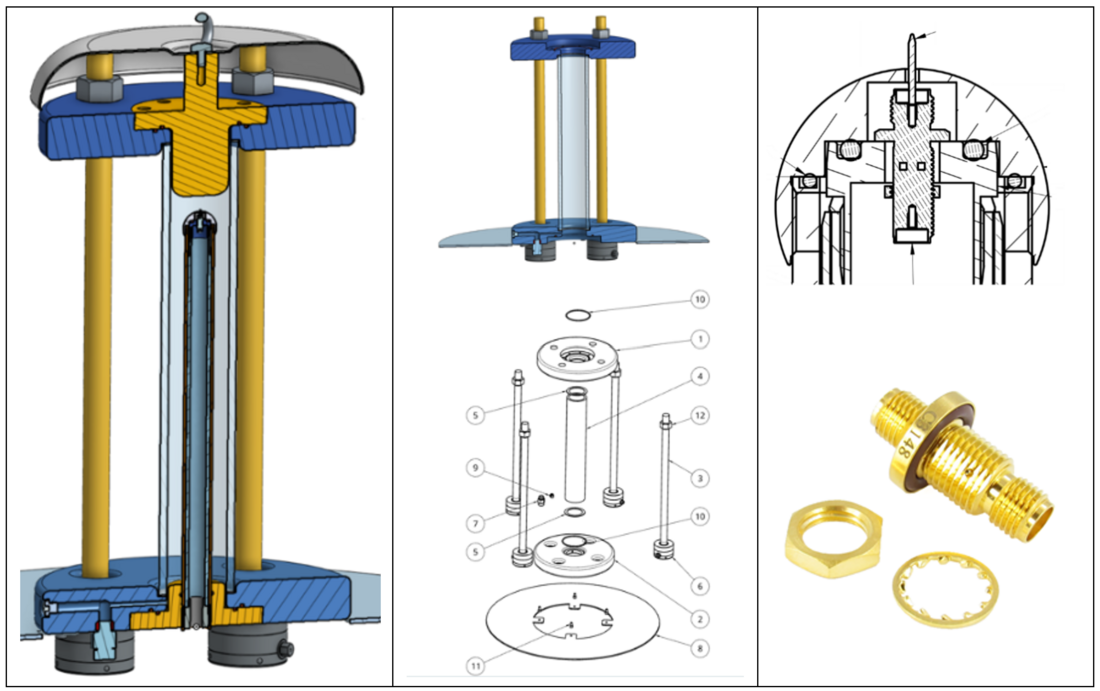
Figure 5 – Design details of the needle-plane defect arrangement: (left) assembled test-cell, (middle) exploded view, (right) gas-tight SMA feed-through for direct measurement of PD at the needle tip
Assembly procedure for needle-plane defect arrangement: A thread at the bottom of the LV-electrode enables a varying gap distance (see Figure 5). The needle length and shape can be varied simply by installing needles with different lengths and tip radii. The procedure for assembling the test arrangement is described in detail in Figure 6. Note that the tools displayed in yellow in step 2 and the tools displayed in yellow on the HV-potential end in steps 5, 6, 8 and 9 are not part of the test object; they were designed to support the assembly procedure of the test object and ensure a positioning tolerance of ±0.01 mm for the gap distance (measured from the needle tip to the HV plane-electrode) and the needle-length (measured from needle-tip to the shielding sphere tip). Without using the proposed positioning tools, a positioning tolerance within <±0.050 mm was easily achieved during extensive tests by means of custom precision machining of the needle samples.
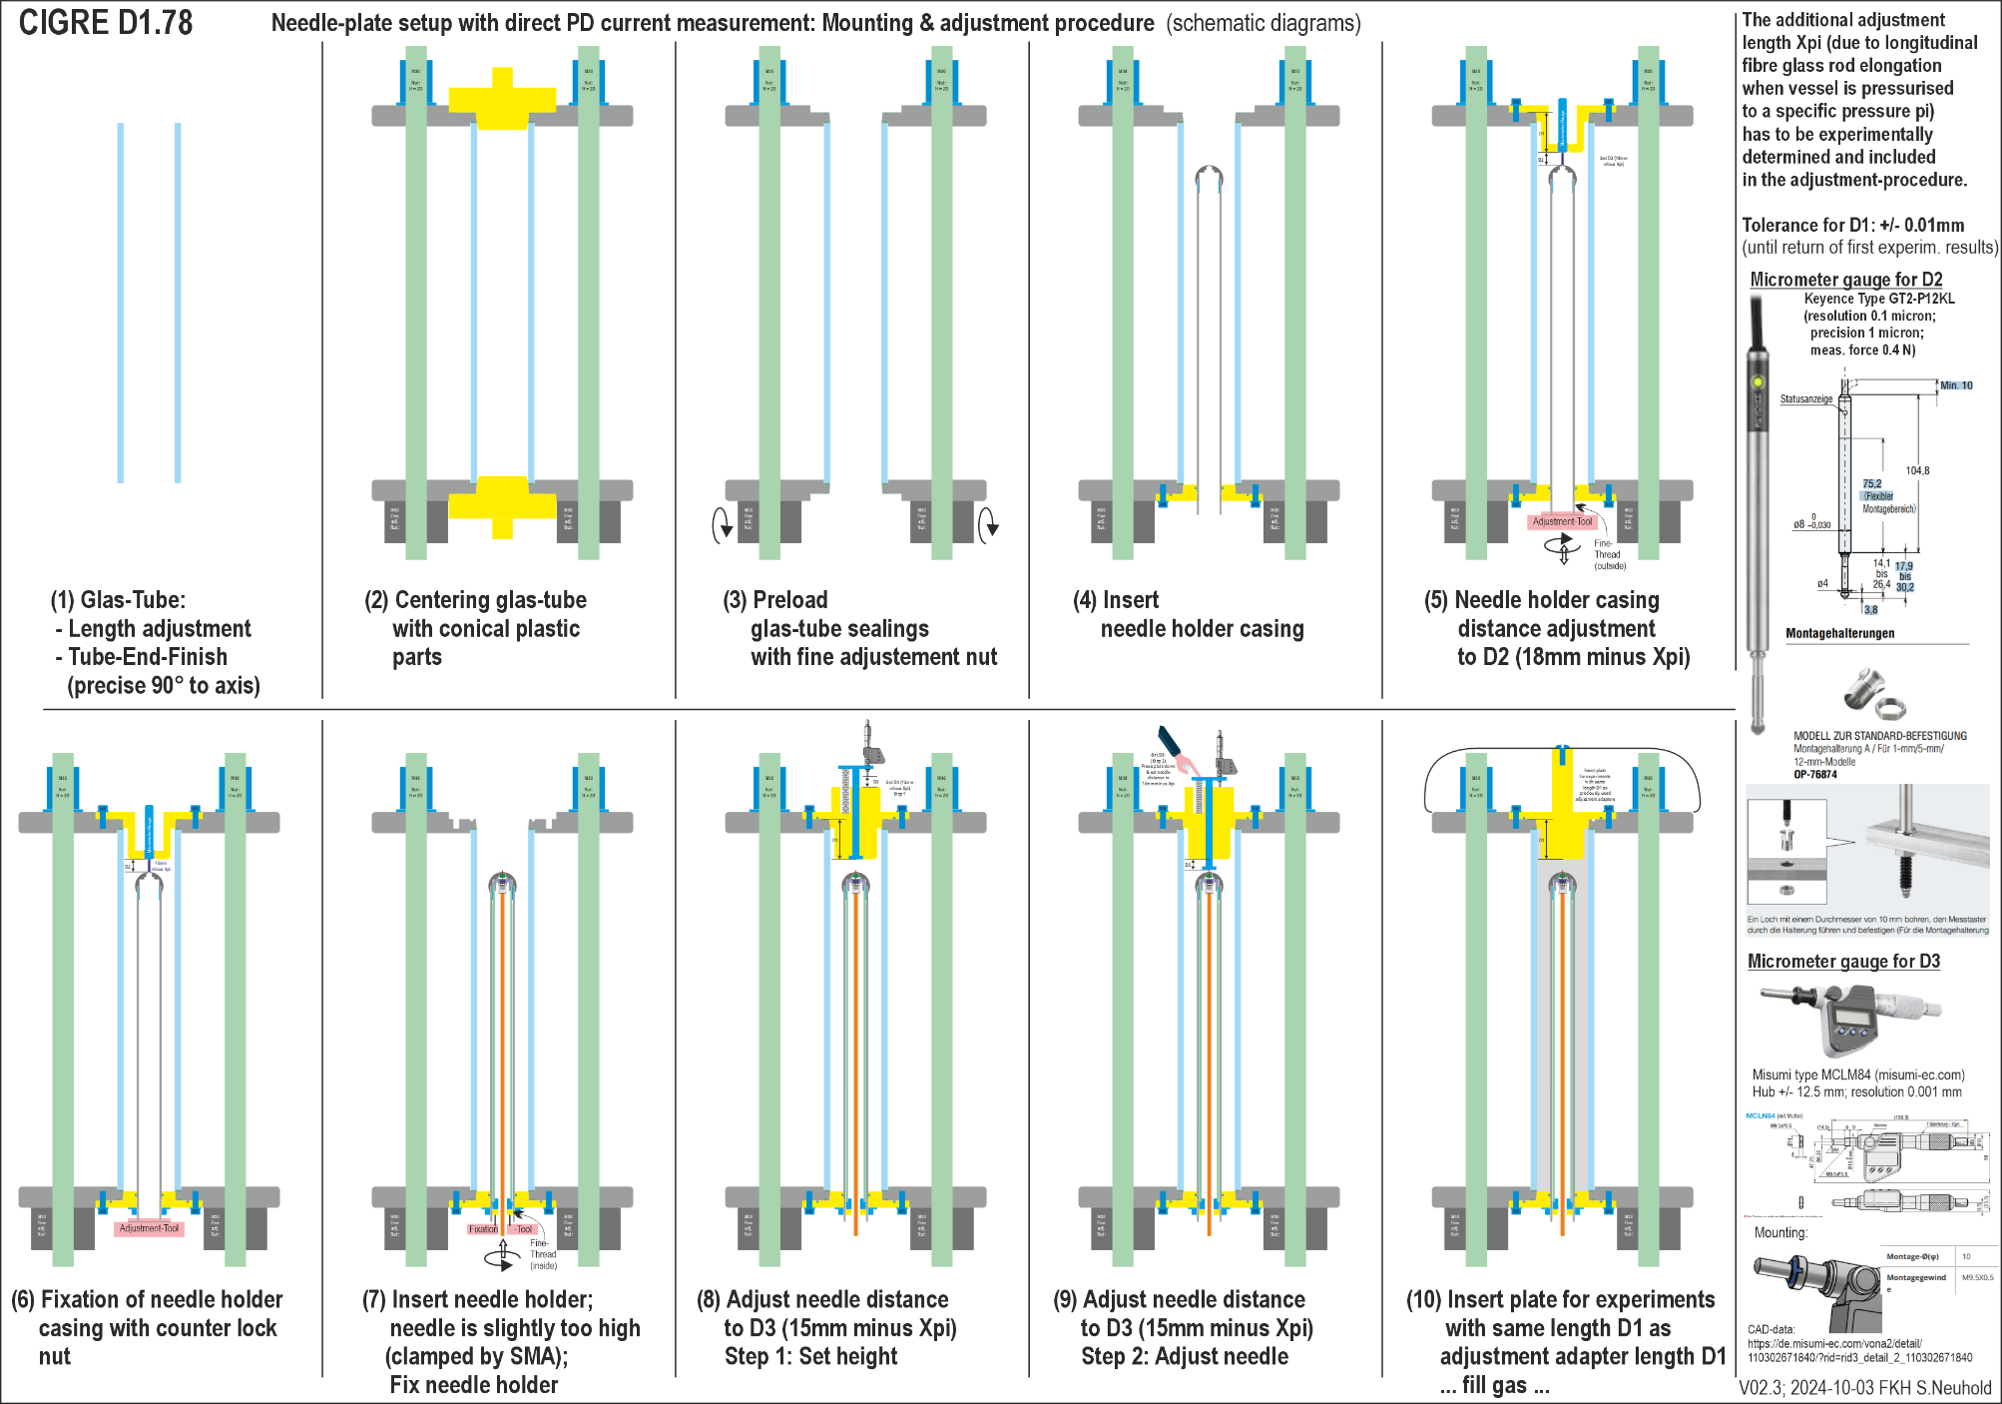
Figure 6 – Assembly procedure of the test cell
3. Validation tests
During development of the test cell, special care was taken to enable reproducibility of the experiments and minimize the effect of potential influencing factors. The intention of the pre-tests was to verify functionality and ensure that the design is suitable for the intended round-robin tests. Possible influencing parameters were identified and their influence quantified in the tests T1 to T13 as far as possible. The resulting measurement uncertainty is discussed in Section 4.
T1 - Mechanical burst-test: For safety reasons, and to comply with pressure vessel regulations, the design pressure was validated by performing a (water) burst test on the assembled test-cell workshops of Hivoduct AG. The borosilicate glass tube was clearly identified as the weakest element, yet it held up to pabs = 78 bar before fracturing. Based on that test, a substantial safety margin of 5 allows testing operation at pressures up to prel = 15 bar.
T2 - Electrode movement test: The pressure in the gas compartment creates a force that could potentially cause a change in gap distance by moving the HV- and the LV- electrode holders apart from each other. In parallel to the burst test, the change in distance between the electrodes was measured. At prel = 65 bar an elongation of the test cell by 0.05 mm was measured. This corresponds to an elongation of 0.012 mm at the maximum allowed filling pressure of prel = 15 bar.
T3 - Repetitive assembly-test: The test object was assembled and disassembled with and without applying the assembly support tools described in Figure 6. When applying the positioning tools, setting the needle position or gap distance within <0.01 mm is achievable. When using a digital caliper with 0.010 mm measurement uncertainty for needle installation and gap distance setting, the distance accuracy achievable in practice is estimated to be in the range of 0.1 mm (considering the less controlled measurement procedure using a caliper). The protrusion distance was always checked before and after installation. In both cases, no systematic change of breakdown voltage nor PD-inception voltage was detectable after reassembling the test object or changing the needle.
T4 - Tightness-check: A tightness check was performed by leaving the test cell under pressure for several days and measuring the pressure at the test object before and after. For the test cell pressurized at pabs =6 bar a pressure drop of <15 mbar/day was measured. The tightness does not reach values of typical GIS of < 0.5 %/year specified in IEC 62271-203. However, with approximately 2 l gas volume, the test cell is a factor 100X smaller than typical GIS compartments, and therefore a factor of 100 higher leak rate was expected. This level of pressure stability is more than sufficient to exclude either a change of pressure or any substantial loss of gas for the duration of an experimental run (typically an hour or two). When working with gases of GWP > 1, it is not recommended to leave the gas in the test object at pressures over 1 bar for longer periods.
T5 - determination of divider ratio: Before starting the measurement, the 140-pF capacitive voltage divider was measured with a calibrated ratio meter Type 430 from Haefely. With ± 1% uncertainty, a divider ratio of 4947 was determined.
T6 – determination of the total harmonic distortion: All voltages referred to in the experiments were measured as values. Breakdown voltages are affected mainly by the peak value and not by the RMS value; the highest electric field magnitude occurs at the positive and negative peaks of the applied AC voltage sine wave. PD-inception voltages for needle-plane defects are also mainly dependent on the peak value, taking place in the regions of the voltage peaks at 90° or 270°. Above inception, the width or angular displacement of Phase Resolved Partial Discharge (PRPD) patterns will visibly broaden. Widening of the PRPD pattern can also take place if the sinusoidal waveform exhibits flattening in the region of the voltage peaks, due to the presence of distortion harmonics. The total harmonic distortion of the sinus waveform was checked using a network analyzer (A-Eberle PQBox200). A total harmonic distortion (THD) < 5 % was able to be achieved in the experiments.
T7 - Stability of the needle: All the needles used for the PD tests were extensively investigated using various microscopy techniques at the Product Development Group of ETH Zurich. Needles (of both 200 µm and 20 µm tip radii) which were subjected to PD-activity or breakdown were examined under high magnification and compared to new ones. Figure 7 shows a series of microscopic images of four different needles taken using a Keyence VK-X200 series 3D Laser Microscope from different angles. The images in the left column show the needles' side profile, the middle column shows the end view of the tip, and the right columns shows a 3D scan of the surface. The top row (a) are images of a new 200 um tip radius before PD testing, row (b) shows a 200 µm radius needle after PD measurements only. Row (c) shows a new 20 µm tip radius needle before PD testing, and row (d) shows a 20 µm tip radius needle after PD measurements. As can be seen here, although the 85 kΩ current limiting resistor does act to somewhat reduce the damage caused by breakdown, it does not completely prevent surface degradation due to PD activity.
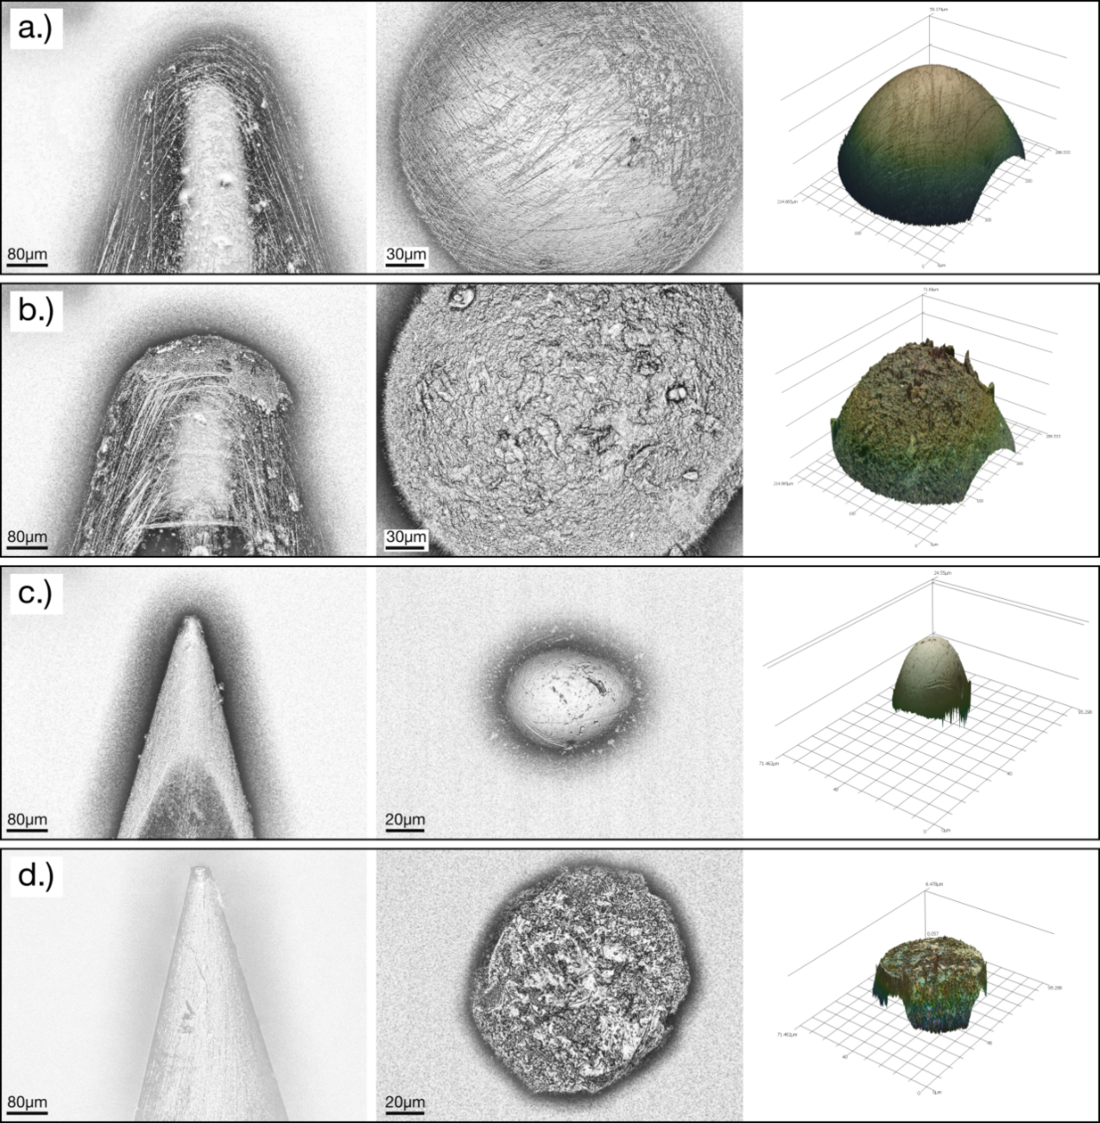
Figure 7 – microscopic comparison of new needles with needles subjected to PD-activity
In the needle-plane arrangement investigated, withstand-voltages are quite independent of the needle radius, so that the needle tip degradation should have limited effect on the breakdown results due to corona stabilization effects (see Figure 9 for the small difference in breakdown voltage of a 20 µm and a 200 µm needle).
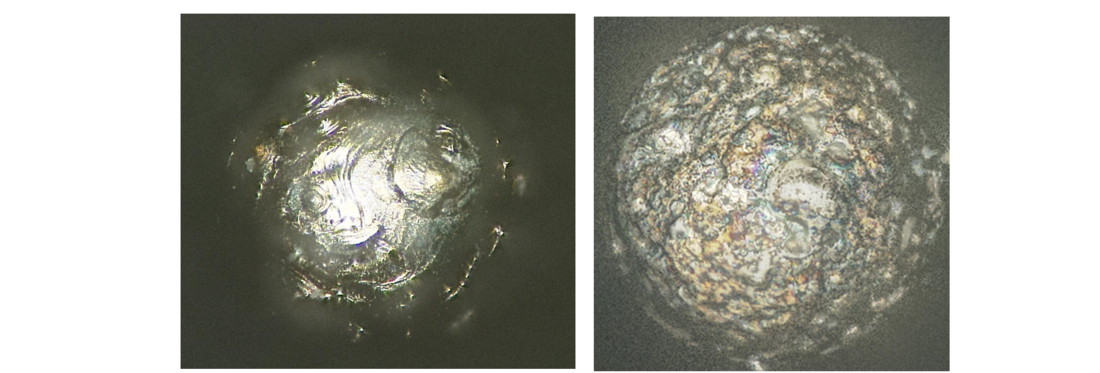
Figure 8 – microphotographs of 200 µm (left) and 20 µm (right) needles which underwent breakdown
In contrast to the case of breakdown, PD-inception voltage is directly affected by the field enhancement at the tip of a protrusion which depends on its radius. The curves in Figure 9 show the substantial difference in PD-inception voltage of 20 µm and 200 µm needles. As can be seen from the microscopy images in Figure 8, flashovers result in significant distortion of the needle tip’s surface due to melting. Therefore, it is necessary for needles used in PD-experiments to be exchanged immediately in the case a flashover occurs.
However, Figure 7b shows exposure to even low-intensity (low magnitude, short duration) PD results in localized pitting and tiny ‘micro-tip’ protrusions forming on the tip; especially these latter structures may be significant in the context of D1.78’s work. The ‘microtips’ (Fig. 7b right) are on the order of a few µm in size; compared with the much ‘flatter’ 200 µm radius tip, we think the resulting local field enhancement sufficient for PD inception to occur at slightly lower voltages compared to a new needle. Furthermore, in our direct oscilloscope measurements of the needle, we often observed several pulses clustered both before and after the ‘main’ PD pulse (assumedly the one recorded by the measurement system). These accompanying pulses were mostly lower in amplitude (~20% of the main pulse) and separated by a few nanoseconds in time, though in some cases we observed doubling of the main pulse. (We also observed cases where pulses followed the ‘main’ pulse by several microseconds, but at voltages of 1.1-1.2 PDIV.) In fact, cases in which we saw only a single pulse were in the minority. We note such multiple pulse trains have been observed previously [19]. These results show what is typically assumed to be a single PD pulse emanating from a needle tip is actually composed of a cluster of pulses, suggesting ‘inception’ may actually be a combination of several such ‘micro-protrusions’ incepting and interacting. However, confirmation of such behavior would demand much more sophisticated tools (e.g. high-speed microscopic video monitoring of the needle tips correlated with the time-domain pulse activity) and test set-up beyond the scope of the present tests done till now. We therefore recommend keeping the total charge and duration of PD-activity seen by each needle to the minimum possible to prevent surface degradation of the needle tip. This can be effectively achieved by increasing the applied voltage slowly by <200 V/s, stopping immediately upon inception, and reducing it as soon as a reasonable PRPD pattern can be acquired (~10, 20 s maximum). If the intention is to measure patterns at 1.1 or 1.2 x PD-inception voltage, it is recommended to exchange the needle for each pressure value, based on the obvious deformation of the needles we examined following such intense exposure.
T8 - Breakdown measurements and PD-measurements in synthetic air at varying pressure: A series of 10 breakdowns and 3 PD-inception measurements in synthetic air were performed for pressures pabs between 1 and 11 bar (see Figure 9).
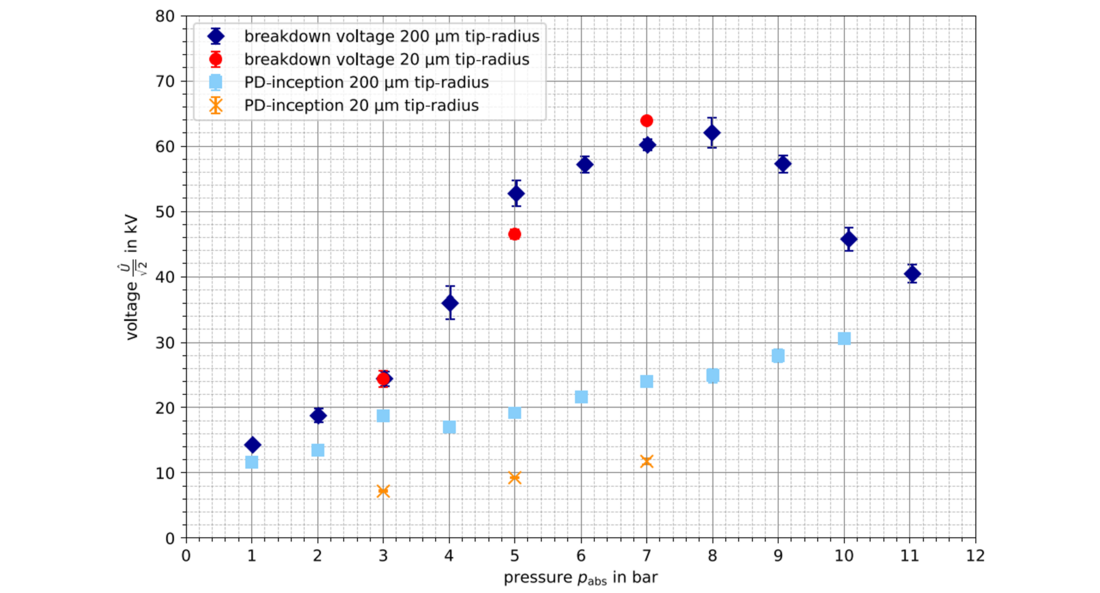
Figure 9 – PD-inception voltage and breakdown voltage in synthetic air with a 5 mm needle with 20 µm and 200 µm tip-radius and 15 mm gap distance. The error bars indicate variations in subsequent breakdown experiments
We typically observed variations of ±2 kV for subsequent breakdown voltage, and variations of ±1 kV for PD-inception voltage. As would be expected, variation of gas pressure has a very strong influence on the breakdown voltage as well as on the PD-inception voltage. The results show a mostly linear trend for the PD-inception voltage increasing with pressure. It should be noted that the PD-inception voltage at pabs = 3 bar for the 200 µm tip-radius needle deviated from the linear trend observed at other pressure levels. However, it was consistently reproduced for multiple measurement series. It needs to be investigated with further experiments to see if this is caused by a physical phenomenon. The breakdown voltage curve shows a maximum close to pabs = 8 bar. A further increase of pressure above this value leads to a decreasing breakdown voltage and a reduction of the ratio between the PD-inception voltage and the breakdown voltage. This behavior is consistent with needle-plane experiments reported in the literature [10].
In addition to the experimental investigation of the influence factors pressure, needle length, needle radius and gap distance, simulations of the breakdown voltage and the PD-inception voltage were performed for different gases. The results of these simulations will be reported in a separate publication.

T9 - Effect of the tip-radius: The effect of a tip-radius variation between 20 µm and 200 µm is displayed in Figure 9 (and 8). The results show that in this case the tip radius has relatively little effect on the breakdown voltage, while the PD-inception voltage is strongly dependent on the tip-radius. In other words, a sharper tip-radius will result in a larger margin between the breakdown voltage and the PD-inception voltage. This leads to the conclusion that detecting blunter protrusions in a GIS presents a greater challenge.
T10 - Direct current pulse measurement on insulated needle on LV-potential: Partial discharge pulses were measured in synthetic air and in SF6 using a digital oscilloscope with 2 GHz bandwidth at a sampling rate of 10 GB/s. Figure 10 shows that the PD-pulse currents (via 50 Ω input impedance) occurring at the needle tip can be measured reliably as in [12]. The difference in rise-time of the pulses in the different gases needs to be highlighted. For measuring the relatively slow pulses in synthetic air at lower pressures (say <3 barabs), the 2 GHz oscilloscope is fast enough. However, at higher pressures and certainly for measuring pulses in SF6, an oscilloscope with minimum
6-10 GHz bandwidth and sampling rate ≥30 GS/s should be used [12].
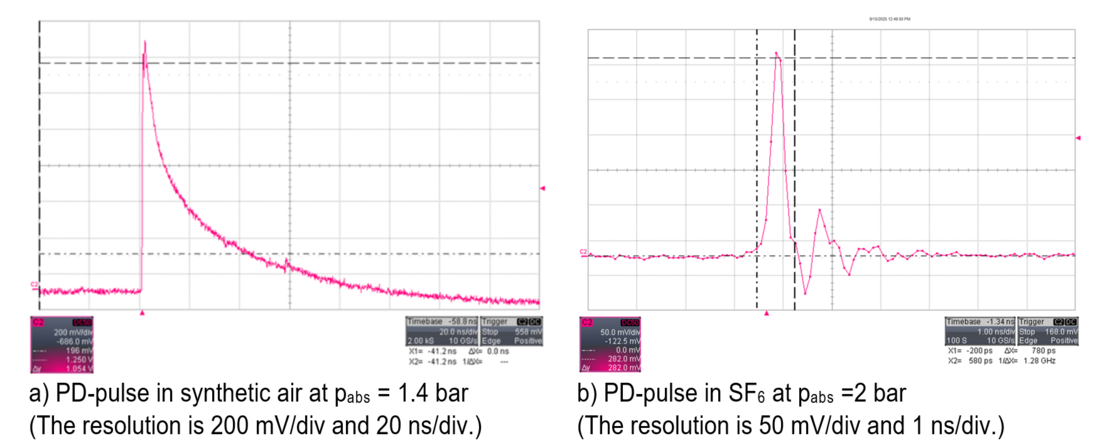
Figure 10 - PD-pulse in synthetic air, 1.4 bar (a) and in SF6, 2 bar (b)
T11 - Validation of the gas exchange procedure: Recovery of the insulating gas is typically only possible down to 1 mbar, meaning that after evacuation small amount of the previous test gas tested remains inside the test cell. Due to the large difference between the dielectric withstand strength of SF6 and e.g. synthetic air, even a small amount of leftover SF6 could significantly increase the PD-inception voltage and the breakdown voltage in subsequent testing. It is therefore recommended that the test-cell be disassembled and the Aramid gaskets changed between candidate gases. No absorbers were used in the test cell, as they can accumulate and release gas components of present or prior gas mixtures. In the experiments presented here, between filling with different gases, the test cell was always evacuated to <1 mbar for several minutes, backfilled with nitrogen and again evacuated, and then opened and cleaned with isopropanol. Also, the high-pressure hoses used for connecting the test-cell to the respective gas-handling machines were changed (e.g. hoses used for C4 were not used for SF6, hoses for synthetic air were not used for C4 or SF6, and so on). No obvious influence on the PD-inception voltage and breakdown voltage was observed when following this procedure.
T12 - Charge-based PD-measurement: Figure 11 shows a PRPD-pattern produced by a needle with 200 µm tip radius protruding 5 mm at pabs = 5 bar in synthetic air. A center frequency of 250 kHz with a measuring bandwidth of ±150 kHz was applied. A CAL2B-pulser with uncertainty of ± 5 % was used to calibrate with 5 pC before the measurement. With a noise floor of 500 fC, the setup provides sufficient sensitivity to detect PD signals of very low amplitude. At inception, the typical pattern of a protrusion on ground potential showed PD pulses appearing in the first half-wave of the applied AC voltage at the positive peak (centered at 90°). After increasing the voltage to 1.1 and 1.2 x PDIV, the phase angle of PD-activity in the first half-wave widened, the pulse rate increased, and subsequently PD pulses would also begin to appear in the second half-wave, centered around 270°; the latter are emanating from the space-charge cloud in front of the needle.
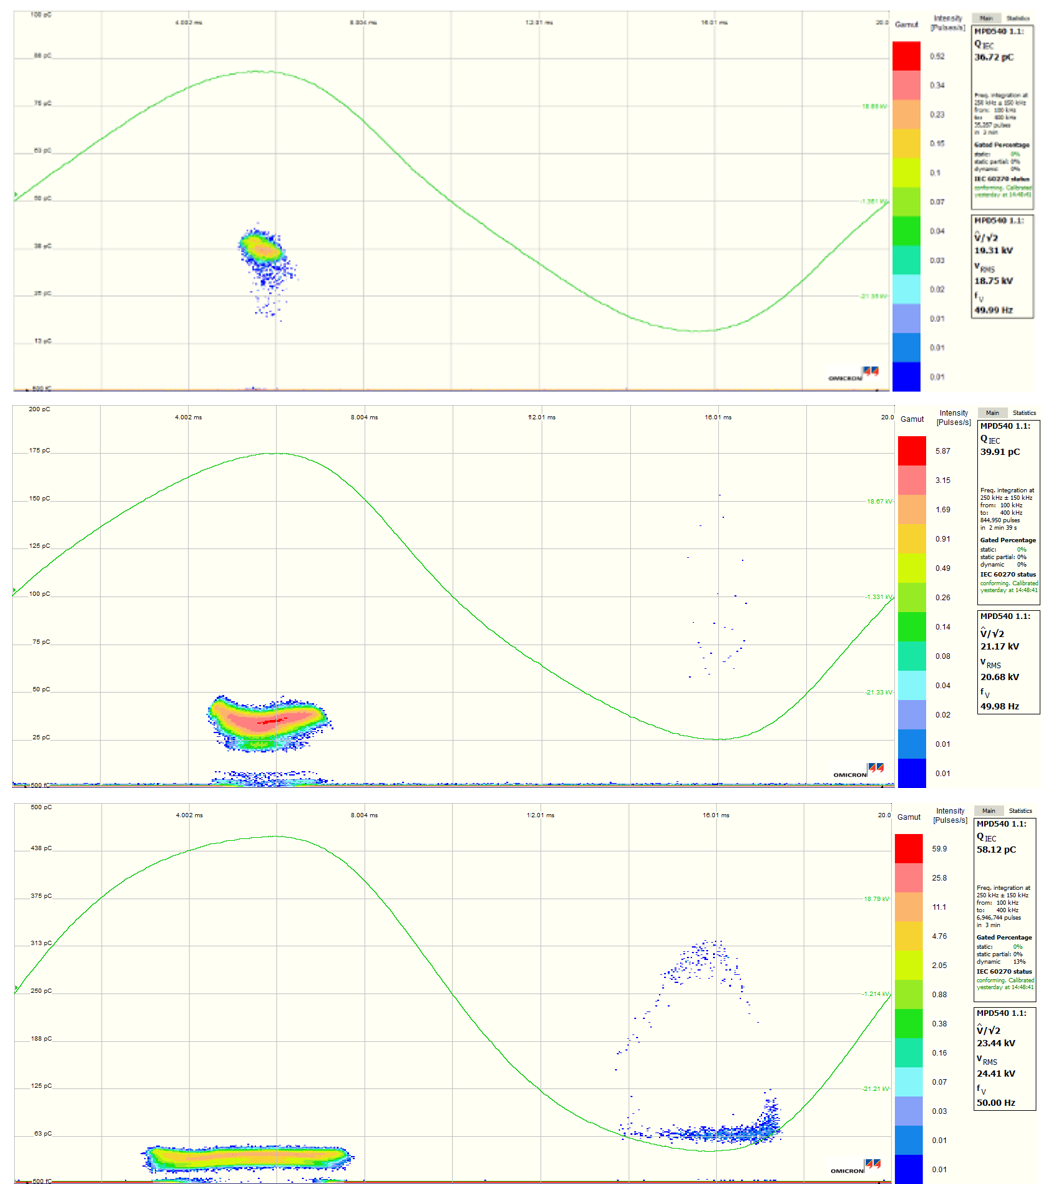
Figure 11 – PRPD of a 5 mm needle with 200 µm tip radius in synthetic air at pabs = 5 bar
(top: PDIV at ~40 pC in first half-wave and no PD in second half-wave center 1.1x PDIV at ~45 pC in first half-wave and ~150 pC in second half-wave, bottom 1.2x PDIV at ~50 pC in first half-wave and ~320 pC in second half-wave), all acquired for 3 minutes.
T13- UHF-measurement:To validate the UHF-measurement setup, a free-moving particle arrangement in the test cell was used instead of the needle plane arrangement. Mobile (‘hopping’) particles are a common GIS defect type, and are thus also used as the typical signal source in the CIGRE UHF Sensitivity Verification Step 1 Test procedure, as detailed in CIGRE Technical Brochure 654 [11].
As is well-known, the upper roll-off frequency of the PD signal in the RF spectrum is directly related to the rise-time of the PD pulse; both of which are directly affected by the gas type and pressure (along with, of course, the all damping/filtering effects along the PD signal’s propagation path, from source location to measuring instrument input). For example, in Figure 12a), the RF spectrum of a hopping particle in synthetic air at pabs = 1 bar clearly shows the fast roll-off of the UHF spectrum at low pressure. In the next Figure 12b), the UHF spectrum of the same particle was taken again in synthetic air, but this time at a pressure of pabs = 6 bar. (The red asterisks mark resonances resulting from the combination of the UHF sensor’s own frequency response, its position vis-à-vis the floor, the test cell, and the sheet-metal heating duct.) The high-pressure spectrum has much less of a downward tilt at higher frequencies compared to the low-pressure one.
Finally, Figure 12c) shows the UHF spectrum of the same particle but moving in SF6 at a typical operating pressure of pabs = 6 bar. Again, the roll-off (or flatness) of the RF spectrum is a direct product of the PD pulse rise-time, which is much shorter in SF6 (the propagation path remains unchanged).
Figure 12d) shows a comparison of a single PD pulse measured directly at the needle-tip; the red slow rising trace was taken in synthetic air at a pressure of 2 bar, showing a rise-time of about 700 ps (indicated with arrows), while the brown fast rising trace is the same needle in synthetic air at 11 bar (the actual rise-time of the gas at this high pressure is too short for the oscilloscope employed – essentially it’s tracing the oscilloscope’s own frequency response). Also, the difference in fall-time at these two very different pressures is clearly visible, with recombination taking much longer at the lower pressure.
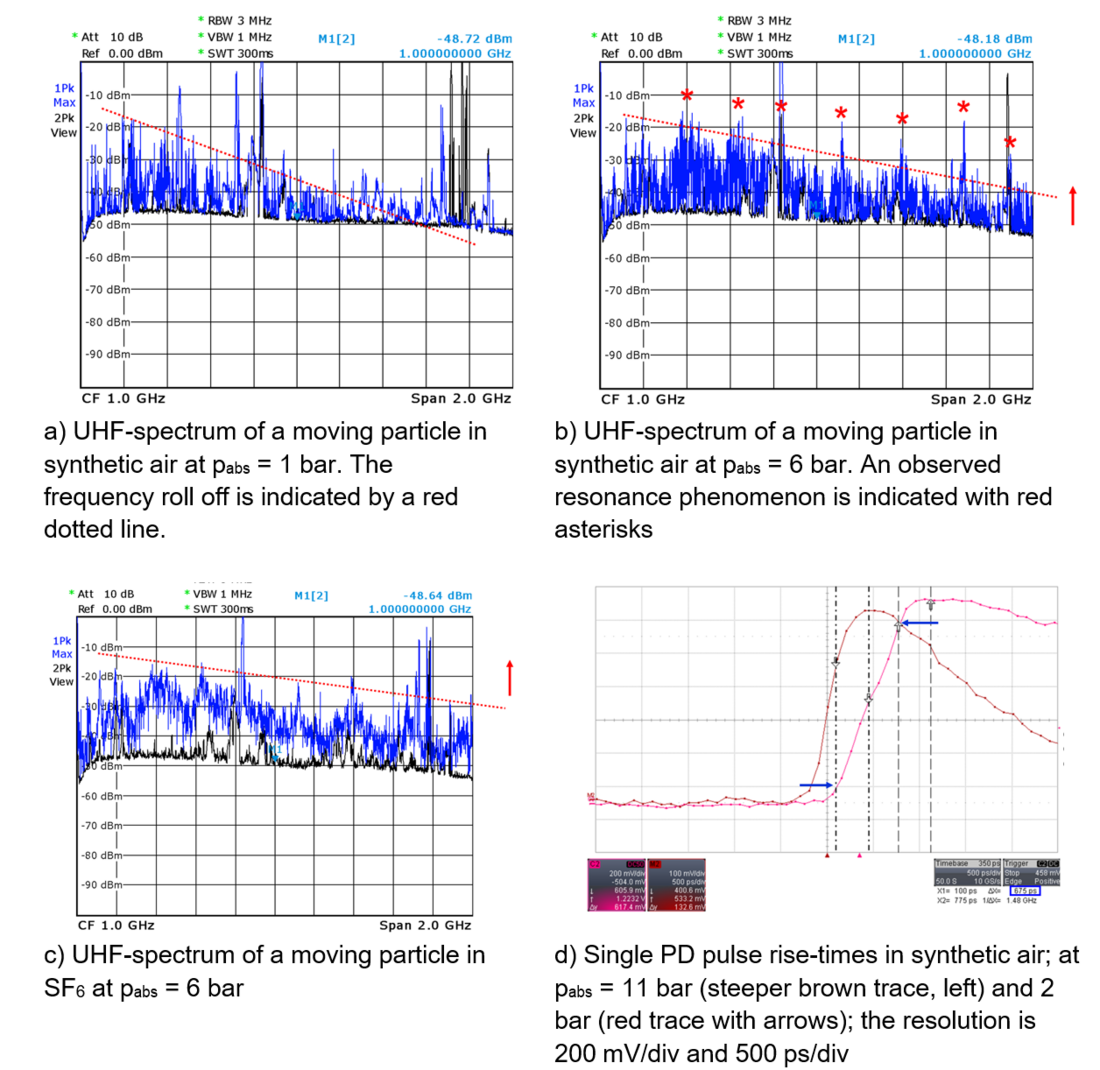
Figure 12: UHF-spectrum and single PD pulses of a moving particle in synthetic air and SF6
Naturally, GIS OEMs and utilities will want to continue using the RF diagnostic techniques developed over 40 plus years with SF6 [3, 4, 14-16, 18], however, there are two key factors which will determine whether those techniques – which include things like OEM-proprietary design rules for placing of internal UHF PD sensors in GIS – can remain more or less unchanged, or will require adaption to the new gases. These are: besides the obvious roll-off of the UHF spectrum at lower pressures, does the UHF signal behavior of typical GIS defects differ between gases? – and perhaps more importantly, does the relative RF ‘output power’ differ between gases, given the same defect producing the same charge (e.g. in pC, according to IEC 60270).
Such questions have already been examined for SF6 [20], but we need to ascertain if the assumptions made for SF6 over the past decades are valid for the alternative gas-mixtures.
As already mentioned, the unshielded UHF measurements carried out so far were compromised by very high background interference, thus preventing observation of subtle differences between gases, especially for particles on insulator surfaces, which generate very low signal levels. Due to the wide variations in RF frequency responses which will invariably occur between different laboratory set-ups, a standardized approach for measuring ‘relative RF output power’ is proposed: each laboratory looks for discrete frequency bands across the RF spectrum which are devoid of background interference. Starting somewhere at the low end of the UHF spectrum, for example 300-400 MHz, several bands are selected as multiples of the first channel frequency, as shown in Figure 13, then fixed and never moved. Each time a UHF power-level measurement was taken, the spectrum analyzer was set to zero-span mode and the PD spectrum acquired for a long time, say 10-20 minutes. Eventually the PD pulses will sum up to a relatively stable level (it would take much longer to form a perfect line…). Figure 13b) shows two such zero-span power level measurements acquired at 1600 MHz for the same 20 pC hopping particle in two different gases (synthetic air & a C4-FN-gas mixture) a pressure of pabs = 4 bar. (The noise floor is not visible, being a ‘MAX HOLD’ measurement and with the instrument settings used.) For this exemplary case, we concluded that the RF signal level produced by this defect (at the same charge level) is equivalent for these two gases. Also being considered is whether the frequency span should be widened (to e.g. 10-20 MHz) to avoid problems measuring right at the extremely sharp resonances typical of GIS.
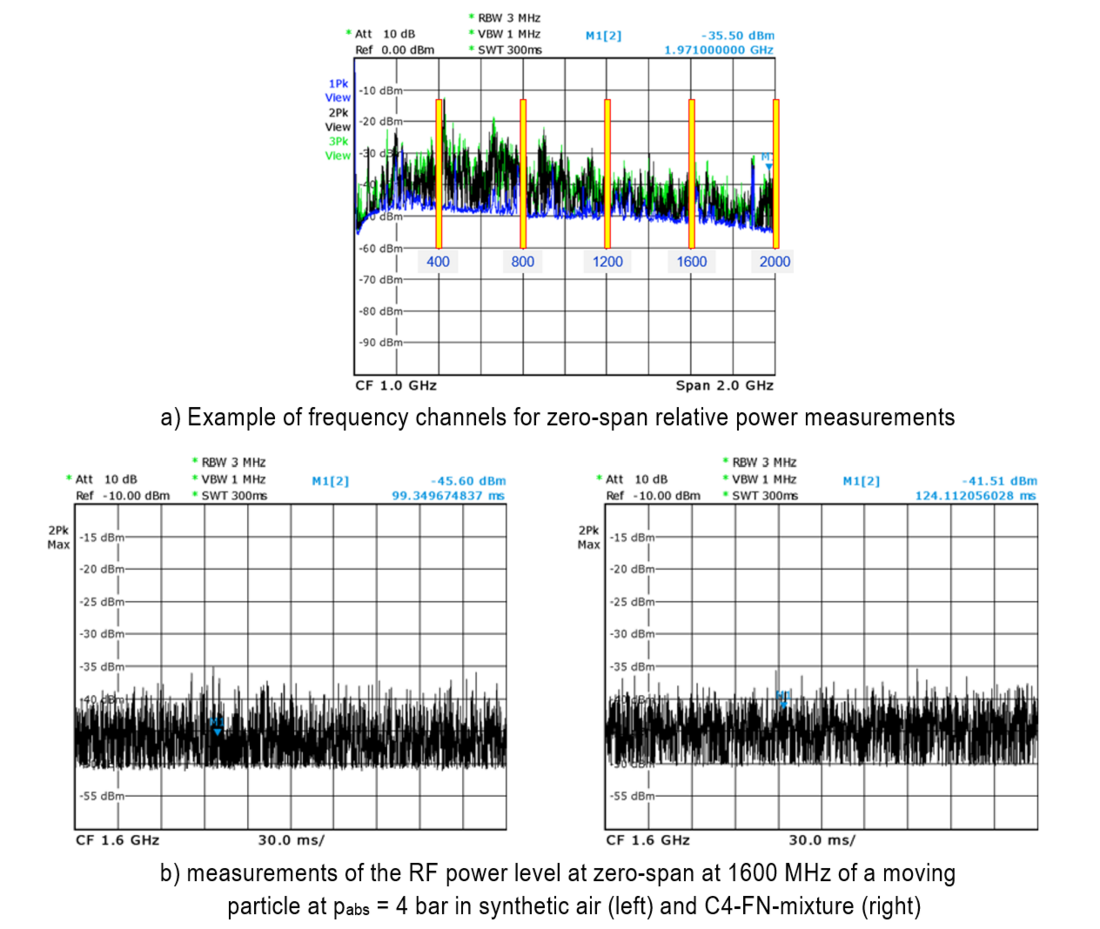
Figure 13 - Procedure to compare the relative RF output power of different gases
4. Discussion of experiment uncertainty and repeatability
In this Section, the parameters influencing the uncertainty of the round-robin test are being discussed based on the validation tests performed in Section 3. The different influencing factors on the experiment can be summed quadratically as described in the “Guide to the expression of uncertainty in measurement” [21]. For all factors a Gaussian normal distribution was assumed and a factor k=2 was chosen. The quadratic sum of the values in Table 1 results in an uncertainty 2σ of the breakdown value of ±2 kV and of the PD-inception voltage of ±1.6 kV.
| Influencing parameter | Uncertainty contribution to the breakdown voltage (±2σ) | Uncertainty contribution to the PD-inception voltage (±2σ) | Effect on PD-pattern (an uncertainty is not clearly defined for PD-patterns) | Performed procedure to determine uncertainty |
| Uncertainty of needle-plane distance due to movement of electrodes under pressure | < 0.04 kV | < 0.02 kV | negligible | As shown in T2, the plate movement at prel = 15 bar is 0.012 mm. The effect was proportionally estimated from the difference in breakdown and PD-inception voltage between a 3 mm and a 5 mm needle (worst case estimation bases on 10 breakdown values per pressure in pressure range 1-11 bar). |
| Uncertainty of needle-plane distance due to assembly | a) < 0.035 kV b) < 0.35 kV | a) 0.015 kV b) 0.15 kV | negligible | a) With positioning tool 0.01 mm b) Without caliper with 0.01 mm scale worst case estimation of 0.1 mm uncertainty The effect was determined in T3 and proportionally estimated from the difference in breakdown and PD-inception voltage between a 3 mm and a 5 mm needle. The larger value b) will be used in the uncertainty calculation. |
| Uncertainty of needle positioning | a) < 0.035 kV b) < 0.35 kV | a) 0.015 kV b) 0.15 kV | negligible | |
| Uncertainty of gas pressure | < 0.145 kV | < 0.026 kV | negligible | The gas pressure was measured with a Leo 5 absolute pressure gauge with an uncertainty of ± 8.5mbar. The uncertainty was proportionally calculated from the difference in breakdown and PD-inception voltage when changing the gas pressure between 1 and 10 bar in steps of 1 bar. A worst-case estimation was performed based on T8. The change of test pressure during the test is negligible as shown in T4. |
| Uncertainty of voltage | < 0.6 kV (1% of applied voltage) | < 0.3 kV (1% of applied voltage) | negligible effect | Divider radio determined with an uncertainty of ± 1 % before the test (see T5) Absolute values calculated based on highest voltages in T8. |
| Effect of total harmonic distortion of voltage waveform | negligible | < 0.3 kV (estimation <1% of voltage) | potential widening of the PD-pattern in phase angle | All values were measured as values. A THD of <5% resulted for the reported measurements (see T6). Absolute values calculated based on highest voltages in T8. |
| Effect due to physical statistics of at repetitive measurements | 2 kV An ignition delay would be detectable by a larger stray band in inception voltage. | 2 kV An ignition delay would be detectable by a larger stray band in inception voltage. | An ignition delay would be detectable by seeing a higher pulse rate at PD-inception. | Physical effects such as the lack of a start electron in combination with a rising voltage slope can lead to a stray band in breakdown and inception voltage. A typical variation of ±1 kV was determined in T8. The voltage was increased manually with a speed of approximately 0.1 kV/s. Stable breakdown voltages and PD-inception voltages were measured. No significant difference was observed when increasing the speed to 0.5 kV/s. |
| Uncertainty due to needle degradation | negligible The breakdown voltage is quite independent of the tip radius. The needle was not exchanged after a breakdown. | < 0.5 kV Depends on PD-duration and PD-amplitude. (May increase to 2-3 kV uncertainty in case of substantial needle change.) The PD-energy on the needle was limited in time and duration. The needle must be exchanged after a potential breakdown. | No change of PD-pattern in time was observed during the tests. The needle must be exchanged after a potential breakdown. | The effect of a needle tip variation between 20 and 200 µm was shown in T9. The real needle degradation was shown in T7. |
| Gas exchange | negligible | negligible | negligible | The test object was disassembled and cleaned with isopropanol before a change of gas. For SF6, a separate metal bellows hose was used. |
| Mixing ratio | negligible | negligible | negligible | Premixed gas with certified uncertainty was used and the mixing ration checked before the experiments. |
5. Conclusion
The CIGRE D1.78 working group designed and built a test cell and showed that reproducible PD and breakdown experiments with a measurement uncertainty of approximately ±2 kV are possible within it. The intended variability of needle length, gap-distance, and rapid changing of gas-type and gas pressure between pabs =1 and 11 bar was successfully demonstrated and experimentally shown.
This paper gives guidance on practical aspects, how charge-based PD-measurement, UHF PD-measurement, and direct measurement of discharge pulses on a galvanically insulated protrusion should be performed to achieve reproducible and reliable results. It shows how the results can be displayed, and gives an example for each type of measurement.
The working group is making the drawings of the test setup freely accessible to the wider high-voltage insulating gas community. Thereby, the group intends to motivate other research institutions to contribute to the round-robin test now, or at a later time, and to investigate additional gas-mixtures under standardized conditions. The mechanical construction drawings of the test cell can be obtained under the following link.
The test cell is a key tool for the D1.78 round-robin tests, serving as a reference for PD testing of defects in the exact same configuration, allowing rapid changes between different gases and different pressures; it also allows groups without access to real GIS or voltage sources above 100 kV to participate in testing. Comparing results from other laboratories participating in the round-robin tests on real GIS will establish the applicability of the findings from the test-cell, by showing which parameters need adaptation or adjustment. In this way, we see it eventually being established as a quasi-standard test environment for future research on PD behavior of different gases. We hope that with the development of the test cell and the extensive validation work performed during the pre-testing phase work done by CIGRE WG D1.78, other laboratories will be motivated to:
- reproduce the results of CIGRE WG D1.78,
- test additional gases and gas mixtures under identical conditions as used in CIGRE WG D1.78,
- use the test cell for a direct comparison of different PD measurement technologies such as charge-based, VHF/UHF, optical, and acoustic techniques,
- use the test cell for a direct comparison of the sensitivity of different PD measurement systems and/or UHF sensors from different suppliers,
- use the cell to investigate further defect types that were not possible to investigate within CIGRE WG D1.78.
References
- CIGRE TOR, WG N° D1.78, Partial discharge properties of non-SF6 insulating gases and gas mixtures January 6th, 2023 [online]
- IEC 60270:2025 ed 4, High-voltage test techniques – Charge-based measurement of partial discharges, 2025-06-05, ISBN number 9782832703984
- IEC TS 62478, 'High voltage test techniques - Measurement of partial discharges by electromagnetic and acoustic methods', ed. 1, 2016
- CIGRE TB 662 (WG 1.37), Guidelines for PD Detection using Conventional and Unconventional Methods (chapter 2), Aug 2016.
- UHF partial discharge detection system for GIS: Application guide for sensitivity verification, CIGRE Technical Brochure 654, WG D1.25, 2016
- Dry air, N2, CO2, and N2/SF6 mixtures for gas-insulated systems, CIGRE Technical Brochure 730, WG D1.51, 2018
- Electric performance of new non- SF6 gases and gas mixtures for gas-insulated systems, CIGRE Technical Brochure 849, WG D1.67, 2021
- Return of experience: The CIGRE UHF PD sensitivity verification and on-site detection of critical defects, S. M. Neuhold, T. Brügger, R. Bräunlich, G. Behrmann, H. D. Schlemper, U. Riechert, P. Müller, M. Lehner, E. Schneiter, P. Siegrist, D1-304, Ref D1-304_2018, CIGRE Paris 2018
- Zur Isolierfestigkeit von Schwefelhexafluorid (SF6) bei Wechselspannung variabler Frequenz (30 bis 200 Hz), Matthias Zwicky, Dissertation ETH Zürich Nr. 8148; 1986
- Breakdown and Partial Discharge with Fixed Metallic Protrusions in SF6 Alternative Gases, Austin Eichelberg, Devayan Basu and Christian Franck, 2025 [online]
- UHF Partial Discharge Detection System for GIS: Application Guide for Sensitivity Verification, CIGRE Technical Brochure 654, CIGRE WG D1.25, 2016
- A. J. Reid, M. D. Judd, Ultra-wide bandwidth measurement of partial discharge current pulses in SF6, Journal of Physics D: Applied Physics 45, April 2012.
- B. F. Hampton, R. J. Meats, Diagnostic measurements at UHF in gas insulated substations, IEE Proc, Vol. 135, Pt C, No. 2, March 1988
- S.A. Boggs, G.L. Ford, F.Y. Chu, Partial Discharge Location in Gas-insulated Switchgear, Gaseous Dielectrics II: Proc. 2nd Int’l. Symp. on Gaseous Dielectrics, Knoxville, Tennessee, U.S.A., March 9–13, 1980, pp. 358-366
- S. A. Boggs, Electromagnetic Techniques for Fault and Partial Discharge Location in Gas-Insulated Cables and substations, IEEE Trans. on Power Apparatus and Systems, vol. PAS-101, no. 7, pp. 1935-1941, July 1982.
- R. Baumgartner, B. Fruth, W. Lanz, K. Pettersson; Partial Discharge Part X: PD in Gas-Insulated Substations – Measurement and Practical Considerations, IEEE Electrical lnsulation Magazine, Vol.8, No 1, Jan/Feb 1992, pp. 16-27.
- J. Pearson, 0. Farish, B. Hampton, M. Judd, D. Templeton, B. Pryor and I. Welch, “Partial Discharge Diagnostics for Gas Insulated Substations,” IEEE Trans DEI, vol. 2 No. 5, 1995.
- CIGRE D1.66, TB 933: Requirements and application of UHF PD monitoring systems for gas insulated systems, CIGRE, Paris, 2024
I. Herbst, R.Pietsch, The Fast and Slow Signal Components of Partial Discharges in SF6 Measurements of the Electron and Ion Contributions to PD-Signal, Conf. Record, 1994 IEEE International Symposium on Electrical Insulation, Pittsburgh, US, 5-8 June 1994, pp. 283-287.
- B.G. Stewart, M.D. Judd, A.J. Reid, R.A. Fouracre, ‘Suggestions to augment the IEC 60270 partial discharge standard in relation to radiated electromagnetic energy’, IEEE Electrical Insulation Conference, IEEE, Nov 2007
- Guide to the expression of uncertainty in measurement — Part 1: Introduction, JCGM GUM-1:2023 [online]