Power utility perspective on composite insulator condition and end-of-life assessment – Part 2
Authors
F. JOOSTE, R. DAVEY, D. MVAYO - Research Testing and Development, Eskom Holdings SOC Ltd, Cape Town, South Africa
W. VOSLOO - Retired

Summary
Composite insulators may be subjected to various harmful environmental conditions, such as high levels of pollution (marine, industrial and sugar cane), recurrent wetting cycles and ultraviolet exposure, to name a few. Early detection of damage or material degradation on composite insulators is critical, as it could ultimately lead to failure, including outages or even loss of life. Utilities are faced with the challenge of finding a proactive and objective approach to determine the condition and life expectancy of in-service composite insulators. Composite insulator condition and end-of-life assessment is a complex task that requires a multi-faceted approach and cannot be achieved through general observations of these insulators.
Part 1 of this two-part paper reviewed high-voltage outdoor composite insulator condition assessment practices, its operational lifespan and service experience, including the selection approaches when used in polluted environments.
Part 2 utilises the above to define two in-service composite insulator end-of-life assessment approaches, a comprehensive and a practical approach, which have both been defined based on the end-of-life criteria, namely mechanical, electrical and loss of pollution performance.
Keywords
Composite insulator, condition assessment, end-of-life, lifespan, pollution, pollution performance curves1. Introduction
A power system's reliability can be greatly influenced by the performance of the high-voltage insulators used. International experience shows that the expected lifespan of composite insulators varies considerably, ranging from 4 to over 30 years [1], [2], [3], [4], with the practical expected lifespan ranging from 20 to 25 years [5], [6], [7].
The literature demonstrates that composite insulator lifespan is not limited to insulation failures due to pollution or by means of degradation caused by tracking and erosion, but its long-term in-service performance is dependent on the overall and local electrical stress exposure whose value, duration and position depend on the pollution level, wetting (cycles), hydrophobicity loss and recovery, including the insulator profile [8].
Local and international experience shows that insulator failure rates correlate well with the fluctuation of environmental/climatic conditions, with good service experience achieved when the design parameters exceed the operating condition requirements [5]. Furthermore, once an insulator experiences material degradation that affects its profile, such an insulator would suffer accelerated degradation, leading to failure [9], [10].
Utilities are faced with the challenge of finding a proactive and objective approach to determine the condition and life expectancy of in-service composite insulators. Traditionally, insulator field failures are investigated in a retroactive manner, and only then can appropriate actions, such as replacement, be taken.
Composite insulator condition and end-of-life assessment is a complex task which cannot be achieved through general external observations alone, as some failure modes in various stages of progression may not be apparent on the outside of the insulator [11], [12], [13].
This paper aims to provide a comprehensive and a practical method for conducting condition and end-of-life assessments of composite insulators, which have both been defined based on the end-of-life criteria, namely, mechanical, electrical and loss of pollution performance.
This challenge is approached by exploring the use of the statistical method for insulator selection and dimensioning to estimate the material condition and service life expectancy and combining it with established high-voltage outdoor composite insulator condition assessment practices as reviewed in Part 1 of this paper.
2. Composite insulator selection for pre-determined lifespan
The statistical approach for insulator selection and dimensioning is normally applied to new designs. The mean time between flashover (MTBF) is calculated during the selection and dimensioning of new insulators to satisfy a predetermined acceptable pollution performance.
This technique can also be applied periodically to in-service insulators, where the pollution performance curves (PPC) of field-aged insulators can be compared to the curves of identical new insulators, allowing for the tracking of deterioration in insulator pollution performance. This comparison can also be used to estimate the material condition and service life expectancy.
2.1. MTBF
IEC/TS 60815-1 Annex G [14] describes the statistical approach for the dimensioning of insulators for polluted conditions as shown in Figure 1. The insulator creepage distance is selected, with respect to operational and environmental stresses, to fulfil the performance requirement. The MTBF can be determined by evaluating the insulator risk of flashover.
Two distributions are required to determine the insulator’s risk for flashover, namely the cumulative distribution function that describes the insulator's dielectric strength and the probability density function that describes the site pollution severity. The product of these distributions results in the risk for flashover during a single pollution event. A pollution event, also called a critical wetting event, is a condition where the polluted layer on an energised insulator is wetted to provide a non-zero probability for flashover.
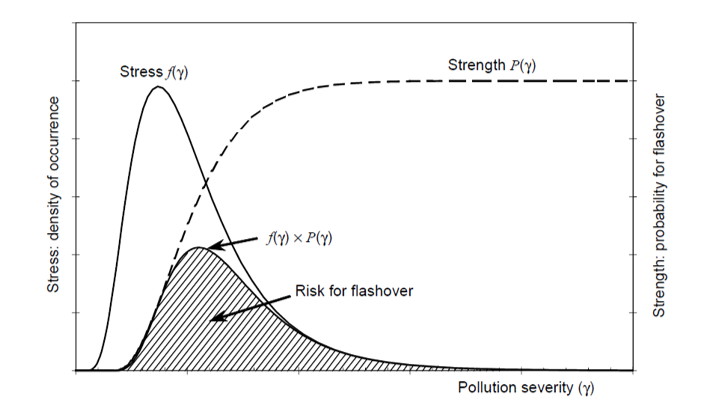
Figure 1 - Statistical approach to obtain insulator risk for flashover [14]
The statistical distribution of the pollution stress is normally obtained by equivalent salt deposit density (ESDD) measurements, as highlighted by [15]. Further, the pollution flashover performance of the insulator is obtained through artificial pollution laboratory testing. These tests provide the insulator flashover parameters required for the function that describes the dielectric strength.
The pollution stress curve can also be obtained from leakage current measurements obtained from natural pollution tests performed on insulators as shown by [16], [17], [18]. The dielectric strength curve can be calculated when performing natural pollution insulator testing.
Once the parameters above have been determined, commercially available software can perform the risk for flashover analysis. This software can also optimise the required insulator length for a specific environment and selected MTBF.
2.2. Requirements to determine MTBF
Composite insulator pollution performance can be assessed by means of artificial pollution tests which are representative of the in-service conditions [19]. This follows the same approach to that of glass and porcelain insulators. However, insulators with hydrophobic transfer properties (made from hydrophobicity transfer materials) require assessment under both hydrophobic and hydrophilic states, as shown in Figure 2.
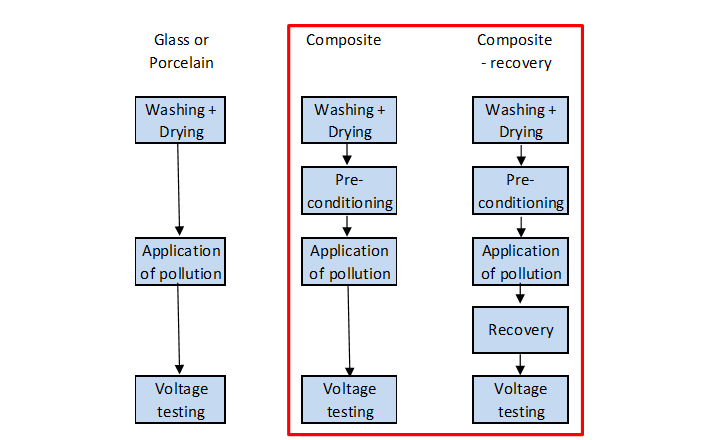
Figure 2 - Artificial pollution test method [19]
A standardised artificial pollution test method must be [19]:
- Representative of service conditions.
- Repeatable during the laboratory tests.
- Reproducible at different laboratories.
- Cost effective.
The artificial pollution test selected should also quantify the influence of hydrophobicity and the effect of ageing.
A clean fog flashover test is to be used as a basis for pollution performance using the pollution performance curve technique [19], [20], as follows:
- The clean fog flashover test is performed to obtain the U50 flashover value with a pre-determined pre-deposit pollution to represent a specific site pollution severity (Figure 3).
- By performing the clean fog flashover test at three pollution levels (points A, B and C), a “Pollution Performance Curve” can be developed, which can be used to characterise the insulator performance at any pollution level (see Figure 4 for typical 132 kV composite long rod application).
- For insulators made from hydrophobicity transfer materials (HTM), the U50 determined at the three pollution severity levels with and without hydrophobicity recovery (Figure 4).
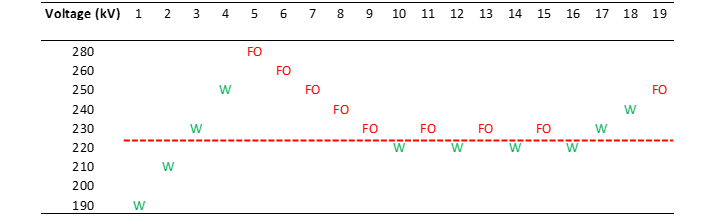
Figure 3 - Example of clean fog flashover test method to determine the U50
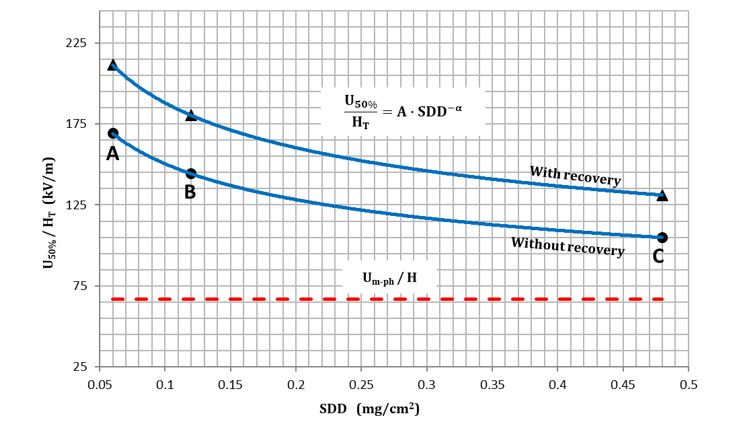
Figure 4 - Pollution performance curves for HTM materials U50%
The pre-deposit levels for A, B and C (see Figure 4) have been selected to represent the spread of pollution severity across the South African environment. Two curves are necessary to characterise insulators with HTM properties, e.g. silicone rubber.
The selected pre-deposit levels coincide with the following pollution levels:
- A – Light to Medium (SDD = 0.06 mg/cm2).
- B – Medium to Heavy (SDD = 0.12 mg/cm2).
- C – Heavy to Very heavy (SDD = 0.48 mg/cm2).
To determine insulator pollution performance, conditions for artificial tests must be specified that represent in-service conditions. In this case, the values for the NSDD, shown in Figure 5, and salt deposit density (SDD), shown in Figure 6, are selected based on IEC/TS 60815-1 [14], including pollution measurements done at KIPTS and across the South African power network.
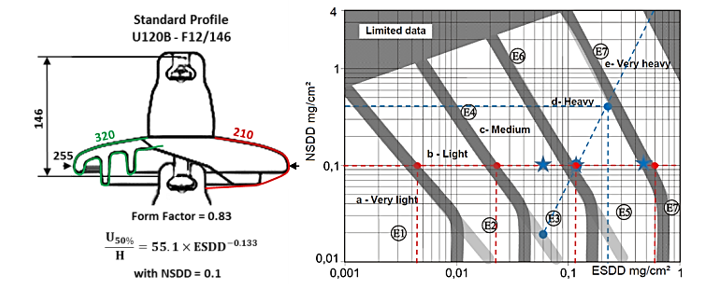
Figure 5 - NSDD selection for artificial pollution tests
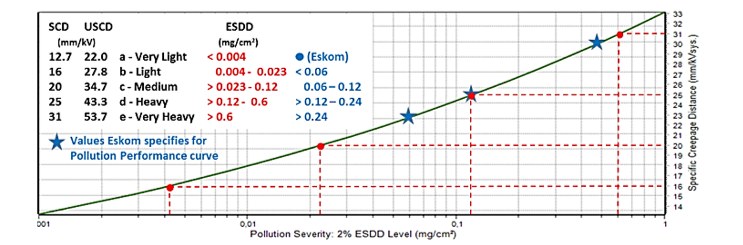
Figure 6 - SDD determination for artificial pollution tests
Applications for PPCs include the following:
- Approve new insulator/insulation products.
- Select and dimension new insulator/insulation products for a specific pollution environment using the statistical method described in IEC/TS 60815-1 Annex G [14] with an acceptable risk of flashover.
- Evaluate an aged in-service insulator to objectively monitor its pollution performance condition and remaining life expectancy.
- Investigate an insulator field failure from a pollution performance perspective.
2.3. Practical example of MTBF for various insulators
A comparison of the pollution performance of a glass disc insulator and two different SR long rod insulators is shown in Table 1 and Table 2. For the SR insulators, the MTBF was determined with and without (worst case) hydrophobicity recovery. The comparison is made at four different levels of ESDD and for a SCD of 20 mm/kV (Table 1) and 31 mm/kV (Table 2) respectively. The MTBF was calculated for a single insulator, which could represent a scenario of a natural pollution test or a single insulator on an overhead line. A scenario representing a line with 1200 insulators exposed to the same pollution conditions at high altitude (1000 m above sea level) is also shown in Table 1 and Table 2.
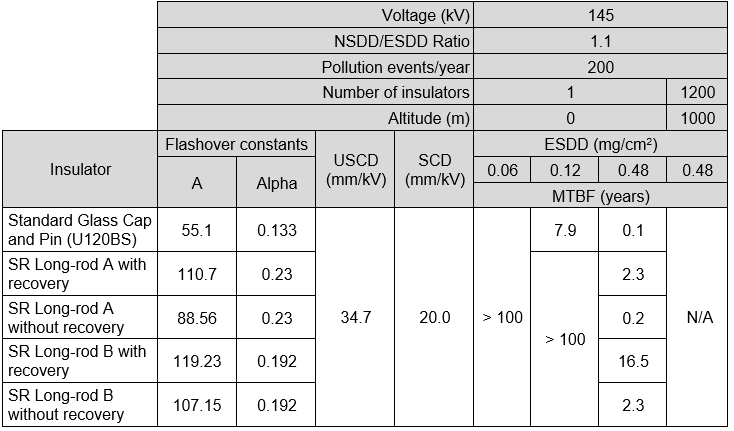
Table 1 - MTBF comparison between glass and SR long-rod insulators (20 mm/kV)
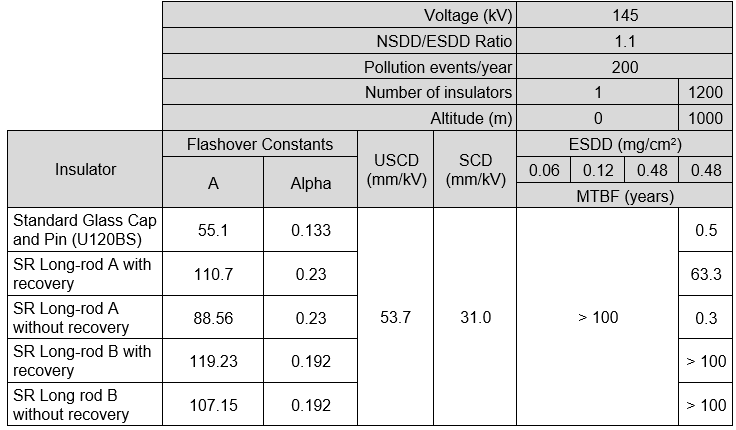
Table 2 - MTBF comparison between glass and SR long-rod insulators (31 mm/kV)
It is shown that for a single insulator, the performance of the SR insulators is slightly better than the glass disc insulator without hydrophobicity recovery. For multiple insulators, the pollution performance of the SR insulators with recovery is far superior compared to the glass disc insulator. It is noted that when hydrophobicity is lost, the glass disc insulator performs slightly better than the SR long rod “A” insulator, due to its specific design and geometry related parameters.
The tabled results are used to highlight the difference between the performance of hydrophilic and hydrophobic insulators. It also shows the difference between long-rod insulators from different manufacturers (insulator “A” and “B”).
Considering the insulator pollution performance of an overhead line from a statistical perspective, if the number of pollution-related flashovers on composite insulators from the same manufacturer results in an MTBF lower than the accepted design limit and approaches that of an unacceptable pollution flashover performance expected from an equivalent (same SCD) standard glass cap and pin disc string insulator, it is assumed that the composite insulator has reached its end-of-life from a pollution performance perspective. This is illustrated by way of two examples.
Example 1
In some cases the pollution performance is worse than expected from SR long rod A as the pollution performance without recovery approaches that of a comparative standard glass cap and pin design (see Table 1 for number of insulators – 1200). However, taking the MTBF for SR long rod A with recovery into account, it can be deduced that it was not an optimal solution for the application as even the pollution performance with recovery is not significantly better than the comparative glass cap and pin insulator. In this case, SR long rod B would have been a better choice for the application.
Example 2
SR long rod A without recovery performs worse than the standard glass cap and pin disc insulator, but SR long rod B without recovery still performs better (see Table 2 for number of insulators - 1200). This means that from a pollution performance perspective, when SR long rod A loses its hydrophobicity properties due to in-service ageing, it will perform worse than SR B and even a comparative glass cap and pin insulator.
The objective approach above to determine a composite insulator’s end-of-life from a pollution flashover performance perspective focuses on pollution-related flashover performance. After removal of the insulators, further tests need to be performed to obtain more detailed information on why the insulators suffered a loss of performance or reached end-of-life. The above approach requires a utility to keep detailed records of insulator flashover performance and the cause thereof.
3. Composite insulator end-of-life
Composite insulators perform well in service when the design parameters exceed the operating condition requirements [5], [9]. South African experience gathered through insulator field failure investigations and KIPTS research projects has highlighted that certain defects and ageing modes of sub-transmission composite insulators will result in either electrical or mechanical failure [9].
Generally, composite insulators are selected for an application due to their enhanced pollution performance when compared to a glass cap and pin disc string insulator with an equivalent specific creepage distance. Thus, any material degradation which results in a loss of insulator pollution performance may trigger an investigation into whether the insulator has reached its end-of-life from a pollution performance perspective.

3.1. Defining composite insulator end-of-life
Combining international knowledge and South African experience, composite insulator end-of-life can be defined by means of one or a combination of the following three conditions:
- Mechanical failure:
- The fibre reinforced rod is fractured.
- End-fitting breakages.
- Brittle fracture.
- Rod radial fracture due to mechanical twisting.
- Poor crimping technique resulting in end-fitting pull-out.
- Grease leakage has occurred from the sealed end-fittings or shed interfaces with the rod.
- The fibreglass core is exposed.
- The insulator housing is split.
- Electrical failure:
- Flash-under.
- Tracking resulting in the insulator not being able to handle operational voltage.
- The insulating material is punctured.
- Burning has occurred on the insulator body (e.g. due to veld fires or power arcs), this excludes burn/flash marks on end-fitting metalware.
- There is evidence of tracking.
- Material erosion is present to a depth of greater than 0.5 mm.
- Severe loss in pollution performance requirements:
- Roughening of the surface increases the aerodynamic catch of pollutants.
- A severe reduction in hydrophobicity that results in increased leakage current activity, leading to pollution flashover.
- When the number of pollution-related flashovers results in an MTBF lower than the accepted design limit and approaches that of an unacceptable pollution flashover performance expected for that of an equivalent (same SCD) standard glass cap and pin disc string insulator.
Considering the three end-of-life determining failure modes, mechanical and electrical failures are often easier to identify than a loss in pollution performance.
Many mechanical and electrical failures are usually evident and identifiable through in-service visual inspections, with a few requiring detailed inspections and dissection. On the contrary, a severe loss in pollution performance requires either routine laboratory testing by means of clean fog flashover tests or by means of comprehensive line performance data capturing.
The disadvantage of accredited laboratory testing is that it is expensive and not easily accessible, particularly when considering a large-scale testing regime.
3.2. End-of-life assessment approach
Considering the international and local experience regarding insulator condition assessment and the work presented in Section 2, with particular reference to the examples in Section 2.3, two in-service composite insulator end-of-life assessment approaches are defined, namely a comprehensive periodic approach and a more practical and financially conscious approach.
The comprehensive approach includes the following:
- New composite insulator: establish reference fingerprints (laboratory tests) as per [21] and obtain the pollution performance curve with and without hydrophobicity recovery as per [19] and [22] using the three pollution levels specified in Section 2.2.
- Aged in-service composite insulator (if a new composite insulator is not available): establish reference fingerprints (laboratory tests) as per [21], obtain the pollution performance curve with and without hydrophobicity recovery (if possible) as per [19] and [22] using the three pollution levels specified in Section 2.2 and perform detailed inspections as per [12] to determine the current condition of the composite insulator from a mechanical, electrical and pollution performance perspective.
- Every five years, one aged in-service composite insulator should be removed from service to determine its current condition (detailed inspections as per [12], pollution performance curve as per [19] and [22], and fingerprint as per [21]) in relation to either a new (same manufacturing batch) or aged reference and previously removed aged units that were tested.
- Monitor time of day line faults for possible insulator pollution flashovers (as per Chapter 11 of [11]).
- Perform a detailed, non-intrusive visual inspection (as per Chapter 11 of [11]) as a precaution for possible insulator ageing or failure during routine line inspections.
- Determine the pollution performance threshold (see red line Figure 4) of the composite insulator as per the application (as per Section 2.2).
- Compare the pollution performance curve of the aged unit to the pollution performance threshold of the application to determine if the end-of-life has been reached from a pollution performance perspective (as per Section 2.2).
- End-of-life from a pollution performance perspective: the insulator pollution performance curve is lower than the pollution performance threshold.
Taking costs and operational practicalities into consideration, a more practicable approach involves:
- Precautionary periodic detailed non-intrusive visual inspections, including UV and IR scanning (as per Chapter 11 of [11]) could identify potential insulator ageing or failure mechanisms during line inspections.
- Monitor in-service hydrophobicity properties within an hour after de-energisation of the insulator to prevent any possible hydrophobicity recovery as per [23], to identify insulators approaching higher risk from a pollution flashover performance perspective.
- Remove one aged in-service composite insulator from high-risk areas to perform detailed inspections as per [10], to determine its current condition and whether it is approaching end-of-life from a mechanical and electrical perspective.
- Monitor time of day line faults for possible insulator pollution flashovers (as per Chapter 11 of [11]).
- Combining the detailed line pollution flashover performance records with area specific site pollution severity data, a comparison can then be drawn between the annual flashover rate of the in-service composite insulator and the MTBF of a comparative glass cap and pin insulator for similar conditions and application as the pollution performance curve for standard glass cap and pin insulators are readily available.
- End-of-life from a pollution performance perspective: when the MTBF obtained from in-service flashover performance records of the composite insulator is lower than the accepted design limit and approaches that of the simulated MTBF of the glass cap and pin insulator.
Both approaches require a combination of periodic visual inspections, some form of physical insulator testing or assessment and credible in-service insulator flashover data due to the intrinsic nature of what constitutes end-of-life for these types of insulators.
Due to the potentially large number of sub-transmission lines which will require a sizeable financial investment and availability of appropriately trained manpower, it is proposed that a sampling and testing regime focuses on:
- Composite insulators from known problematic areas.
- Composite insulators aged 10 years and older in known problematic areas, to identify potential failure modes in the early stages of development (recommendation based on [1], [2], [3], [4], [5], [6], and [7]).
- Existing non-problematic lines with composite insulators in known problematic areas older than 20 years, to determine the effective residual lifespan (ERL) mainly for refurbishment purposes and end-of-life failure modes (recommendation based on [1], [2], [3], [4], [5], [6], and [7]).
The last two recommendations should ideally be carried out on all composite insulators at the recommended ages above.
4. Pollution and climatic factor maps
As stated in the previous section, one of the requirements for comparing the MTBF values using the practical and financial cognizant approach is to utilise area-specific site pollution severity data or knowledge to simulate how a comparative glass cap and pin insulator would perform as compared to the in-service aged composite insulator under investigation.
Site pollution severity can be determined in two ways:
- For a general idea of the site pollution severity, a pollution map similar to that illustrated in
- Figure 7 can be used [24]. However, this map does not override localised knowledge of prevailing pollution sources and conditions.
- Conduct on-site pollution measurements to determine site pollution severity (SPS) class as per IEC/TS 60815-1 (minimum 12-month cycle) [14], [25].
It must also be appreciated that, in addition to the amount, type and conductivity of the pollutants present, the climate has a significant impact on insulator performance. Regarding climatic influences, the amount of wetting by mist and fog, as well as washing by rain, is the most important. A “Climatic Factor” map, Cf, developed from meteorological data, is to be applied to the pollution severity as measured by the dust gauge, to yield a more accurate assessment of the probability of pollution flashover. See Figure 8 for the South African “Climatic Factor” map developed from 5 years of meteorological data by the South African Weather Bureau [25].
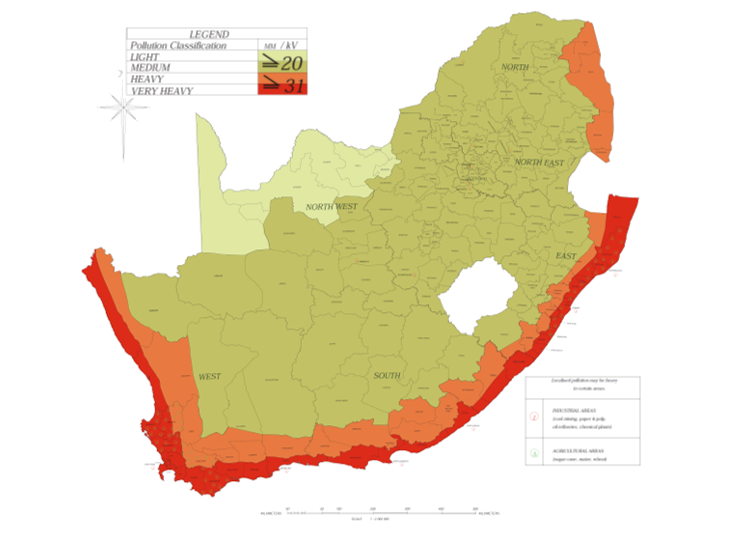
Figure 7 - Pollution level map for South Africa (2001) [24]
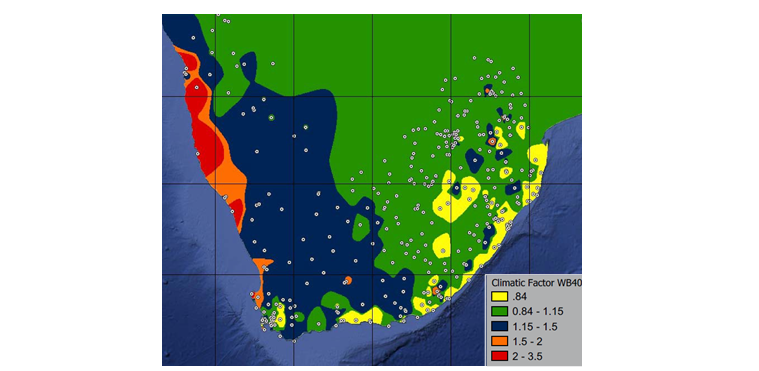
Figure 8 - Climatic factor map for South Africa (2021) [25]
5. Condition and end-of-life assessment procedure
Composite insulator condition and end-of-life assessment is a complex task that cannot be achieved solely through general observations of an insulator sample, because some failure modes in various stages of progression may not be apparent on the outside of the insulator. Condition and end-of-life assessment requires a multifaceted approach to determine the overall state of the insulator and whether it is still fit for purpose.
As indicated previously, composite insulator end-of-life can be defined by means of one or a combination of the following conditions (see Section 3.1):
- Mechanical failure.
- Electrical failure.
- Loss in pollution performance.
From the list above, severe mechanical failure is the most apparent, followed by some forms of electrical failure (i.e. flashunder). Loss of pollution performance cannot be determined by basic visual inspections alone.
The following procedure, which is based on the practical approach developed in Section 3.2 endeavours to present a practical guide in determining whether a composite insulator has reached the end of its useful service life from either a mechanical, electrical or pollution performance perspective, or any combination thereof, with the process flow chart shown in Figure 9.
The procedure involves the following high-level measures:
- Inspection and assessment triggers.
- On-site/in-service visual inspection and fault categorising and classification.
- On-site/in-service hydrophobicity assessment.
- Removal of samples from service.
- Shipping of samples for detailed inspection.
- Detailed visual inspection and dissection.
- Pollution performance assessment.
- Root cause analysis.
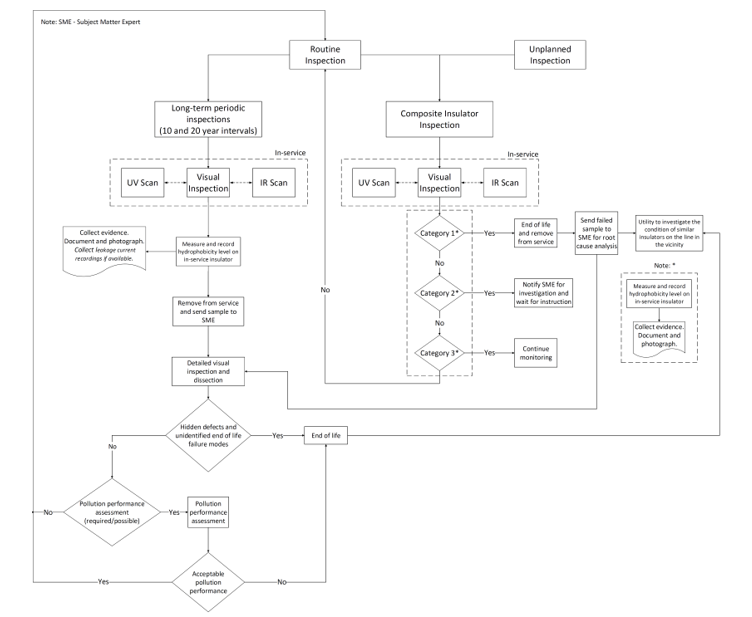
Figure 9 - Condition and end-of-life assessment procedure flow chart
The above composite insulator end-of-life assessment procedure is discussed in more detail below.
5.1. Composite insulator Inspection and assessment triggers
The composite insulator inspection refers to either the routine composite maintenance inspections or unplanned inspections triggered by one or more of the following criteria:
- Planned routine in-service visual inspection.
- Composite insulators aged 10 years and older to identify potential failure modes in the early stages of development (recommendation based on practical expected lifespan, see Introduction chapter, i.e. long-term periodic assessment).
- Existing non-problematic lines with composite insulators older than 20 years to determine ERL for refurbishment purposes (recommendation based on practical expected lifespan, see Introduction chapter, i.e. long-term periodic assessment).
- Unplanned inspection to identify possible failure modes on composite insulators.
- Poor-performing lines as a result of numerous faults.
- UV or IR scans identified a potential internal failure mode.
5.2. Preliminary in-service visual inspection after removal
Visually inspect and categorise composite insulators as follows:
5.2.1. Category 1
Category 1 failure modes which constitute immediate end-of-life for composite insulators:
- Grease leakage has occurred from the sealed end-fittings or shed interfaces with the rod.
- The insulating material is punctured.
- The fibreglass core is exposed.
- The insulator housing is split.
- The fibre reinforced rod is fractured.
- Burning has occurred on the insulator body (e.g. due to veld fires, flashover/flash-under power arcs), this excludes burn/flash marks on end-fitting metal ware.
- There is evidence of tracking.
- Material erosion is present to a depth greater than 0.5 mm.
- End-fitting breakages.
Composite insulators categorised as Category 1 must be removed from service and sent to the subject matter experts (SME) to determine the root cause of the failure mechanism. This includes the on-site collection of evidence and the documentation of hydrophobicity levels.
5.2.2. Category 2
Defects that would require further investigation as to why they occurred are classified as Category 2:
- Flash marks on the insulator surface (especially close to end-fitting seal area).
- Evidence of damage due to handling.
- Moulding defects in the polymer material.
- Bird damage resulting in profile change.
- Potential defects identified by means of UV and IR scans.
Measure and record on-site hydrophobicity level and all other evidence, then notify SME for further instruction for all insulators categorised as Category 2.
5.2.3. Category 3
Composite insulators showing signs of these defects require their condition and performance to be monitored annually while in service.
Category 3 defects are classified as follows:
- Chalking has occurred on the insulator surface.
- Discolouration of the insulating material has taken place due to the same mechanisms as chalking.
- There is crocodile skin effect/crazing on insulator surface.
- Fungal growth.
If the general, visual inspection did not categorise the insulator as having reached the end of its service life, continue with the procedure.
5.2.4. Long-term periodic inspections
These assessments follow similar a process to that of other routine or unplanned inspections which start off with UV/IR scans and on-stie visual inspections. However these inspections are carried out at 10- and 20-year intervals to determine the overall health of in-service insulators. Samples are sent to the SME for detailed visual inspections and dissection to identify hidden or other potential failure modes in the early stages of development.
5.3. On-site hydrophobicity assessment
Determine insulator hydrophobicity as per [23], [26], this includes documenting findings and photographs. Initial on-site hydrophobicity test is of importance as it gives an indication of the environmental and electrical stress the insulator is experiencing during service.
Composite insulators with HTM properties can recover some of their hydrophobicity when taken out of service, thus tests carried out after some time in transit can give a false indication of in-service hydrophobicity level and in turn the perceived pollution performance – hence the importance of immediate test when an insulator is taken out of service. Send documented photographs to the relevant SME for evaluation.
5.4. Removal of samples from service
Care should be taken not to damage insulators when removing insulator samples from service for inspection purposes. It is important to not clean insulators and disturb accumulated pollution when it is required to send them to the relevant subject matter experts for further investigation. A hydrophobicity measurement is allowed on a section of the insulator being inspected and should not be wiped dry afterwards.
5.5. Packaging and shipping samples for detailed inspection
Package samples neatly, as illustrated in Figure 10, Figure 11 and Figure 12, and send them to the SME for detailed inspection.
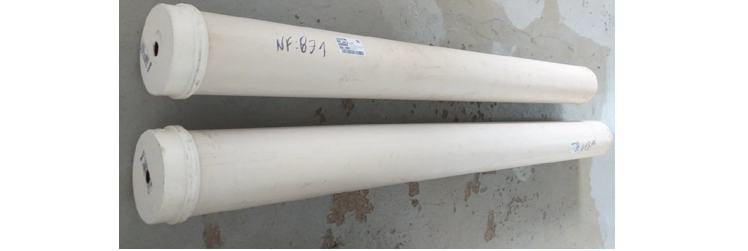
Figure 10 - Insulators stored in PVC pipes [5]
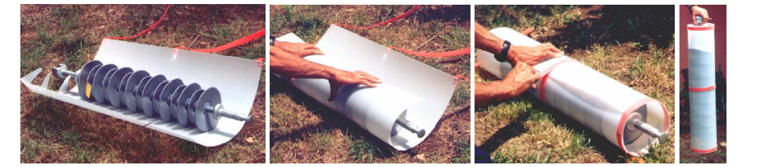
Figure 11 - Plastic protection device for insulator storage [11]
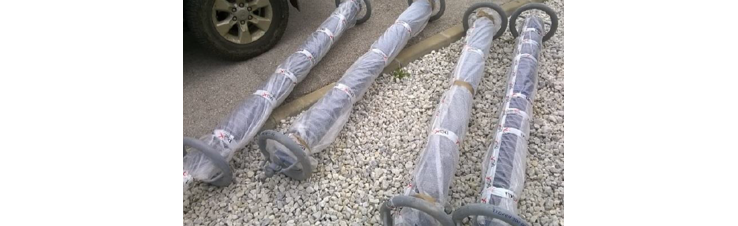
Figure 12 - Plastic sheet wrapped around insulators for storage or transportation [5]
5.6. Detailed visual inspection and dissection
Insulators are inspected and dissected by the SME in more detail, which includes:
- Detailed visual inspection.
- LESDD measurement.
- Hydrophobicity assessment.
- Insulator profile assessment.
- Sample dissection.
- Rod dye penetration tests.
The aim is to identify hidden defects which constitute end-of-life and unidentified Category 1 and Category 2 failure modes which could have been missed during the initial on-site inspection.
The hidden defects include:
- End-fitting seal failure resulting in moisture ingress.
- Rod radial fracture due to mechanical twisting.
- Brittle fractures.
- Insulator housing separation.
It is important to inform the utility to investigate the condition of similar insulators on the line in the vicinity if it is determined that the sample reached its end-of-life.
5.7. Pollution performance assessment
Assess insulator pollution performance by means of the following:
- Obtain area-specific site pollution severity data.
- Obtain available time of day line faults for possible insulator pollution flashovers.
- Combine detailed line pollution flashover performance records with area-specific site pollution severity data.
- Compare the annual flashover rate of the in-service composite insulators and the MTBF of a comparative glass cap and pin disc insulator for similar conditions and application.
End-of-life from a pollution performance perspective is reached when the MTBF obtained from in-service flashover performance records of the composite insulator is lower than the accepted design limit and approaches that of the simulated MTBF of the glass cap and pin disc insulator.
Inform the utility to investigate the condition of similar insulators on the line if it was determined that the sample reached its end-of-life from a pollution performance perspective.
5.8. Root cause analysis
Document and report findings of root causes related to the identified failure mode(s) and report findings to the relevant utility divisions for business integration.
6. Conclusions
Local and international experience shows that insulator failure rates correlate well with fluctuations in environmental or climatic conditions, and good service experience is achieved when the design parameters exceed the operating condition requirements. Furthermore, once an insulator experiences material degradation that affects its profile, such an insulator would suffer accelerated degradation, leading to failure.
Composite insulators have a practical expected service life that ranges between 15 and 25 years, with its long-term performance affected by multiple factors, such as electrical stress, pollution levels, material ageing, including environmental and climatic factors.
This two-part paper demonstrated that the condition and end-of-life assessment of in-service composite insulators requires a multi-faceted approach to determine the overall state of the insulator and whether it is still fit for purpose.
Two approaches to in-service composite insulator condition and end-of-life assessment were presented, namely a holistic and a practical approach. Both approaches require a combination of periodic visual inspections, some form of physical insulator testing or assessment, pollution performance assessment and credible in-service insulator flashover data due to the intrinsic nature of what constitutes end-of-life for these types of insulators.
End-of-life for either approach has been defined as one or a combination of the following conditions:
- Mechanical failure.
- Electrical failure.
- Loss in pollution performance requirements.
References
- L. Cheng, L. Wang and F. Zhang, “Aging characterization and lifespan prediction of silicone rubber material utilized for composite insulators in areas of atypical warmth and humidity”, IEEE Transactions on Dielectrics and Electrical Insulation, vol. 23, no. 6, pp. 3547-3555, 2016.
- K. Ning, J. Lu and Z. Jiang, “Aging characteristics and lifespan prediction for composite insulator silicone rubber in mountainous region environment”, Polymer Testing, no. 122, p. 10, 2023.
- EPRI and Southern Company 1001329, “Performance Prediction of Polymer Insulators for Distribution”, 2001.
- EPRI TR-111566, “Application Guide for Transmission Line Non-Ceramic Insulators”, 1998.
- CIGRE WG B2.57, “TB 919: Experience with and Application Guide for Composite Line Insulators”, 2023.
- I. Gutman, J. Lundegård and P. Sidenvall, “Condition assessment of line composite insulators: after-service test programs and their practical application”, CIGRE Science & Engineering, no. 028, 2023.
- I. Gutman, “Service Experience with Composite Insulators”, Zimmar Holdings Ltd, 9 August 2024. [Online] [Accessed 19 November 2024].
- SANS 60815-3:2009 (IEC/TS 60815-3:2008), “Selection and dimensioning of high-voltage insulators intended for use in polluted conditions Part 3: Polymer insulators for a.c. systems”, Edition 1, 2009.
- Eskom Research Report RES/RR/12/34595, “KIPTS research report 2012”, 2012.
- L. Cheng, H. Mei, L. Wang, Z. Guan and F. Zhang, “Research on Aging Evaluation and Remaining Lifespan Prediction of Composite Insulators in High Temperature and Humidity Regions”, IEEE Transactions on Dielectrics and Electrical Insulation, vol. 23, no. 5, pp. 2850-2857, 2016.
- W. Vosloo, R. Macey and C. d. Tourreil, “The Practical Guide to Outdoor High Voltage Insulators”, Eskom Power Series,” Crown Publishers, 2006.
- CIGRE WG B2.21, “TB 481: Guide for the assessment of composite insulators in the laboratory after their removal from service”, 2011.
- Electric Power Research Institute, “EPRI Field Guide - Visual Inspection of Polymer Insulators", 2009.
- SANS 60815-1:2009 (IEC/TS 60815-1:2008), “Selection and dimensioning of high-voltage insulators Part 1: Definitions, information and general principles”, Edition 1, 2008.
- C. Engelbrecht and I. Gutman, “A practical implementation of statistical principles to dimension AC line insulators with respect to contaminated conditions”, IEEE Transactions on power delivery, vol. 22, no. 1, pp. 667-673, 2007.
- I. Gutman and W. Vosloo, “Application of statistical principles of insulator dimensioning with respect to polluted conditions to select line insulators based on test station results,” Proceedings of IEEE Russia Power Tech, June 2007.
- R. Davey, “The evaluation of a method to determine pollution performance curves for HTV-SR insulators tested Under AC in a natural marine pollution environment”, MSc thesis, University, Stellenbosch, South Africa, 2025.
- R. Davey, W. Vosloo and J.C. Bekker, “Determining pollution performance curves of HTV SR insulators tested in a severe coastal environment,” Proceedings of IEEE PES/IAS Power Africa, Johannesburg, South Africa, October 2024.
- CIGRE WG C4.303, “TB 555: Artificial Pollution Test for Polymer Insulators - Results of Round Robin Test”, 2013.
- IEC 60507, “Artificial pollution tests on high-voltage ceramic and glass insulators to be used on a.c. systems,” Edition 3, 2013.
- CIGRE WG D1.27, “TB 595: Finger printing of polymeric insulating materials for outdoor use”, October 2014.
- CIGRE WG D1.44, “TB 691: Pollution test of naturally and artificially contaminated insulators”, July 2017.
- IEC/TS 62073:2016, “Guidance on the Measurement of Hydrophobicity of Insulator Surfaces,” Edition 2, 2016.
- D. Pietersen, “The development of a methodology to compile an insulator pollution severity application map for South Africa”, MSc thesis, University, Stellenbosch, South Africa, 2005.
- F. Jooste, W. Vosloo, R. Davey and R. Macey, “Power utility perspective on site pollution severity assessment,” Proceedings of INMR Congress, Bangkok, Thailand, 2023.
- CIGRE WG B2.69, “TB 837: Coating for improvement of electrical performance of outdoor insulators under pollution conditions”, June 2021.