Real-Time Substep EMT Modeling and Evaluation of Multi-Terminal HVDC Systems
Authors
Rahul RANE, Aleksandra LEKIĆ - Intelligent Electrical Power Grids, EEMCS, Delft University of Technology, Netherlands
Wilhelm WINTER - Intelligent Electrical Power Grids, EEMCS, Delft University of Technology, Netherlands, TenneT TSO GmbH, Germany

Summary
Multi-terminal high-voltage direct current (MTDC) networks require accurate and computationally efficient real-time electromagnetic transient (EMT) simulation for control and protection validation and hardware-in-the-loop (HIL) applications. This paper evaluates mainstep and substep real-time EMT simulation approaches, with an additional mainstep–substep interface configuration investigated in a simplified DC cable benchmark. The benchmark compares the real-time approaches to assess the effects of time-step size and domain interfacing on DC fault transients. The findings are used to develop real-time models for MTDC configurations with two to five terminals. A 2 GW, ±525 kV three-terminal North Sea MTDC system is selected for detailed evaluation, including frequency-dependent DC cable models, metallic return conductors, and an aggregated offshore wind farm. DC and AC fault responses are assessed, together with the computational and core-allocation requirements of the real-time models. The results demonstrate the benefits of substep modeling for fast DC transients and provide practical guidance for selecting real-time EMT modeling approaches for MTDC and HIL applications.
Keywords
DC protection, harmonic assessment, modular multilevel converter, real-time simulation, substep modeling1. Introduction
The rapid expansion of offshore wind generation in the North Sea is driving the development of multi-terminal high-voltage direct current (MTDC) transmission systems to connect offshore wind farms with multiple onshore AC grids. HVDC transmission is well suited to long-distance power transfer because of its controllability, suitability for submarine transmission, and ability to interconnect asynchronous AC networks [1]. MTDC networks based on modular multilevel converters (MMCs) exhibit fast electromagnetic transients, strong AC–DC interactions and tightly coupled converter dynamics [2]. These characteristics increase modeling complexity and impose stringent requirements on simulation tools used for system studies and validation.
A key application of EMT simulation is hardware-in-the-loop (HIL) testing, where physical control and protection hardware is interfaced with a real-time electrical-system model [3]. For MTDC systems, the model must accurately reproduce relevant transients while meeting real-time computational constraints, motivating the use of different real-time modeling approaches. This requirement is particularly important for DC protection studies. Unlike AC faults, DC faults do not have natural current zero crossings and can result in a rapid increase in fault current, requiring protection actions within a few milliseconds [4]. The assessment of DC protection therefore depends on the ability of the real-time electrical model to reproduce relevant voltage and current transients following fault inception. Furthermore, modern DC protection schemes may rely on high-frequency measurements, with sampling rates reported up to 1 MHz, for fault detection and discrimination [5]. Consequently, the selection of a real-time modeling approach involves a trade-off between electrical-model fidelity, computational requirements, and the ability to represent fast transient phenomena.
To capture both fast converter switching and slower network dynamics without exceeding computational limits, advanced modeling approaches are required. Real-time EMT simulation tools provide three main approaches: mainstep, small time-step, and substep modeling [6]–[10]. Mainstep models use coarser time intervals (50–60 μs) and are suitable for large-scale system studies but have limited ability to capture fast converter switching and DC-side transients. Small time-step models use smaller time steps, typically in the range of 1–5 μs and provide improved temporal resolution for converter switching and fast transients. However, small time-step models have limitations associated with isolated component libraries, reduced modeling flexibility, and limited support for frequency-dependent cable models and newer real-time simulation hardware architectures. Moreover, fixed-admittance small time-step formulations can impose additional constraints on component modeling and network partitioning. Switching devices may be represented by inductive or capacitive equivalents according to their switching state, which can introduce numerical effects and artificial resonances [6], [7]. In contrast, mainstep and substep models use the conventional two-value resistive representation of switching devices. Substep modeling provides an alternative means of representing fast electrical dynamics while retaining compatibility with a broader network modeling framework. These differences in time-step size, switching-device representation, and network implementation are important when assessing the electrical fidelity and computational requirements of the three approaches.
The numerical treatment of switched networks has been investigated in foundational work on fast time-domain simulation [5], while small-time-step modeling for real-time simulation has been reported in [6], [8]. Benchmarking studies of real-time MMC models, efficient simulation techniques, and field-programmable gate array (FPGA)-based implementations have further investigated the numerical performance and practical implementation of real-time simulation approaches [7], [9], [10], [11], [12], [13], [14], [15], [16]. Reference [12] presents real-time simulation of HVDC grids with MMCs using the small-time-step modeling approach, where only the converters are implemented with small-time-step components while the DC grid remains in mainstep mode due to limitations in representing frequency-dependent cable models.
Recent trends emphasize the development of real-time MTDC models to support hardware-in-the-loop (HIL) studies and fast transient analysis [3]. This study investigates small-time-step simulation for MMC-based HVDC systems. More recent studies [17], [18], [19] have extended real-time modeling and benchmark development to HVDC and MTDC systems. The 2 GW, ±525 kV North Sea MTDC configuration considered in this work is representative of recent offshore grid developments [20]. However, computational constraints and the need to interface different simulation domains remain important challenges. Such interfaces can introduce additional numerical effects that must be carefully considered. These limitations motivate the use of substep-based approaches, which can model converters, DC grids, and frequency-dependent cables consistently, while reducing the need for multiple libraries and interface adjustments.
This paper adopts a two-level assessment methodology. First, a simplified DC cable benchmark is used to evaluate the numerical behavior of the real-time approaches against a high-fidelity offline EMT reference. The benchmark considers a 50 μs mainstep solution, 10 μs and 2.5 μs substep solutions, and a 10 μs substep solution with a mainstep–substep interface. DC fault transients are compared in terms of waveform accuracy. Second, the benchmark findings are used to develop real-time MTDC models with two to five terminals. Detailed implementation is performed on a 2 GW ±525 kV three-terminal North Sea MTDC benchmark, including frequency-dependent DC cables, dedicated metallic return, MMC stations, AC networks, and aggregated offshore wind farms. The three-terminal system is evaluated for DC fault response and selected AC fault events using DC- and AC-side quantities. The objective is to assess the accuracy, computational requirements, and core-allocation trade-offs of different real-time modeling approaches for MTDC studies, including control validation, protection assessment, and HIL testing.
The main contributions of this paper are:
A simplified DC cable benchmark is established to evaluate the electrical-model accuracy of mainstep, substep, and interfaced real-time solutions, including the effects of time-step size and network partitioning.
The benchmark findings are applied to a detailed 2 GW ±525 kV three-terminal MTDC system to assess DC fault response and selected AC fault events using both DC- and AC-side quantities.
The electrical fidelity of the different approaches is assessed together with their processing-core requirements, providing practical guidance for selecting real-time simulation approaches for MTDC control, protection, and HIL applications.
The remainder of the paper is organized as follows. Section 2 describes the MTDC test system. Section 3 describes simplified DC cable benchmark and the real-time modeling approaches. Section 4 presents the MTDC simulation results and discusses the implications for real-time simulation and HIL applications. Section 5 concludes the paper.
2. HVDC Test System Description
The development of reliable HVDC grid models is essential for studying multi-terminal operation, offshore integration, and fast control and protection interactions in emerging energy systems. To achieve these goals, various real-time simulation models have been developed for point-to-point connections, three-terminal, four-terminal meshed, and five-terminal meshed HVDC grids. The modeling approach follows the general recommendations found in recent CIGRE technical brochures [14], [15], [16], [21], [22] and expands on previous work that did not fully address the detailed DC-side interactions [17].
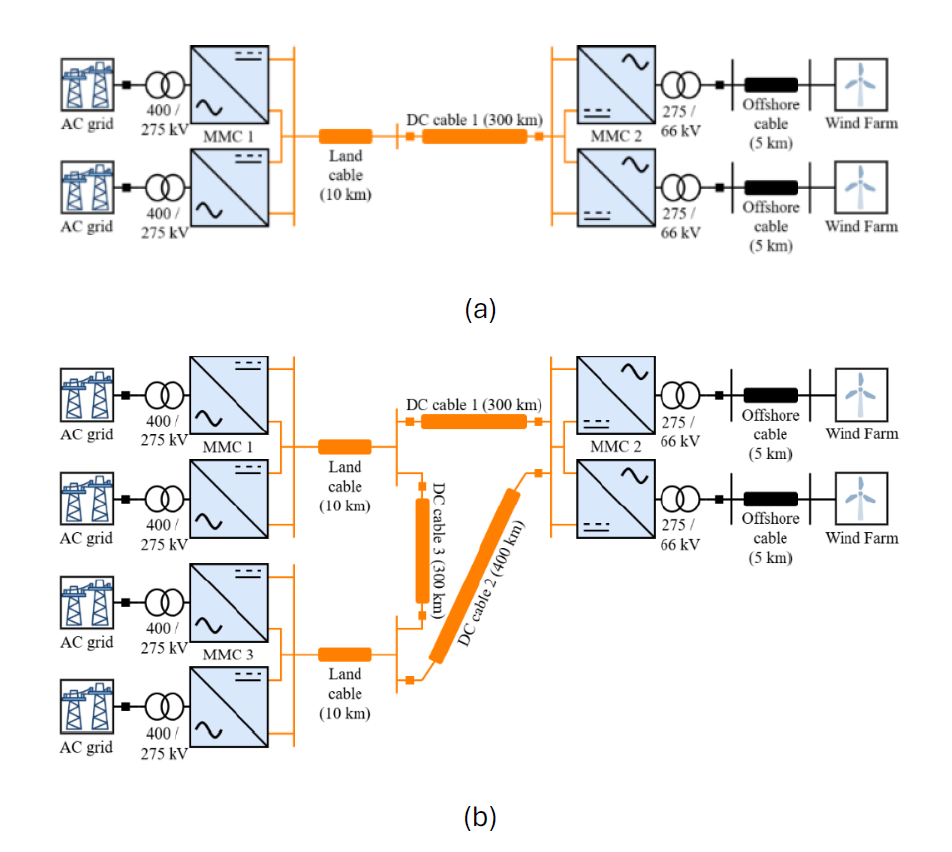
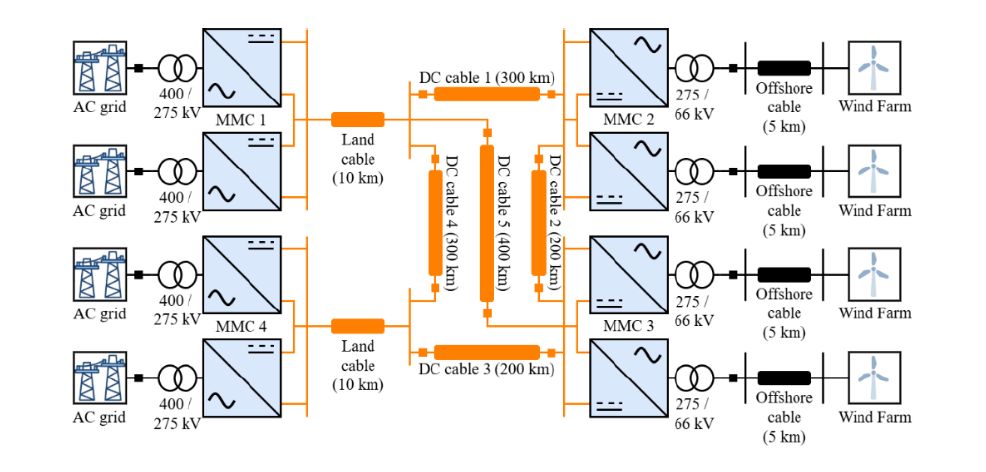
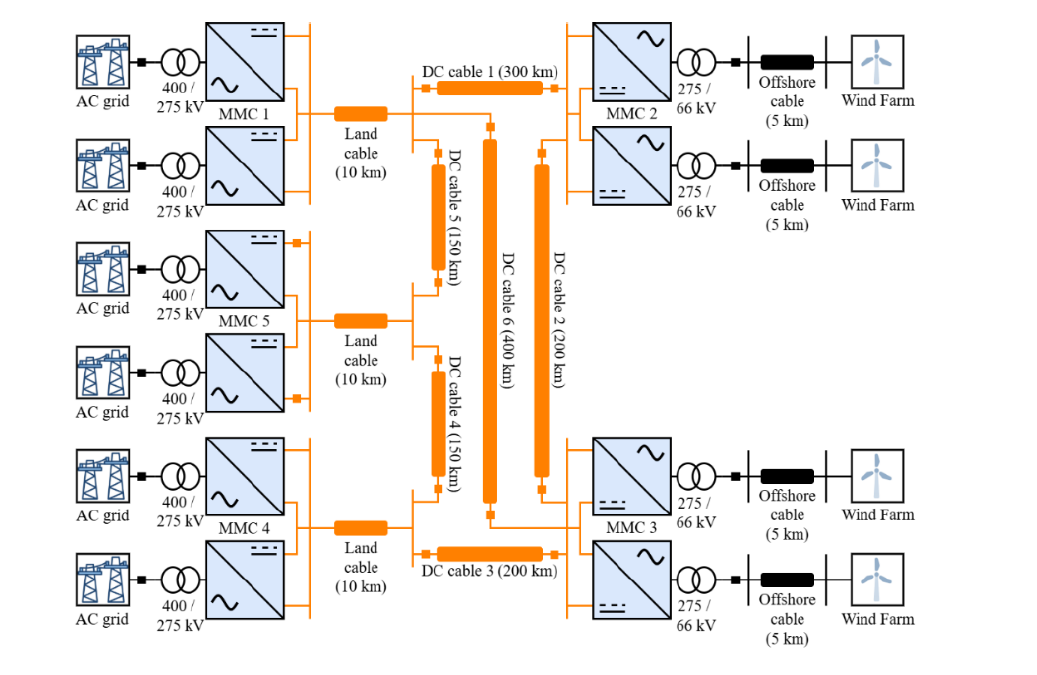
The modeled MTDC systems shown in Figure 1 use a bipolar configuration with a dedicated metallic return (DMR) and operate at a nominal DC voltage of ±525 kV [20], which aligns with expected voltage levels for future large-scale offshore transmission infrastructures in Europe. To provide clarity and consistency among test cases, each HVDC grid is divided into AC/DC converters, DC transmission system, onshore AC grid, and offshore AC network.
(c)
(d)
Figure 1 - MTDC configurations with (a) two terminals, (b) three terminals, (c) four terminals, and (d) five terminals
2.1. AC/DC Converters
Each converter in the network (see Figure 1), for both the positive and negative poles, consists of three main components: the converter transformer, the arm reactor, and the converter valve. The converter transformer is a two-winding unit with a Y-Δ configuration, where the Y side connects to the AC grid and the Δ side connects to the MMC. The arm reactor is connected in series with the converter valve and is typically placed on the AC side of the MMC. Each converter valve is composed of multiple half-bridge submodules, which can operate in three states: bypass, inserted, or blocked. To capture the detailed dynamics of the converter without modeling each submodule individually, an average-value MMC model is implemented. The MMC5 model can be run in the mainstep or substep environment. Key electrical parameters of the converters used in this study are summarized in Table 1.
Parameter | Value | Parameter | Value |
Rated power | 1 GVA | Rated frequency | 50 Hz |
Converter AC voltage | 275 kV | DC voltage | 525 kV |
Onshore AC voltage | 400 kV | Offshore AC voltage | 66 kV |
Number of submodules | 150 | Submodule capacitance | 10 mF |
Submodule switching voltage | 3.5 kV | Submodule switching current | 1 kA |
Arm resistance | 0.15 Ω | Arm inductance | 50 mH |
Transformer resistance | 0.006 pu | Transformer inductance | 0.18 pu |
DC side reactor resistance | 1 mΩ | DC side reactor inductance | 10 mH |
In the modeled MTDC network, a variety of MMC control strategies (as shown in Figure 2) are employed to regulate power flow and maintain system voltage stability. The onshore converter MMC 1 operates in grid-following mode and serves as the slack bus, regulating the DC voltage and controlling reactive power at the AC grid interface. The remaining onshore converters operate in active and reactive power (P–Q) control mode to manage power exchange with their respective AC systems; alternatively, they can be configured in grid-forming voltage–frequency (V–f) control mode for specific study scenarios. Offshore converters are modeled as grid-forming units using a voltage–frequency (V–f) control strategy to establish the offshore AC network. In addition, each converter incorporates submodule capacitor energy control and dqz-axis circulating current suppression control to ensure balanced energy distribution and to suppress internal arm current oscillations. All control loops are implemented using proportional–integral (PI) controllers with the gain values specified in Table 2.
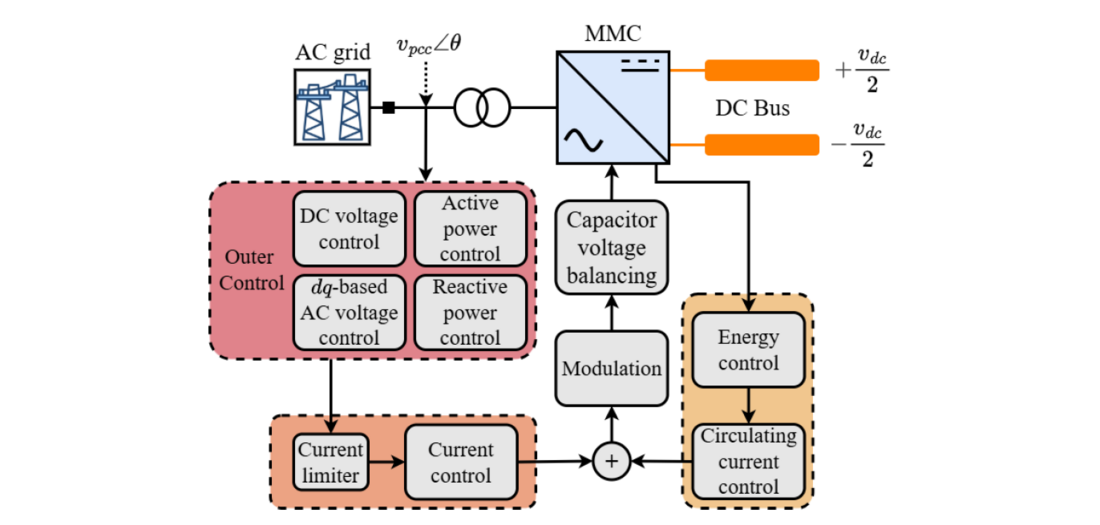
Figure 2 - Overall control flow in each converter in the MTDC network
Type | Kp (pu) | Ki (pu) |
Current control | 1.8 | 903.5362 |
dq-axis circulating current control | 0.1808 | 45.3514 |
z-axis circulating current control | 0.2896 | 72.5623 |
Energy control | 1.1025 | 16.5375 |
DC voltage control | 7.0729 | 176.8225 |
Active power control | 0.5 | 10 |
Reactive power control | 0.5 | 10 |
AC voltage control | 1 | 50 |
2.2. DC Transmission Network and DC Circuit Breakers
The DC transmission network varies depending on the number of terminals in the selected configuration. Each onshore converter is connected to the corresponding DC hub through a 10 km land cable, while the remainder of the HVDC grid consists of submarine cables. All DC cables are modeled using frequency-dependent phase-domain representations, with three conductors representing the positive pole, negative pole, and dedicated metallic return (DMR), consistent with the bipolar DMR configuration. The cable parameters and conductor geometry are based on representative 2 GW offshore interconnection projects in the North Sea [20], with the corresponding electrical and geometrical parameters detailed in [23].
The frequency-dependent cable characteristics are approximated using rational curve fitting over the specified frequency range. The fitting thresholds determine the maximum allowable approximation error and the maximum number of poles used to represent the characteristic admittance and attenuation functions. The same fitting criteria are applied to the cable models used in the different MTDC configurations to maintain consistency in the electrical-network representation. The parameters used for the frequency-dependent cable model are summarized in Table 3.
Parameter | Value |
Frequency range | 0.001 – 1000000 Hz |
Yc fitting maximum number of poles | 50 |
Yc fitting maximum error | 0.1 % |
Attenuation maximum number of poles | 50 |
Attenuation maximum error | 0.1 % |
Attenuation maximum residue/pole ratio tolerance | 100 |
Earth return formula | Numerical integration |
For DC protection studies, average-value models of mechanical DC circuit breakers are implemented at both ends of each submarine cable, with separate breakers for the positive and negative poles, as indicated by the boxed locations in Figure 1. The assumed DC circuit breaker locations are defined solely for the benchmark simulation studies and do not represent a specific real-world MTDC platform design. The average-value representation captures the main electrical behavior associated with current interruption while avoiding the detailed internal dynamics of the mechanical switching mechanism [24], [25]. This representation is therefore suitable for evaluating the interaction between DC faults, the transmission network, and the protection system within the available real-time computational constraints.
As illustrated in Figure 3, each DC circuit breaker is represented by three functional branches: a main current-carrying branch, a current-injection branch, and an energy-absorption branch. During normal operation, the main branch carries the line current. Following a breaker command, the current-injection branch transfers the current from the main branch toward the interruption path, while the energy-absorption branch limits the resulting overvoltage and dissipates the energy stored in the DC network. The DC circuit breaker parameters are scaled for the ±525 kV benchmark system and are summarized in Table 4.
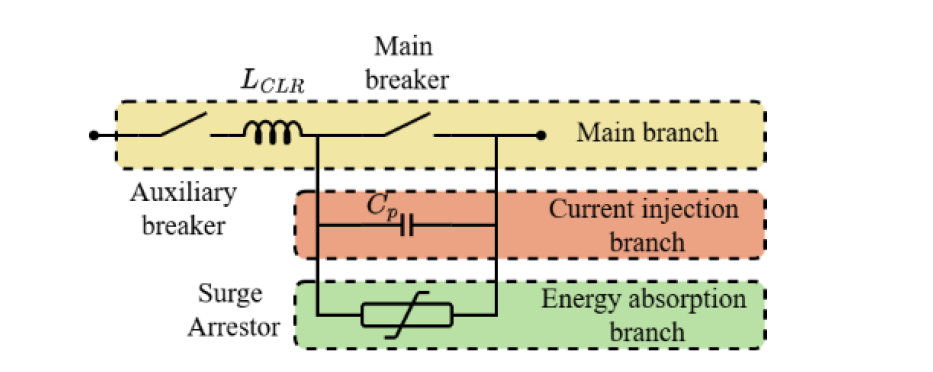
Figure 3 - Average DC circuit breaker model presented in [24], [25], [26]
Parameter | Symbol | Value |
Current limiting reactor | LCLR | 350 mH |
Main current breaker’s current breaking capability | Imain | 16 kA |
Auxiliary breaker’s current breaking capability | Iaux | 0.001 kA |
Parallel capacitor | Cp | 1.6 μF |
Discharge current of surge arrestor | Id | 20 kA |
Discharge voltage of surge arrestor | Vd | 865 kV |
Energy decay time constant of surge arrestor | Tc | 10 s |
2.3. Onshore AC Grid
The onshore AC system is represented using a Thevenin equivalent voltage source behind an equivalent impedance, modeling a strong transmission grid. The grid impedance is modeled as a series resistance followed by a parallel resistor–inductor branch, allowing both the short-circuit strength and dynamic stiffness of the grid to be adjusted. The onshore AC grid operates at a rated line-to-line voltage of 400 kV. Each onshore converter is connected to the AC system through 1 GVA Y–Δ transformers with a voltage ratio of 400/275 kV. These converters correspond to MMCs 1 and 3 in Figure 1(b), MMCs 1 and 4 in Figure 1(c), and MMCs 1, 4, and 5 in Figure 1(d).
To better represent the bipolar HVDC architecture, a split AC bus configuration is adopted at each onshore converter. In this arrangement, the positive and negative poles of each converter are connected to separate AC buses, ensuring full electrical separation between the poles on the AC side. This prevents unintended interaction between poles and enables accurate representation of pole-specific disturbances and protection events. The split-bus configuration also supports independent control validation and facilitates more realistic modeling of unbalanced or asymmetric AC–DC operating conditions. For comparison, Figure 4 shows both the conventional bipolar MMC configuration and the split AC bus configuration.
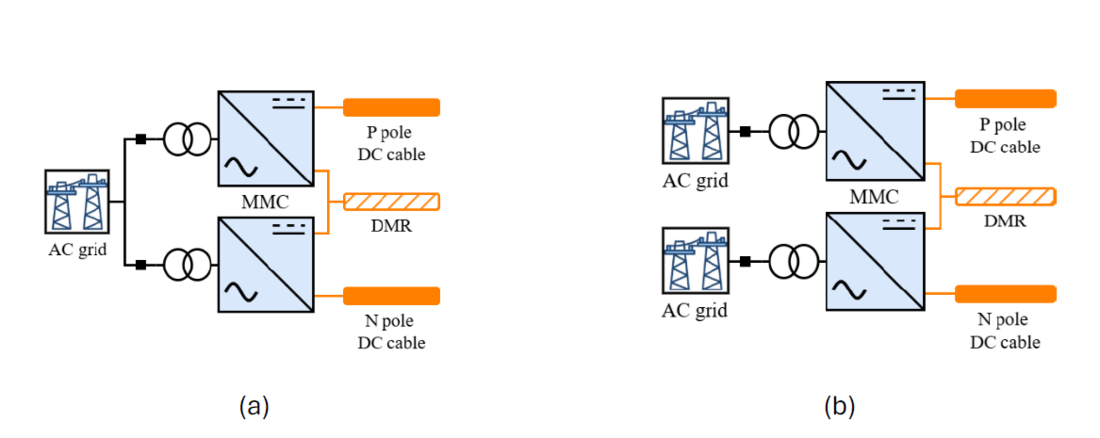
Figure 4 - Bipolar configurations with the AC side modeled using (a) a single AC bus and (b) a split AC bus
2.4. Offshore AC Network
The offshore AC system includes offshore converters and aggregated wind farm models. Offshore converters correspond to MMC 2 in Figure 1(b), and MMCs 2 and 3 in Figures 1(c) and 1(d). Each offshore converter is connected to the offshore AC network through a 1 GVA Δ–Y transformer rated at 275/66 kV. The split AC bus configuration is also applied to the offshore system. The positive and negative poles of each offshore converter are connected to separate AC buses, each associated with its own offshore cable of length 5 km and an aggregated wind farm. Splitting the AC buses ensures that AC-side interactions remain pole-specific and prevents cross-pole coupling through the offshore grid.
For each pole, the full 1 GW offshore generation capacity is modeled using appropriately scaled Type-4 wind turbine units illustrated in Figure 5, each rated at 15 MW and operating at a nominal wind speed of 12 m/s. Each turbine consists of four principal components: an aerodynamic wind turbine model, a permanent magnet synchronous machine (PMSM), a back-to-back AC–DC–AC converter, and a scaling transformer. The aerodynamic wind turbine model calculates the mechanical power captured from the wind based on the turbine’s power-coefficient characteristics and the incoming wind speed. The output of this block is the mechanical torque, which drives the electrical machine. The aerodynamic torque is applied to the PMSM. The PMSM is chosen because it offers high efficiency, fast dynamic response, and is widely used in modern offshore wind turbine designs. The PMSM converts mechanical torque into electrical power while its speed and torque are regulated by the machine-side converter (MSC).
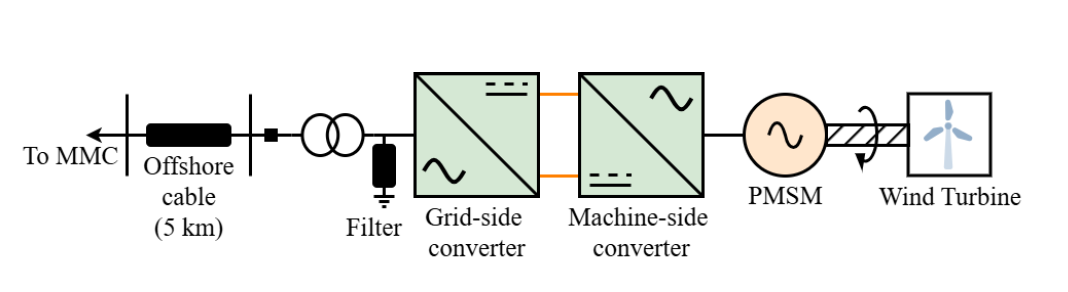
Figure 5 - Offshore wind turbine model
The back-to-back AC–DC–AC converter is implemented using a full-scale two-level topology, which enables complete decoupling between the mechanical and electrical dynamics. The MSC interfaces the PMSM to the DC link and operates as a variable-frequency voltage source converter. It controls the stator voltage and electromagnetic torque of the machine, which enables maximum power extraction from the aerodynamic model. On the grid side, the grid-side converter (GSC) regulates the DC-link voltage and controls the offshore AC bus voltage.
Finally, a scaling transformer connects the wind turbine’s converter system to the offshore AC grid. The transformer steps up the converter’s terminal voltage 0.69 kV to match the 66 kV collection network and subsequently interfaces with the offshore converter. When aggregated, multiple turbine units are combined to represent a total wind farm capacity of 1 GW by appropriately scaling the high-voltage-side current in the transformer. The detailed derivation of the MSC and GSC parameters, including converter ratings, control bandwidths, and filter design, follows the procedures outlined in [27].
3. Simplified DC Cable Benchmark
A simplified DC cable benchmark is implemented to independently assess the electrical-model fidelity of the real-time simulation approaches. The benchmark isolates the effects of time-step size and domain interfacing from the dynamics of the complete MTDC system.
The benchmark consists of a DC voltage source, a DC transmission cable, and a receiving-end DC voltage source as depicted in Figure 6. The system is initialized at Vdc,1 = 525 kV and Vdc,2 = 523 kV, resulting in an initial cable current of approximately 1 kA. The cable uses the same frequency-dependent characteristics as DC Cable 1 in Figure 1. Four real-time simulation cases are considered:
- Case 1 – mainstep (50 μs): The complete benchmark is solved using the mainstep network solution.
- Case 2 – substep (10 μs): The complete benchmark is solved using a 10 μs substep time step.
- Case 3 – substep (2.5 μs): The complete benchmark is solved using a 2.5 μs substep time step to assess time-step sensitivity.
- Case 4 – mainstep–substep interface: The cable is solved in the mainstep domain at 50 μs, while the source and DC circuit breaker are solved in the substep domain at 10 μs. The two domains are coupled through a mainstep–substep interface. The cable length is reduced to compensate for the propagation delay introduced by the two mainstep–substep interfaces, with each interface contributing a delay of 1.5 mainstep time steps.

Figure 6 – Simplified DC cable benchmark model
Three DC fault types are applied: (a) pole-to-pole, (b) positive-pole-to-ground, and (c) positive-pole-to-DMR. The faults are applied at 25% of the cable length from the sending end, with a fault resistance of 1 mΩ, and the DC circuit breakers are operated 8 ms after fault inception. Figure 7 compares the positive-pole voltage and current responses for Cases 1–4 together with the high-fidelity offline EMT reference. Case 1 shows the largest deviation from the offline reference, particularly during the initial fault transient. Case 2 provides closer agreement with the reference, while Case 3 provides a further improvement in the representation of fast transient components. However, the difference between Cases 2 and 3 is very small.
Although Case 4 uses the same 10 μs substep time step as Case 2, its response differs from the full substep solution. This indicates that the mainstep–substep interface introduces an additional numerical effect. Thus, the response of the interfaced approach depends not only on the substep time step but also on the interface between the simulation domains.
Overall, the results show that reducing the time step improves the representation of fast DC transients, while domain interfacing can introduce additional deviations. These findings are used to guide the selection of the real-time modeling approach for the MTDC system.
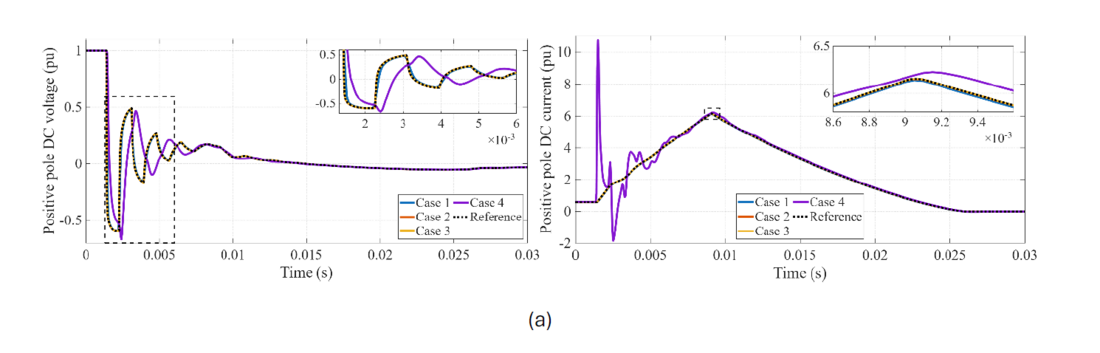
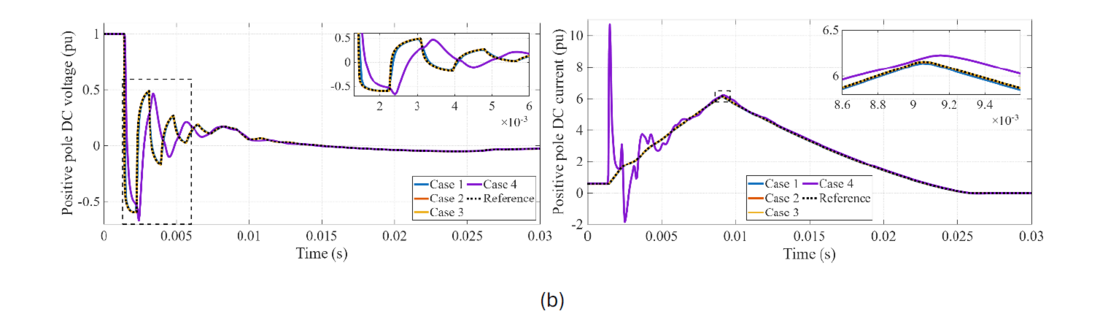
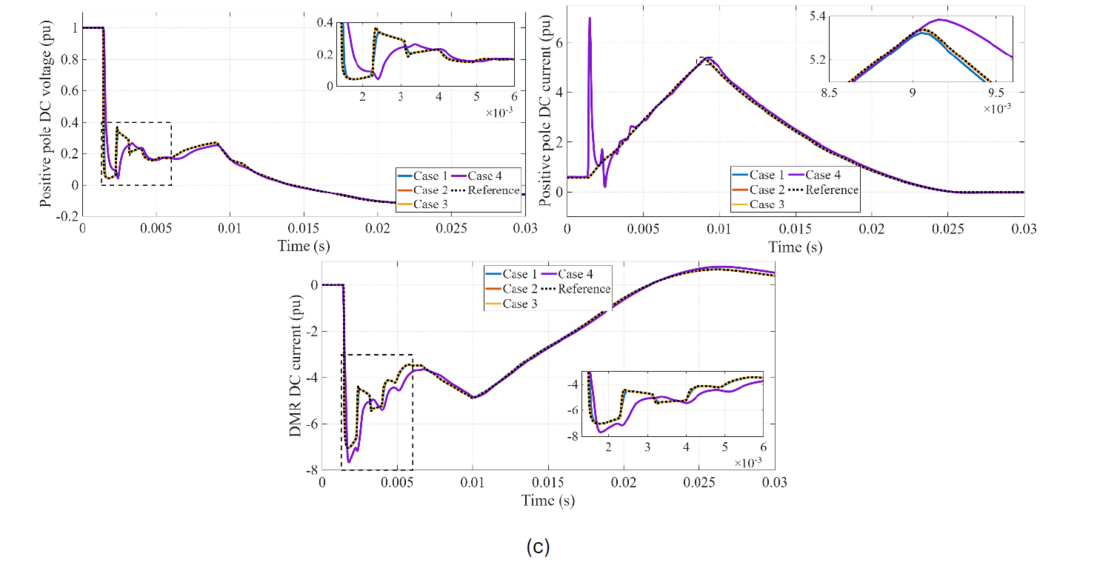
Figure 7 - Variation of positive-pole DC voltage and current at the sending end for a (a) pole-to-pole, (a) positive-pole-to-ground, and (a) positive-pole-to-DMR DC faults
4. Modeling of MTDC Test System
Two real-time modeling approaches are considered for the MTDC test system: mainstep and substep modeling. In the mainstep approach, the AC networks, converter stations, and DC grid are solved using a 50 μs time step, making it suitable for system-level studies of steady-state operation, power flow, and overall system interactions. In the substep approach, the AC networks, converters, and DC grid are solved using a 10 μs time step, providing higher numerical fidelity for DC faults, travelling-wave propagation, and fast AC–DC interactions. Based on the simplified DC cable benchmark and core-allocation analysis, the 10 μs substep time step is selected as a suitable compromise between numerical fidelity and computational requirements for the ±525 kV MTDC system. As concluded in the previous section, no interfaces are used, and core splitting is performed only where required by the actual cable propagation parameters.
4.1. Model Evaluation and Results
The three-terminal MTDC system shown in Figure 1(b) is used to evaluate the different real-time modeling approaches. This configuration provides sufficient complexity to capture DC-side interactions, converter control coupling, and power sharing while maintaining manageable computational requirements.
The system is initialized under the same operating conditions for all approaches. The offshore wind farm delivers 1 GW of active power. MMC 1 regulates the DC voltage at 1 pu and the reactive power at 0 MVAR. MMC 2 operates with grid forming voltage control, while MMC 3 exports 1 GW of active power to the AC grid and operates at 0 MVAR reactive power. The same operating point is maintained for all cases to ensure a consistent comparison of their electrical and numerical behavior.
4.2. DC Fault Response Comparison
Three types of DC faults are applied to DC Cable 1 to assess the ability of the different modeling approaches to capture fast DC transients. They are applied at 25% of the cable length from the sending end, with a fault resistance of 1 mΩ, and the DC circuit breakers are operated 8 ms after fault inception.
Figure 8 compares the positive-pole DC voltage and current at the MMC 1 end of DC Cable 1 for the mainstep and substep approaches. The mainstep approach shows a slower voltage collapse and current rise due to its coarser time resolution. In contrast, the substep approach captures the rapid voltage drop and steep current rise immediately after fault inception, providing a closer representation of the fast transient response. These results demonstrate the importance of substep modeling for accurately capturing fast DC fault transients in MTDC systems.
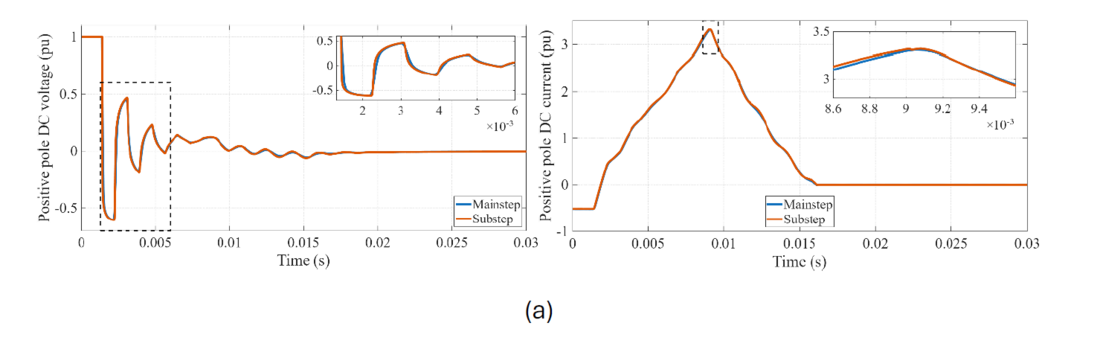
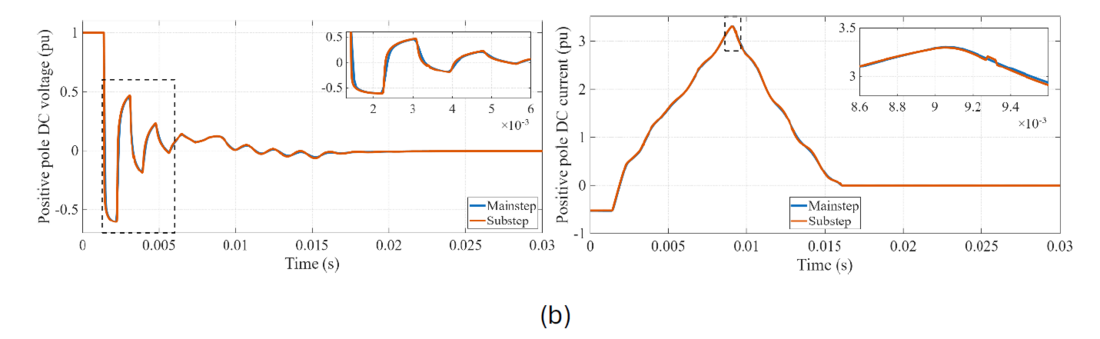
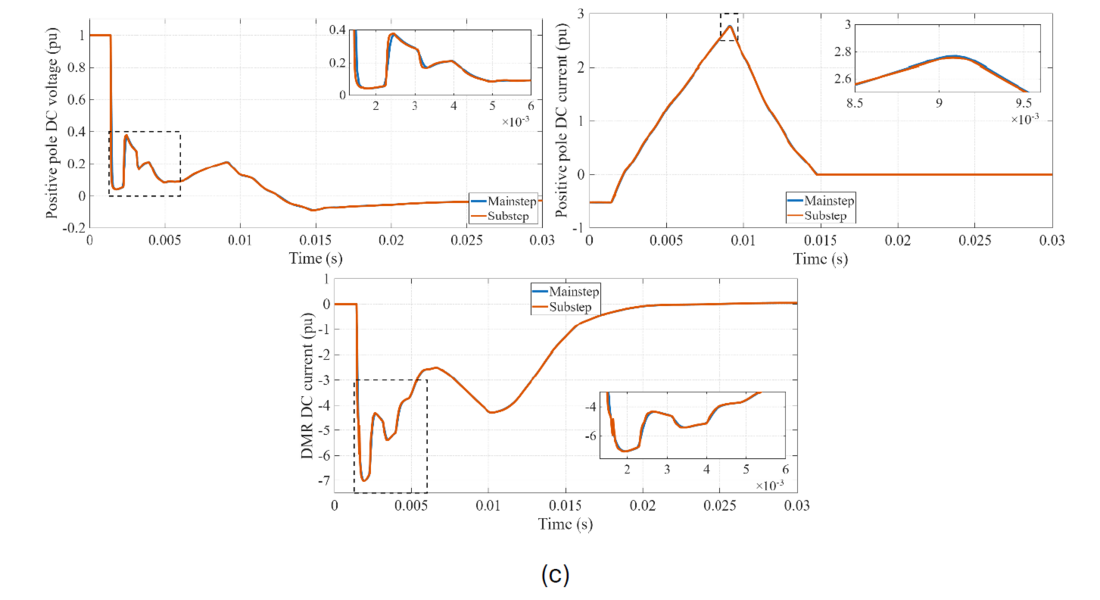
Figure 8 - Variation of the positive-pole DC voltage and current at the MMC 1 side of DC cable 1 for (a) pole-to-pole, (b) positive-pole-to-ground, and (c) positive-pole-to-DMR DC faults
4.3. AC Fault Response Comparison
To assess whether the benefits of substep modeling extend beyond fast DC-side transients, AC fault events were investigated for the three-terminal MTDC system. A three-phase AC fault with a fault resistance of 1 mΩ was applied to the AC network connected to the positive-pole terminal of MMC 1. The resulting AC- and DC-side voltage and current responses were compared for the mainstep and substep approaches.
Figure 9 shows the positive-pole AC RMS voltage and current at the MMC 1 terminal, together with the DC voltage and current at the DC Cable 1 terminal on the MMC 1 side during the three-phase AC fault. The two approaches show similar overall responses, with only minor differences during the fault transient. However, small differences can be seen in the small oscillations and high-frequency fluctuations, especially after the fault and during the recovery period. The substep approach captures these faster variations more clearly because it uses a smaller time step.
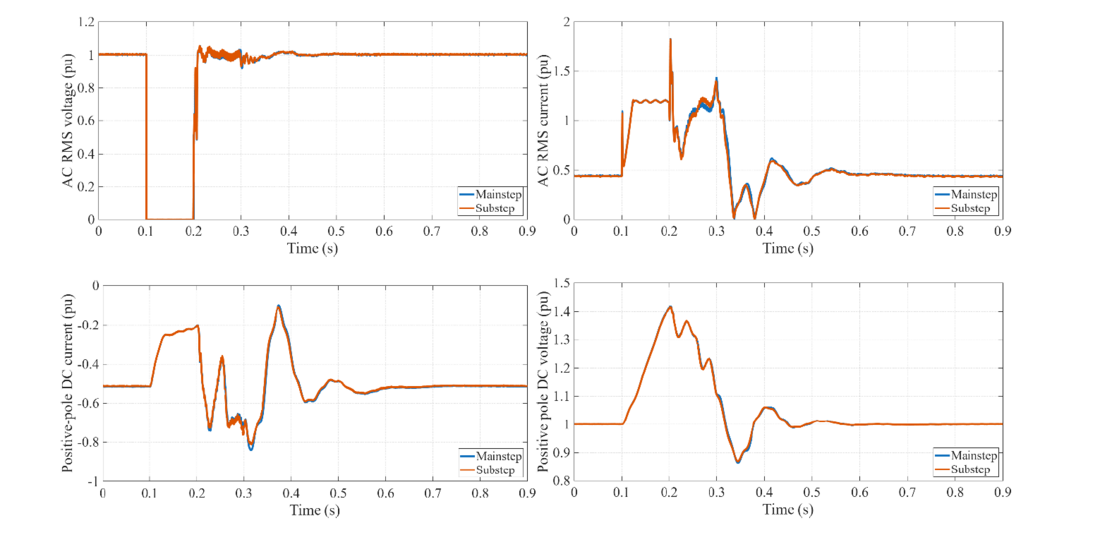
Figure 9 - Variation of the AC RMS voltage, current, positive-pole DC voltage and current at the MMC 1 side of DC cable 1 for a 3-phase AC fault
4.4. Computational Requirements and Core Allocation
Core allocation directly affects the computational requirements and scalability of real-time MTDC simulation. Figure 10 summarizes the processing-core allocation for two- to five-terminal MTDC systems using different modeling approaches. The cores are categorized as substep, mainstep, network-solution, and controller cores.
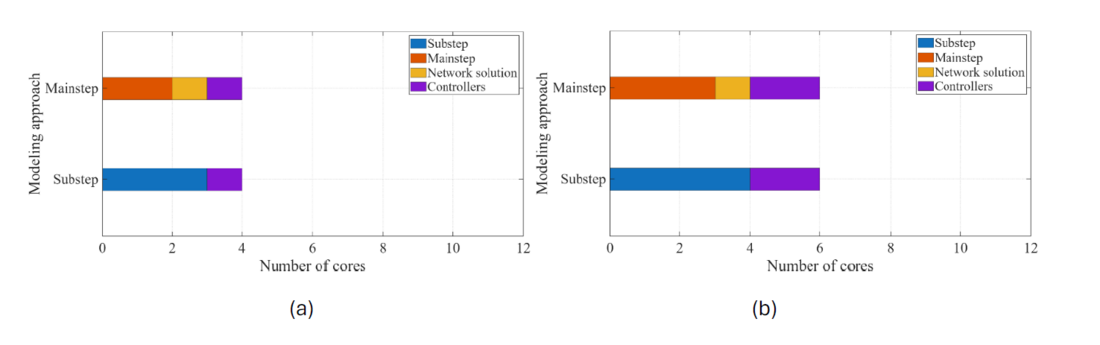
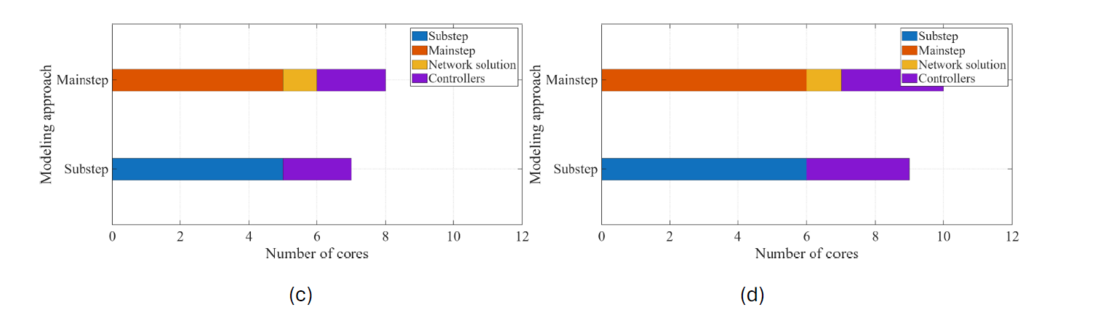
Figure 10 - Core allocation for MTDC configurations with (a) two terminals, (b) three terminals, (c) four terminals, and (d) five terminals
For the two-terminal system, the mainstep approach requires four cores, with no substep cores, whereas the substep approach uses three substep cores for the converters and DC grid. As the number of terminals increases, the core requirements increase differently for the two approaches. For the five-terminal system, the mainstep and substep approaches require ten and nine cores, respectively. Although the substep approach requires fewer total cores, its higher sampling frequency results in a greater computational load per core.
These results indicate a trade-off between computational requirements and electrical-model fidelity. The substep approach provides higher numerical fidelity but requires careful partitioning and sufficient computational resources. It should also be noted that, in mainstep modeling, control and power-system components can be allocated to the same processing core to reduce the required number of hardware cores; however, this combined allocation introduces an additional one-time-step delay between the control and power-system/network-solution components.
5. Conclusion
This paper provides real-time EMT benchmark models for a 2 GW, ±525 kV MTDC system using the substep simulation approach. Firstly, a simplified DC cable benchmark was first used to compare mainstep, substep, and the mainstep–substep interface approaches. The results showed that substep modeling provides closer agreement for fast DC fault transients, while the mainstep–substep interface introduces additional numerical deviations. A 10 μs substep time step was selected for the MTDC model, as reducing the time step to 2.5 μs provided only a small improvement for the investigated faults while significantly increasing the computational requirements.
A three-terminal MTDC system was then used to evaluate DC and AC fault responses. The results demonstrated improved representation of fast DC transients with substep modeling. For the investigated three-phase AC fault, mainstep and substep produced similar overall waveform trends, with differences mainly observed in small oscillations and high-frequency components during the fault and recovery periods. Overall, the developed benchmark models and assessment provide practical guidance for real-time MTDC modeling for fault studies, control validation, and HIL applications.
References
- T. Abedin, M. S. H. Lipu, M. A. Hannan, P. J. Ker, S. A. Rahman, C. T. Yaw, S. K. Tiong, and K. M. Muttaqi, “Dynamic modeling of hvdc for power system stability assessment: A review, issues, and recommendations,” Energies, vol. 14, no. 16, p. 4829, 2021.
- A. Sajadi, R. W. Kenyon, and B.-M. Hodge, “Synchronization in electric power networks with inherent heterogeneity up to 100% inverter-based renewable generation,” Nature communications, vol. 13, no. 1, p. 2490, 2022.
- G. Chaffey, M. H. Rahman, F. Page, I. Jahn, B. Ponnalagan, K. Ishida, L. Kunjumuhammed, M. Wang, D. Van Hertem, and I. Cowan, “Demonstration of multi-vendor protection systems for multiterminal vsc-hvdc networks,” in 2021 IEEE Madrid PowerTech, IEEE, 2021, pp. 1–6.
- M. Wang, M. Abedrabbo, W. Leterme, D. Van Hertem, C. Spallarossa, S. Oukaili, I. Grammatikos, and K. Kuroda, “A review on ac and dc protection equipment and technologies: Towards multivendor solution,” in CIGRE Winnipeg 2017 Colloquium, Cigre, 2017, pp. 1–11.
- J. S. Farkhani, ¨O. C¸ elik, K. Ma, C. L. Bak, and Z. Chen, “A comprehensive review of potential protection methods for vsc multi-terminal hvdc systems,” Renewable and Sustainable Energy Reviews, vol. 192, p. 114 280, 2024.
- P. Pejović and D. Maksimović, “A method for fast time-domain simulation of networks with switches,” IEEE Trans. Power Electron., vol. 9, no. 4, pp. 449–456, Jul. 1994.
- T. Maguire and J. Giesbrecht, “Small time-step (< 2 μs) VSC model for the real time digital simulator,” in Proc. Int. Power Systems Transients (IPST), Montréal, QC, Canada, 2005.
- T. Maguire, B. Warkentin, Y. Chen, and J. Hasler, “Efficient techniques for real time simulation of mmc systems,” in Proc. Int. Conf. Power Syst. Transients (IPST), 2013, pp. 1–7.
- K. Ou, T. Maguire, B. Warkentin, Y. Chen, Y. Zhang, R. Kuffel, Z. Cai, and L. Guan, “Research and application of small time-step simulation for mmc vsc-hvdc in rtds,” in 2014 International Conference on Power System Technology, IEEE, 2014, pp. 877–882.
- L.-A. Grégoire et al., “Benchmarking of real-time simulation model of modular multilevel converter,” in Proc. IEEE IECON, Beijing, China, 2017.
- H. Ding, X. Shi, Y. Chen, and Y. Zhang, “Dynamic performance assessment of FPGA-based MMC systems integration on real-time simulator,” in Proc. CIGRE Int. Symp., Montréal, QC, Canada, 2025.
- S. Elimban, Y. Zhang, and J. G. Alonso, “Real time simulation for hvdc grids with modular multi-level converters,” in 11th IET International Conference on AC and DC Power Transmission, IET, 2015, pp. 1–8.
- P. Sun, F. Arra˜no-Vargas, H. R. Wickramasinghe, and G. Konstantinou, “Benchmark models for hvdc systems and dc-grid studies,” in 2019 9th International conference on power and energy systems (ICPES), IEEE, 2019, pp. 1–6.
- CIGRE Working Group B4.72, “Dc grid benchmark models for system studies,” CIGRE Tech. Brochure 804, 2020.
- CIGRE Working Group B4.76, “Dc-dc converters in hvdc grids and for connections to hvdc systems,” CIGRE Tech. Brochure 827, 2021.
- CIGRE Working Group B4.57, “Guide for the Development of Models for HVDC Converters in a HVDC Grid,” CIGRE Technical Brochure 604, 2014.
- A. Shetgaonkar, T. Karmokar, M. Popov, and A. Lekić, “Enhanced real-time multiterminal hvdc power system benchmark models with performance evaluation strategies,” CIGRE Science & Engineering, vol. 32, pp. 1–29, 2024.
- L. Liu, A. Shetgaonkar, and A. Lekić, “Interoperability of classical and advanced controllers in mmc based mtdc power system,” International Journal of Electrical Power & Energy Systems, vol. 148, p. 108 980, 2023.
- A. Shetgaonkar, V. Nougain, M. Popov, P. Palensky, and A. Lekić, “Predictive dc fault ride-through for offshore mmc-based mt-hvdc grid,” IEEE Open Journal of Industry Applications, 2025.
- A. Alefragkis and S. Kabul, “Next generation offshore grid connection systems: Tennet’s 2 gw standard,” ELECTRA N°321, 2022. [Online].
- CIGRE Working Group B4.74, “Guide to develop real-time simulation models for hvdc operational studies,” CIGRE Tech. Brochure, no. 864, pp. 1–167, 2022.
- CIGRE Working Group B4.70, “Guide for electromagnetic transient studies involving VSC converters,” CIGRE Technical Brochure 832, 2021.
- T. Karmokar and M. Popov, “Enhanced modelling and parameter determination of hvdc cables using practice-oriented methodology,” CIGRE Science and Engineering, no. 036, CSE–N, 2025.
- M. Popov and D. Jovčić, “Develop system level model for mechanical DCCB,” PROMOTioN, TU Delft, Delft, The Netherlands, Deliverable D6.2, 2023. [Online].
- A. Khan, S. Rangasamy, W. Ahmad, C. Foote and B. Marshall, "Performance analysis of DC circuit breakers for future HVDC grids in GB," 17th International Conference on Developments in Power System Protection (DPSP 2024), Manchester, UK, 2024, pp. 206-213.
- A. Shetgaonkar, S. Liu, and M. Popov, “Comparative analysis of a detailed and an average varc dccb model in mtdc systems,” in 2022 IEEE Power & Energy Society General Meeting (PESGM), IEEE, 2022, pp. 1–5.
- RTDS Technologies, “Standardization of renewable energy system modelling,” RTDS, Tech. Rep., 2022.