Approach to Estimate Congestion Management Related Flexibility Needs during a Planned Outage in a Transmission Grid
Authors
S. PELTOKETO, A. SUMMANEN, T. MAKIHANNU, T. ASP - Fingrid Oyj, Helsinki, Finland
T. RAUHALA - Faculty of Information Technology and Communication Sciences, Tampere University, Tampere, Finland

Summary
The predictability of power flows in an electricity transmission grid is becoming more complex and there is an increasing need for flexibility. The changes in the operational environment challenge the currently used methods of outage planning of a transmission grid. Currently, there is lack of methods capable to estimate the power flows, voltages, grid congestions and flexibility needs of a region in a time frame of one to three years prior to a planned outage. As a solution, this paper presents an approach based on market modeling and time series to estimate the power flows, voltages, grid congestions and flexibility needs in outage planning. To demonstrate the applicability of the approach, the paper presents the results of a case study of a generation surplus region in Finland. The results of the case study show that the presented approach is capable to estimate flexibility needs in the context of outage planning.
Keywords
congestion management - flexibility need - outage planning - power flow estimation - time series analysis1. Introduction
Electricity transmission and distribution systems are under major changes globally. Environmental and emission reduction targets, such as Clean Energy for all Europeans [1] and Fit for 55 packages of the EU [2], are shifting the electricity system from centralized, fossil-fuel dependent towards a decentralized system based on a high share of renewable energy. The growing amount of variable, weather-dependent generation increases the uncertainty and variability of power flows. In addition, the consumption patterns are changing. In the past, the consumption patterns were highly dependent on outdoor temperatures, but nowadays, the electrification e.g., of transportation, heating, cooling, and industrial processes changes the way that electricity is consumed making its predictability more complex. As the unpredictability of the electricity generation and consumption increases, flexibility mechanisms, electricity storage systems and smart grid technologies will be playing an increasing role in the power system.
The energy transition and its challenges is a widely discussed topic in the literature and presented e.g., in [3]-[7]. The need for flexibility in transmission system planning and especially its need in the long-term planning have been also discussed in the literature, e.g., in [8]-[10]. However, so far, the focus has not been on the flexibility needs and mechanisms from the point of view of outage planning of a transmission system. The integration of a high share of renewable and variable energy sources, such as wind power, also challenges the traditional methods and processes of outage planning.
Planned outages are needed to maintain and develop the transmission system. A transmission system operator (TSO) needs to understand the impacts of planned outages of grid elements to the power flows, grid customers, and to the operational security in advance to be able to schedule and plan the outage sufficiently. Thus, there is a need for methods to estimate power flows in different time frames, in short-, medium-, and long-term. Currently, there is lack of methods capable to consider the changes in the operational environment and to estimate the power flows, voltages and related flexibility needs in the time frame of one to three years prior to a planned outage (referred as mid-term time frame in this paper). To address this challenge, the paper presents a market modeling and time series approach to estimate flexibility needs caused by the thermal overloading of grid elements and / or by voltage level decrease or increase during a planned outage and related contingency condition. The proposed approach is utilized for regional and local planned outage cases to study grid congestions that occur inside a bidding zone. The need for flexibility, especially its amount and characteristics, should be estimated more accurately if flexibility mechanisms are to be used to manage the grid congestions during planned outages.
This paper is organized as follows: Section 2 explains congestion management and flexibility needs in operational planning. Section 3 introduces approaches based on time series to estimate power flows, voltages, grid congestions and related flexibility needs. Section 4 presents an approach based on market modeling and time series to estimate flexibility needs during a planned outage. Section 5 applies the proposed approach for a case study and presents its results. Section 6 evaluates the advantages and limitations of the proposed approach and discusses the development needs of outage planning processes. Section 7 summarizes conclusions.
2. Congestion management and flexibility needs in operational planning
2.1. Flexibility and congestion management
The ongoing energy transition is noticed in the power system as an increasing variability and decreasing predictability, shorter durations of the maximum power flows but higher maximum power flow levels. To be able to operate and plan the power system cost-efficiently, there is an increasing need for flexibility. In the literature, there are various definitions for power system flexibility as discussed e.g., in [11]. As an example, in 1995, CIGRE working group defined power system flexibility as “the ability to adapt the planned development of the power system, quickly and at reasonable cost, to any change, foreseen or not, in the conditions which prevailed at the time it was planned” [12]. As a comparison, in 2019, IEA defined power system flexibility as “the ability of a power system to reliably and cost-effectively manage the variability and uncertainty of demand and supply across all relevant timescales, from ensuring instantaneous stability of the power system to supporting long-term security of supply” [3]. From the point of view of a transmission system operator (TSO), flexibility need may arise from several aspects: power balance, grid congestion, generation adequacy, and security of supply. Flexibility is also needed in different time frames, from fractions of seconds to hours, weeks, months, and years depending on the type of the need. This paper is focused on the flexibility needs caused by grid congestions during a planned outage and related contingency condition. The duration of a planned outage may vary from hours and few days to weeks and months.
Congestion management together with transmission capacity allocation ensures that the power flows remain within the limits of the grid elements. Congestions occur if the grid is not sufficient to transfer electricity from where it is generated to where it is consumed, and the transfer of electricity would violate the operational security limits. Congestions can occur in the transmission grid locally, regionally, nationally and between different bidding zones (cross-zonal). In the context of the paper, local refers to congestion in a single grid element and it impacts only a few loads or generators in specific grid location. Regional congestion may also refer to congestion in a single grid element, it has an impact on a limited geographical area, and it leads to regional consequences impacting several loads or generators in the specific grid locations. National congestions have impact on a large geographical area in the bidding zone, and several generators or loads in multiple grid locations in the bidding zone are impacted. Cross-zonal congestions occur in transmission lines that are connecting different bidding zones. In the Section 5 of this paper, the focus is on analyzation of planned outage cases inside a bidding zone and the target is to estimate flexibility needs caused by regional and/or local grid congestions inside a bidding zone. Estimation of cross-zonal congestions between bidding zones is not in the scope of the paper since the studied cases in Section 5 do not create congestions between bidding zones. The approach presented in Section 4 is focused on the identification of grid congestions caused by thermal overloading of a grid element or by increase or decrease in the voltage level of the region. Identification of flexibility needs caused by other issues, such as power system stability, are not in the scope of this study as the approach presented in Section 4 is not intended to study power system stability issues.
2.2. Flexibility need in operational planning
2.2.1. Operational planning
Traditionally, the planning and operation processes of power systems have been divided into three main processes: 1) grid development, 2) asset management, and 3) system operation [13]. However, in practice, there are various sub-activities on different time horizons and the overlaps and interactions between the main processes are expected to increase in the future [13]. Power system operation is further divided to real time operation and operational planning, the latter being the focus of the paper. Operational planning consists of preparatory phases before real time operation and outage planning, which is needed to maintain and develop the transmission system as well as to schedule the planned outages of grid elements, major power plants, and demand facilities. The TSO is responsible of coordinating and scheduling the planned outages of relevant grid elements, power plants, and demand facilities of its region [14][15]. In addition, as defined in Commission regulation (EU) 2017/1485, each TSO shall participate in the outage coordination of its outage coordination region [14].
The time horizon of operational planning is not specific as it can be done in several time frames, a couple of years, months, weeks, days, or hours ahead. Traditionally, planned outages are scheduled app. one year ahead. However, as the operational environment is changing and significant regional and local changes in the generation or consumption capacities are expected, there is an increasing need to estimate power flows during a planned outage more than a few months or one year in advance, e.g., one to three years prior to a planned outage, to improve the understanding of the TSO of the upcoming situations, to identify the risk of grid congestions and to provide first estimate on the amount of flexibility need during a planned outage. The estimations of flexibility needs are essential for the TSO to have enough time to plan, schedule, develop and implement sufficient solutions. A planned outage of a grid element may require use of new mechanisms by a TSO, that have not been traditionally needed to maintain operational security. Such mechanisms are later discussed in Section 2.2.3. Thus, there is a need for methods capable to consider the changes in the operational environment and to execute power flow estimations one to three years prior to a planned outage.
The forecasting time horizon of one to three years may traditionally have been a part of grid planning and development rather than operational planning. The time horizon of one to three years can be also viewed as the time horizon that remains between the grid planning and the operational planning. However, as also stated by [13], the overlaps and interactions between different planning and operation processes are expected to increase in the future and have already increased. Thus, in this paper, the time horizon from one to three years prior the planned outage (referred as mid-term) is focused and considered as a part of operational planning (outage planning) time frame. Since the unpredictability in the power system is increasing, there is an increasing need to understand the future power flows, generation, and consumption levels more in detail and in advance to have enough time to prepare and implement solutions.
2.2.2. Flexibility needs
An electricity transmission system is usually operated according to the N−1 criterion, which is defined in Commission Regulation (EU) 2017/1485 [14]. In the context of the paper, the flexibility need is caused by grid congestions, which may occur due to a planned outage of a grid element or due to a contingency (“N−1 condition”) during a planned outage. This paper is focused on the estimation of flexibility needs that are caused by the thermal overloading of overhead transmission lines and power transformers or by the violation of voltage limits 1) during a planned outage and 2) in a contingency condition that occurs during a planned outage (referred as related contingency condition). There are several uncertainties related to the operational planning time frame such as the weather and electricity market conditions, which complicate the assessment of flexibility needs.
There are several factors that create uncertainty for the power flow estimations done in the mid-term time frame (one to three years ahead). Firstly, the stochastic nature of most renewable energy sources is one source of uncertainty. Secondly, the consumption patterns are also changing due to electrification. Thirdly, the increasing amount of generation and / or consumption capacity in transmission and distribution grids is also one source of uncertainty since there are uncertainties related to new generation and consumption investments and their schedules. The various forecasting uncertainties have a role in the outage planning done in the mid-term time frame, since there is a need to, firstly, create a scenario that represents the power system accurately enough for the studied time frame but, secondly, also a need to identify the characteristics of short-term variations (hourly, daily) of the power flows. The seasonal and monthly variations of power flows are essential for scheduling of a planned outage and the short-term variations of power flows must be estimated to identify grid congestions and hourly flexibility needs.
2.2.3. Flexibility mechanisms to solve planned outage related grid congestions
In this paper, mechanisms to solve flexibility needs that are caused by grid congestions are referred to as flexibility mechanisms. Flexibility mechanisms to solve local and regional outage planning related grid congestions can be further divided into technical and market-based mechanisms (as presented in Table 1 and in [16]) and into non-market-based mechanisms such as restrictions of active power input into the transmission grid or output from the transmission grid. The practices related to restrictions are dependent on the grid service terms and conditions of a TSO, which usually address the need to restrict or interrupt the grid service due to a maintenance, a modification, or an investment.
| Technical flexibility mechanisms | Market-based flexibility mechanisms |
|---|---|
| Grid investments | Balancing energy market (mFRR, Manual Frequency Restoration Reserve), special regulation |
| Special protection schemes | Tender process of bilateral contracts |
| Temporary switching arrangements | Locational flexibility auctions / markets |
| Dynamic rating of grid components | Market-based flexible connections [17] |
2.2.4. Impact of new energy resources on outage planning processes
Traditionally, outage planning is based on the analyzation of the worst-case scenarios, i.e., the estimated minimum and maximum power flows. This approach is based on the well-known, mainly conventional, temperature-dependent consumption patterns as well as on the full controllability of the output of the conventional, fuel-based generation. The operation of the power system has been rather predictable in the past and thus, a method based on the analyzation of the minimum and maximum power flows was sufficient to schedule and plan outages. These characteristics together with the limited durations of planned outages, typically from few hours and days up to a few weeks, also allowed operational planners to plan the target schedules of the outages so that the operational situation during a planned outage would have minimum impact on system security.
The ongoing energy transition changes fundamentals behind the traditional practices applied in outage planning especially due to two reasons. Firstly, the stochastic nature of renewable energy resources such as wind and solar presents a major obstacle to schedule the outages for a period when the power flows in the region are probably low. Even though the regional consumption patterns would be well-known, forecasting of the power flows reliably more than a few days ahead on regions with high penetration of weather-dependent, renewable generation is extremely challenging. Secondly, the consumption patterns are also changing due to the ongoing electrification. Electrification impacts e.g., industrial processes, transportation, heating, and cooling, and it also creates new investments e.g., in renewable hydrogen. Thus, there will be a wide variety of factors affecting the power generation and consumption. In addition, the geographical locations of the new resources (generation, consumption, storages), will have a high impact on the changes and variability of power flows in regional and local level and thus also on the probability of a grid congestion. There may be regions that are significantly surplus and regions that are significantly deficit. The changes in the operational environment cause a need to re-evaluate the applicability of processes and methods conventionally used in outage planning.
To understand the development needs of outage planning, the factors affecting the characteristics of power flows in the future need to be understood more in detail. Essentially, this implies understanding how new generation as well as new forms of consumption and storage will vary, and which are the main factors affecting their variations. Such information is not available from the traditional approach based only on the assessment of minimum and maximum power flows and historical measurement data. To gain new information about the variations and probabilities of power flows, new methods and approaches are needed, and approaches based on time series can offer a solution.
3. Time-series-based approaches to estimate flexibility needs
The section 3.1. presents approaches based on time series data to estimate power flows, voltages, grid congestions and related flexibility needs in a transmission grid. The section 3.2. discusses the differences between the two approaches and justifies why one of the approaches has been chosen over the other in this paper.
3.1. Approaches based on time series data
Time series data is used to illustrate generation, consumption, and power flows of each transmission line and power transformer of a studied region e.g., on hourly level. It is possible to estimate grid congestions and related flexibility needs from the hourly time series of power flows using information about the ratings of each grid element (temporary and permanent admissible loadings). The time series data can be analyzed to determine in advance 1) which flexibility mechanisms are applicable to solve the identified flexibility need, and 2) is there a need to restrict input into the transmission grid or output from the grid in certain location to avoid grid congestion. The different forecasting uncertainties have a role in the mid-term outage planning (one to three years ahead), where there is a need to, firstly, create a scenario that represents the power system one to three years ahead accurately enough but, secondly, also a need to identify the short-term variations (hourly, daily) of the power flows. In the mid-term outage planning phase, a sufficient level of accuracy is needed, and the estimations done in the mid-term time frame must be specified closer to the planned outage.
Two possible approaches to construct hourly time series data sets to represent future power flows per a transmission line and a power transformer have been identified:
- historical hourly measurement data with modification and/or scaling
- hourly time series data based on the results of a market modeling tool.
In the first option, the historical measurement data sets are modified and/or scaled based on the expected changes to represent a future scenario since the historical data as such no longer represents the future. In the second option, a market modeling tool is used to generate the time series data of consumption, generation, and power flows to represent a future scenario.
3.2. Selection of the applied approach
Historical measurement data of previous years as such does not represent the future power flows especially if significant changes are expected in the coming years in a studied region, e.g., the amount of wind power capacity is significantly increasing. If the historical measurement data sets are used, those need to be modified and scaled to represent a future scenario. Thus, significant assumptions and data modifications would be needed to develop a representative scenario of the studied year. A detailed grid model is also needed to calculate the power flows and voltages during a planned outage and related contingency scenarios to get reliable results as the power flow solution of a contingency scenario during a planned outage may be complex depending on the grid structure. A method to allocate the modified and scaled historical hourly data sets of a year to a grid model would be needed to calculate the power flows and voltages in a studied region precisely, and at the moment, such time series data allocation method does not exist.
Market modeling can be used by TSOs to simulate future power flows between different bidding zones. As a result, market modeling gives hourly generation and consumption values, electricity prices and power flows between the defined areas. Market modeling is used by strategic grid planning, and it has been identified as a suitable method to create and simulate future generation, consumption, and power flows especially in cases where significant changes are expected. As in the historical data approach, a detailed grid model is needed to calculate the power flows and voltages during planned outages and related contingency scenarios to get reliable results. There is an existing process to convert and allocate the results of a market modeling tool to a detailed grid model. In addition, it is possible to easily select studied climate years to consider the variability of weather conditions between different years since there is already an existing database of historical climate years available in the market modeling tool.
In this paper, the approach based on market modeling was chosen due to its suitability to consider changes in operational environment and in electricity market conditions and to create future scenarios. In addition, since market modeling tools are already used by strategic grid planning, there is an existing data base of best estimates and scenarios of future years which may be applied as a basis to create a scenario for a specific planned outage case. In the case studies presented in Section 5, the change in the operational environment is the significant increase of wind power capacity in the studied region.
4. Market-modeling-based approach to estimate grid congestions and related flexibility needs
This section describes the process of the proposed market-modeling-based approach to assess the flexibility needs that are caused by grid congestions during a regional or local planned outage and related contingency condition. The process is divided into four parts: creating the scenario, market modeling, power flow calculation, and flexibility need assessment.
4.1. Description of the overall process
The approach is specifically targeted to study regions, where significant changes in the operational environment are expected such as a high increase in renewable, weather-dependent electricity generation during the next couple of years. In this application, the market-modeling-based approach is used to assess regional power flows, voltages, grid congestions and flexibility needs during a planned outage and related contingency scenario. The aim of the presented approach is to show the value that market modeling and analyzation of time series could provide for outage planning especially in the mid-term time frame, i.e., one to three years prior to the real time operation of a planned outage.
An overview of the process to define power flows and voltages, identify grid congestions and estimate the flexibility needs is presented in Fig. 1. The white boxes represent the initial input data, and the light grey boxes represent the processes that are needed to generate the input data of the flexibility need assessment. The dark grey box represents the last step of the process, the flexibility need assessment. Similar approach has been previously used to study flexibility needs in contingency scenarios in [18], and now in this paper, the approach is applied for outage planning.
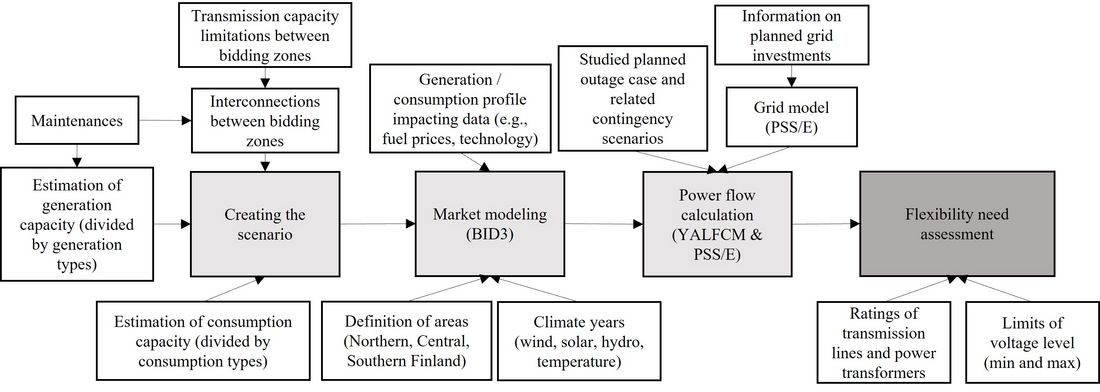
Figure 1 - The process to define the power flows, voltages, grid congestions, and related flexibility needs during a planned outage and related contingency scenarios
4.2. Creating the scenario
The first step of the process is to create a scenario (the best estimate) that represents the studied year. The creation process of the scenario includes estimations of generation and consumption capacities and the interconnection capacities between the bidding zones. Maintenances, such as yearly revisions of nuclear power plants, are included in the initial data of the analysis. Choices and assumptions need to be done in the creation process of the market modeling scenario. As an example, it is difficult to predict one to three years ahead which of the new generation and consumption investments will be finalized according to the original schedule and thus, the generation and consumption capacities will always be best estimations based on the information that is currently available. The choices related to the initial data have impact on the results of the market modeling. The most significant assumptions and choices affecting the results of the studied cases will be discussed later in Section 6.
4.3. Market modeling process
Market modeling is used by TSOs in strategic grid planning to simulate future power flows between different bidding zones, to create different types of scenarios, and to evaluate the need for future grid investments. In strategic grid planning, market simulations can be repeated for multiple climate years to vary wind, solar and hydro power generation conditions, and outdoor temperature dependent demand. In this paper, the market modeling tool is applied for outage planning to study grid congestions and related flexibility needs.
In the paper, the used market modeling tool is BID3, which is a commercial tool developed by AFRY [19]. In the market modeling process, such European countries that impact the cross-border transmissions of Finland are included and modeled. The cross-border transmissions impact on the market-modeling results that the tool gives for Finland. The tool simulates market conditions for each hour of the year and, as an output, it gives the following hourly estimates:
- The electricity generation per defined areas. In the case study of the paper (Section 5), the output gives generation per individual power plant or per generation type divided into Northern, Central and Southern Finland.
- The electricity consumption per defined areas. In the case study of the paper (Section 5), the output gives electricity consumption per consumption type divided into Northern, Central, and Southern Finland.
- The hourly electricity prices per defined areas. In the case study of the paper (Section 5), the model calculates prices for each defined area (Northern, Central, and Southern Finland). However, as Finland is a single bidding zone, flow restrictions in the model are set so, that they do not restrict the power flows between Northern, Central, and Southern Finland and as a result, the electricity price is the same within the whole Finland.
- The power flows between the defined areas. In the case study of the paper (Section 5), the market modeling provides power flows between Northern, Central and Southern Finland, and between Finland and neighboring countries.
4.4. Power flow calculation (YALFCM and PSS/E process)
The results of the market modeling need to be converted and allocated to a detailed grid model to be able to study the power flows of each transmission line and power transformer and the voltage levels. In this conversion process, the time series data of market modeling tool is combined with the detailed power flow calculation capability of a power flow simulation tool PSS/E (a commercial power system simulation software developed by Siemens [20]) utilizing YALFCM (Year Around Load Flow Case Manipulator), which is an in-house tool developed by Fingrid Oyj (the TSO in Finland) and described in [21].
The YALFCM tool takes the results of market modeling as an input and allocates the consumption and generation values to individual load and generation nodes in a PSS/E grid model. The calculation process generates individual PSS/E case files for each hour of the year. At first, a basic situation, i.e., the normal grid condition of the studied year without contingencies, is created. After that, the YALFCM tool can be used to disconnect components in the grid model to study power flows and voltages during planned outages and related contingency conditions for each hour of the year. The most impactful contingencies of the studied planned outage cases are firstly identified by operational planning specialists. The power flow calculation process (YALFCM and PSS/E) is then executed for these identified most impactful contingencies to reduce the number of analyzed contingency scenarios.
Previously, the YALFCM process has been utilized e.g., in Nordic cross-border transmission development projects, in regional power system planning [21] and in a study of operational security cases in Finland [18], and in this paper, it is applied for outage planning use case.
The output of YALFCM and PSS/E process gives power flows of each transmission line and power transformer and voltages of each busbar of a substation as hourly time series for the studied time frame. In the case study (Section 5), the studied time frame is one calendar year. Flexibility need assessment is then performed for the created hourly time series data.
4.5. Flexibility need assessment
The input data of the flexibility need assessment consists of the output data of the YALFCM and PSS/E process (i.e., the power flows and voltages of studied grid elements) and the ratings of each transmission line and power transformer, which are collected from the asset and operation management system of a TSO, and the maximum and minimum voltage limits used by the TSO. A flexibility need assessment is essential to determine the amount, characteristics, variability, and probability of a congestion and a related flexibility need.
The amount of flexibility need caused by thermal overloading can be calculated by comparing the hourly power flow value of a grid component with its thermal rating, i.e., with the permanent admissible transmission loading (PATL), with the temporary admissible transmission loading (TATL) or with a non-firm loading defined e.g., by utilizing dynamic line or transformer rating. The permanent admissible loading refers to the loading that can be accepted by a network branch for an unlimited duration without any risk for the material [22]. The temporary admissible loading is the loading that can be accepted by a network branch for a certain limited duration [22], e.g., for 15 minutes. In the case study presented in Section 5, fixed and predefined values of the temporary and permanent admissible loadings are utilized.
The amount of flexibility need caused by an increase or decrease of voltage level can be calculated by comparing the hourly voltage values with the maximum and minimum acceptable voltage limits used by the TSO.
The flexibility need assessment can be carried out in different time periods, e.g., for the whole calendar year, on monthly level or on periods that represent the duration of a planned outage. If the hourly values of the data set are sorted from the largest to the smallest, duration curves of the flexibility needs are obtained. In this paper, the duration curves are used to show the number of hours (in % from the total number of hours of the calendar year) in which the permanent and temporary admissible loadings of a transmission grid element are exceeded or in which the voltage limit set by the TSO is violated. The characteristics of flexibility activations can be also identified from the hourly power flow data. A flexibility activation refers to the number of consecutive hours in which flexibility need (grid congestion) occurs. The total amount of flexibility activations is first calculated for the studied period and after that, scatter diagrams can be used to illustrate correlations, e.g., between the durations of the flexibility activations and the total energies of those activations.
5. Application of the proposed approach for outage planning – the results of a case study
The purpose of the case study is to demonstrate the applicability of the market modeling approach presented in Section 4 for mid-term (one to three years ahead) outage planning. The approach presented in Section 3 is used to estimate the flexibility needs that are caused by the thermal overloading of a transmission line or a power transformer and / or by decrease or increase in voltage level during a planned outage and related contingency condition. The results of four planned outage cases and four related contingency scenarios are presented and discussed. The results of the case A are described in detail as an example, and the main results of the other cases B, C and D are presented.
5.1. Description of the studied cases
A significantly surplus region in Finland, where the amount of wind power capacity is rapidly increasing, was selected as a case study region. The transmission system in Finland consists of three voltage levels, 400 kV, 220 kV and 110 kV. The main 400 kV transmission lines are running from Northern Finland to Southern Finland. There is generation surplus in Northern Finland and deficit in Southern Finland and thus, electricity is usually transferred from north to south.
In the case studies, the voltages of the transmission lines are 400 kV and 110 kV. A challenging scenario of the studied year was created in the market modeling phase on purpose to evaluate the maximum levels of flexibility needs. The settings of the studied planned outage cases reflect the planned outage scenarios of the Finnish transmission grid, and a real grid model has been utilized in the analysis. The durations of the studied planned outage cases are app. two weeks, but the approach presented in Section 4 is also capable to study planned outage cases with other durations, e.g., from hours to several months, as such. The market modeling and PSS/E calculation process was performed for the data of one calendar year in each studied case. The power flows and flexibility needs were analyzed in four planned outage cases and in four related contingency scenarios, i.e., a scenario where a contingency condition occurs during a planned outage. The studied contingency scenarios represent the most impactful contingencies during the planned outage cases. As a result, the power flows, voltages, and flexibility needs were obtained for all hours of the year in a planned outage condition and for all hours of the year in a related contingency condition.
In three of the cases (A, B and C), the planned outage is on a 400 kV transmission line in a meshed grid. In the case D, the planned outage is on a power transformer (400/110/20 kV). The cases A and D represent local congestions, i.e., one substation is impacted, and the cases B and C represent regional congestions, i.e., several substations of a region are impacted. The studied planned outage cases and related contingency conditions are illustrated in Fig. 2.

Figure 2 - The studied planned outages and related contingency (permanent fault) scenarios. The red and blue arrows illustrate connections to other grid areas
A high amount of wind power capacity is connected to the substations A, C, and D in 110 kV and 20 kV (distribution grid) levels. In addition, there is wind power capacity connected to some of the 110 kV transmission lines which is further increasing the power flows of those 110 kV lines in windy conditions. Electricity consumption in the studied region is very low in comparison with the amount of wind power generation, and thus the region is highly surplus. In the contingency scenarios of the planned outage cases A, B and C, the studied region relies on the transmission capacity of the 110 kV grid causing a risk of thermal overloading of these 110 kV lines. In all studied contingency scenarios, the grid congestion, i.e., thermal overloading and in the cases of A, B and C also decrease of voltage level, is caused by high wind power generation in the region.
In the results presented in Section 5.2. and Section 5.3., the fixed values of temporary and permanent admissible loadings represent the admissible loading of each 110 kV overhead transmission line in a fixed temperature (30 Celsius degrees). The temporary admissible loadings of the studied 110 kV lines are allowed for 15 minutes. In reality, a change in weather condition affects the temperature of the conductor and the line impedances making the loading capability of a transmission line variable.
5.2. Results of the case A
In this section, the results of the case A are presented in detail as an example case. The results presented in this section illustrate the added information that can be obtained using the market modeling and hourly time series approach instead of the traditional approach that is based only on the hourly minimum and maximum scenarios. In the contingency scenario during the planned outage case A, there is a risk of congestion in all three 110 kV transmission lines causing a need for flexibility mechanisms. The power flows of the three 110 kV lines of the case A are presented in this section and referred as TL1, TL2, and TL3 (as defined in Fig. 2). In addition, the voltages of the busbars of the substation A are presented. In the case A, the PSS/E iteration found a reliable result for almost 100 % of the hours of the year (unreliable result for 17 hours).
5.2.1. Results of a 14-day example period
As the estimated duration of the planned outage case A is two weeks in summer season, a 14-day period in summer was chosen from the yearly data as an example to demonstrate the variability of power flows during that time frame and season. Fig. 3 presents the power flow of the TL1 (110 kV) in the planned outage and in the related contingency scenario during a 14-day period. In Fig. 3, the permanent loading of the TL1 is set at 1.0 p.u. and the temporary loading is 1.3 p.u. In addition, the market modeling data of the wind power generation in Central Finland is included and 1.0 p.u. is set at the maximum wind power generation value during the 14-day period.
Fig. 3 shows that during the planned outage, the temporary admissible loading of TL1 is not exceeded. Fig. 3 also shows that in the contingency scenario during the planned outage, the temporary and permanent admissible loadings of the TL1 are exceeded during high wind conditions, which causes grid congestion. It can be also observed from Fig. 3 that during the first 7-day example period there is a flexibility need, and during the latter 7-day period a flexibility need occurs only at the end of the period. When the planned outage is scheduled months prior to its starting date, the wind conditions cannot be known during the 14-day planned outage period. Thus, it is likely that, during a 14-day period, there will be at least few hours where the wind power generation is close to its maximum. In Fig. 3, the power flow of TL1 is, at maximum, 1.4 p.u. higher than its permanent admissible loading. During the 14-day example period, the longest continuous flexibility need (based on the permanent admissible loading of the TL1) is 28 hours in the contingency scenario during the planned outage. It can be also observed that the amount of wind power generation in the region determines whether the temporary and permanent loadings of the TL1 are exceeded.
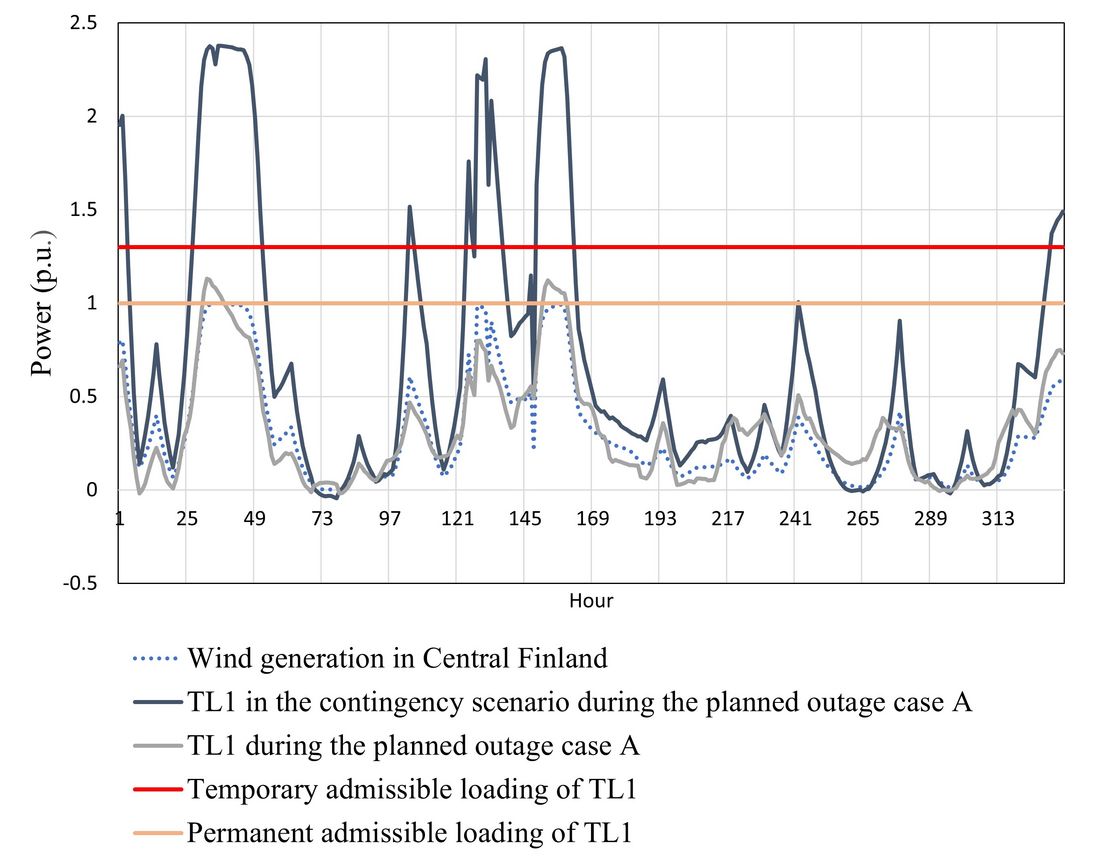
Figure 3 - The power flow of the TL1 in the planned outage and in the related contingency scenario during a 14-day example period
5.2.2. Duration curves of the power flows of TL1, TL2 and TL3
In Fig. 4, the duration curves of the power flows of the whole calendar year are presented for the TL1, TL2 and TL3 in the contingency scenario during the planned outage. The permanent loading of each transmission line is set at 1.0 p.u. and the temporary loading is 1.3 p.u. for each line. Fig. 4 illustrates how many hours of the year (in percentage) the temporary and permanent admissible loadings of the transmission lines would be exceeded in the contingency scenario during the planned outage case A. According to Fig. 4, depending on the transmission line, there would be congestion and flexibility need during 13−33 % of the hours of the year if the temporary admissible loading is used as a reference and during 23−40 % of the hours of the year if the permanent admissible loading is used as a reference instead.

Figure 4 - The duration curves of the power flows of TL1, TL2, TL3 in the contingency condition during the planned outage. The hourly data of whole calendar year is included
5.2.3. Total hourly amount of flexibility need
Flexibility need occurs if the permanent admissible loadings of the transmission lines are exceeded. The amount of flexibility need is firstly calculated individually for each congested 110 kV transmission line TL1, TL2, and TL3. Then, the total hourly amount of flexibility need in the contingency scenario during the planned outage case A can be calculated as the sum of the hourly flexibility needs of TL1, TL2 and TL3. If no flexibility need occurs during the hour, flexibility need is zero (Fig. 5).
Fig. 5 presents the duration curves of the total flexibility need in the contingency scenario during the planned outage case A for the whole calendar year. In Fig. 5, 1.0 p.u. is set at the maximum amount of flexibility need (i.e., the maximum hourly power of the flexibility need during the calendar year) calculated using the permanent admissible loadings of the TL1, TL2 and TL3 as references. The maximum flexibility need based on the temporary admissible loadings is 0.67 p.u., which is also illustrated in Fig. 5. The flexibility need is sorted from the largest to the smallest value based on the flexibility need calculated using the permanent admissible loadings of the lines.
In the contingency scenario during the planned outage case A, the flexibility need occurs during 40 % of the hours of the year if the permanent admissible loadings are used as a reference and during 34 % of the hours of the year if the temporary admissible loadings are used as a reference. The highest difference between the total flexibility need calculated based on to the temporary admissible loading and the total flexibility need calculated based on to the permanent admissible loading is app. 0.4 p.u.
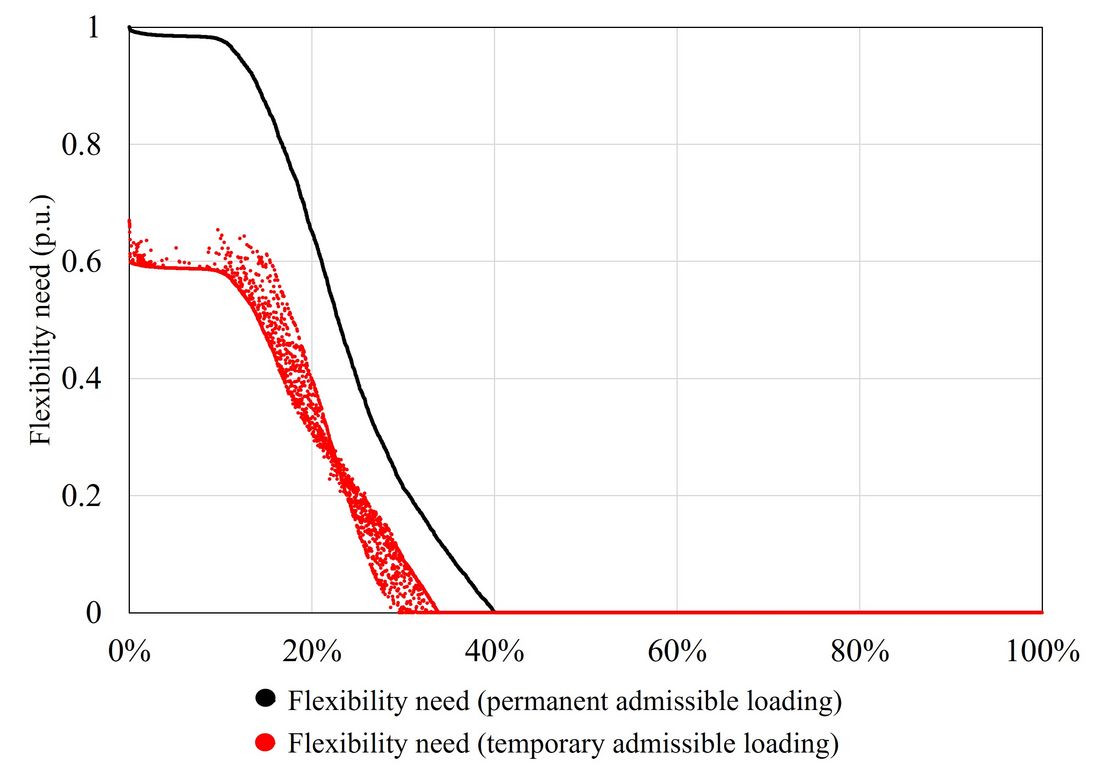
Figure 5 - The duration curves of the total flexibility need in the contingency scenario during the planned outage case A. Data of the whole calendar year is included
Together, Fig. 3 (the 14-day example period), Fig 4. and Fig. 5 (the whole calendar year) indicate that if the contingency scenario during the planned outage case A is realized, a need for flexibility during the time frame of the planned outage (14 days) is likely. Seasonal variations can be also observed in the power flow data of TL1, TL2 and TL3 due to the seasonal variations of wind power generation. In Finland, wind power generation tends to be higher during winter than summer months and thus, in this analysis, the flexibility needs were lower during the summer months than winter months. The scheduling of a planned outage is possible on the seasonal level. If the planned outage of the case A is done in summer season, it is likely having lower impact on system security and the connected parties, wind power generation facilities in this case. However, it is not possible to schedule the planned outage months in advance to a 14-day period in summer where the amount of wind power generation would be constantly low, and no congestion and flexibility need occurs in a contingency scenario. Thus, scheduling is not alone a sufficient method to avoid grid congestion in the contingency scenario of the planned outage case A.
5.2.4. Correlation between the wind power generation and the flexibility need
Fig. 6 illustrates the correlation between the amount of wind power generation in Central Finland (according to the market modeling data) and the flexibility need (Fig. 5) in the contingency scenario during the planned outage case A. The data of the whole calendar year is included in Fig. 6. There is a high correlation between the wind power generation, the power flows of TL1, TL2 and TL3 and the flexibility need. If the wind power generation in Central Finland is app. 52 % or more from the maximum hourly wind power generation value of the studied year, a need for flexibility is always caused (the permanent admissible loadings of TL1, TL2 and TL3 used as a reference). If the wind power generation in Central Finland is app. 60 % or more, a need for flexibility is always caused (the temporary admissible loadings of TL1, TL2 and TL3 used as a reference).
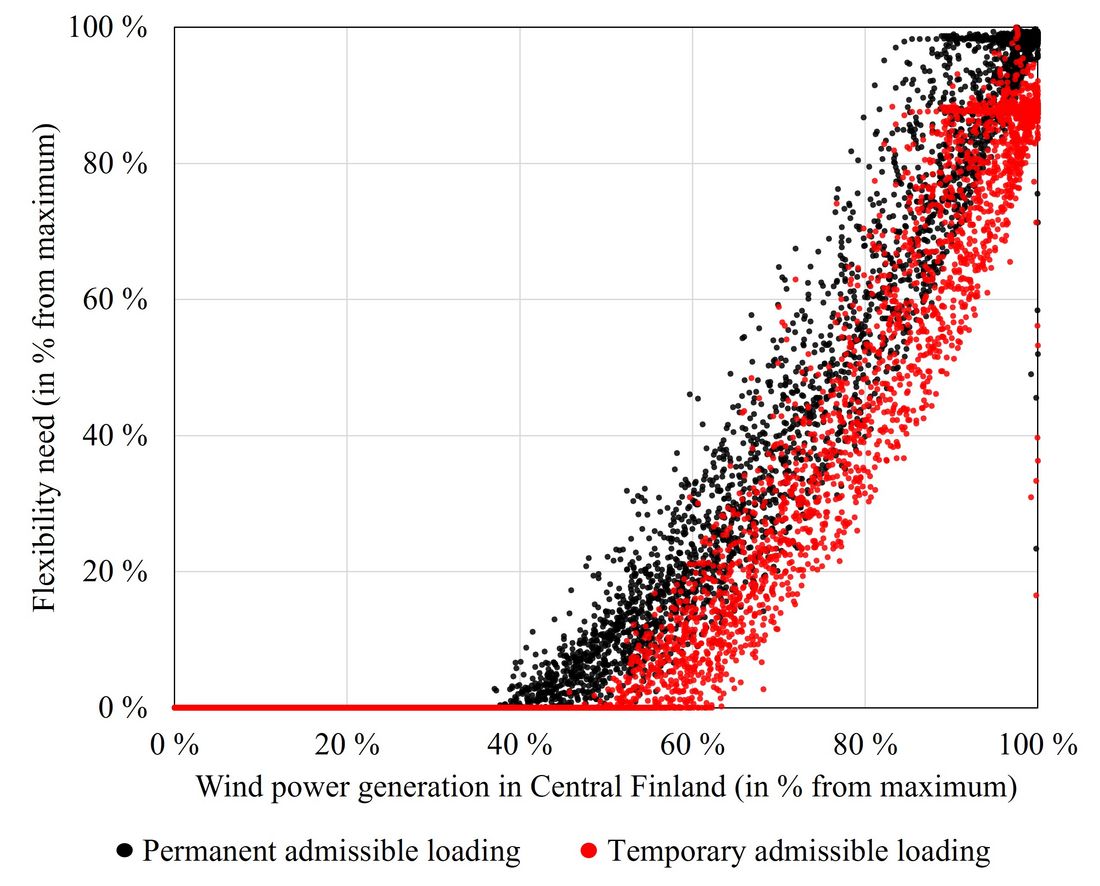
Figure 6 - The correlation between the amount of wind power generation in Central Finland and the amount of flexibility need in the contingency scenario during the planned outage case A
5.2.5. Duration, energy, and hourly maximum power of each flexibility activation
The duration and energy of each flexibility activation can be defined from the time series data of the total flexibility need. A flexibility activation refers to the number of consecutive hours in which flexibility need (grid congestion) occurs. Fig. 7 shows the duration and energy of each flexibility activation in the contingency scenario during the planned outage case A calculated using the permanent admissible loadings of the TL1, TL2, and TL3 as references. In Fig. 7, the data of the whole calendar year is included and 1.0 p.u. is set at the maximum total hourly flexibility need of the year. The total number of flexibility activations would be 218 in the contingency scenario of the planned outage in a calendar year. Fig. 7 shows that in 95 % of the cases, the duration of the flexibility activation is less than 54 hours and its energy less than 36.4 p.u. In 75 % of the cases, the duration of the flexibility activation is less than 22 hours and its energy less than 12.6 p.u. The energies and durations of each flexibility activation tell how continuous the flexibility need would be in a contingency condition and this information can be used in the evaluation of applicable flexibility mechanisms.

Figure 7 - The energy and duration of each flexibility activation in the contingency scenario during the planned outage case A. Data of the whole calendar year is included. 1.0 p.u. is set at the maximum hourly flexibility need of the year
In addition, the maximum hourly power of each flexibility activation can be calculated from the data and used in the evaluation of applicable flexibility mechanisms. The maximum hourly power of each flexibility activation in the contingency scenario during the planned outage case A is presented in Fig. 8. In 36 % of the flexibility activations, the maximum hourly power is between 0.95 p.u. and 1.00 p.u., i.e., 95 % or more of the maximum hourly flexibility need is reached in 36 % of the flexibility activations.

Figure 8 - The duration curve of the maximum hourly power of each flexibility activation. The data of the whole calendar year is included. 1.0 p.u. is set at the maximum hourly power of a flexibility activation
5.2.6. Voltages during the contingency scenario of the planned outage case A
A flexibility need assessment was also executed for the hourly voltages of 400 and 110 kV busbars of the studied region. The voltage results of the Substation A (400 kV and 110 kV busbars) are presented in Fig. 9. During 28 % of the hours of the year, the voltage in the 400 kV busbar decreases below the accepted minimum voltage level in the contingency condition (Fig. 9, left). In the 110 kV busbar, the voltage remains within the accepted minimum voltage level for all hours of the year (excluding few outliers) (Fig. 9, right). The voltage data of the substation B (neighboring substation to the substation A) also showed a decrease of voltage under the minimum accepted voltage level in the contingency condition for 2.6 % of the hours of the year.
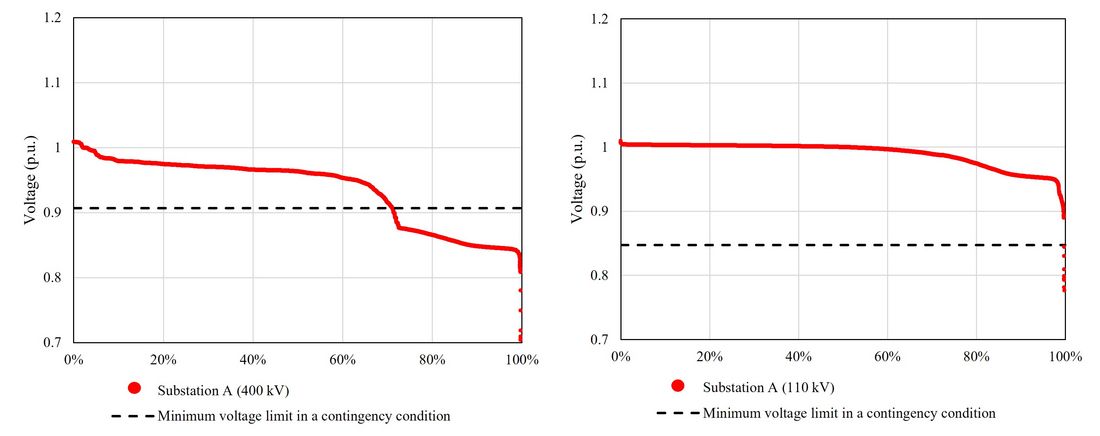
Figure 9 - Left: The duration curve of the voltage in the Substation A (400 kV busbar). The target voltage is set at 1 p.u. and the minimum acceptable voltage in the contingency condition is 0.91 p.u. Right: The duration curve of the voltage in the Substation A (110 kV busbar). The target voltage is set at 1 p.u. and the minimum acceptable voltage in the contingency condition is 0.85 p.u.
The correlation between the total flexibility need due to thermal overloading (permanent admissible loadings as a reference) and the voltage of Substation A (400 kV busbar) is presented in Fig. 10. As expected, the decrease of voltage level in Substation A correlates highly with the total flexibility need caused by thermal overloading and thus it also correlates highly with the amount of wind power generation in the studied area. If flexibility mechanisms such as restrictions of the input of active power of generation facilities connected to the substation A are used to solve the flexibility needs caused by thermal overloading, those restrictions will likely also solve the flexibility need caused by decrease in the voltage level. As a conclusion, the flexibility need caused by thermal overloading of 110 kV transmission lines is more significant issue than the flexibility need caused by the decrease of voltage in the case A.

Figure 10 - The correlation between the total flexibility need due to thermal overloading (permanent admissible loadings as a reference, 1 p.u. represents the maximum value of the total flexibility need) and the voltage of substation A (400 kV busbar, 1 p.u. is set at the target voltage)
5.2.7. Mechanisms to solve the flexibility need in the contingency scenario during the planned outage case A
According to the results of the case A, the flexibility need due to thermal overloading occurs in the contingency scenario during the planned outage if the wind power generation in Central Finland is app. more than half of its maximum. There is a need for flexibility mechanisms to guarantee the N−1 compliance during the planned outage. Since the duration of the studied planned outage case A is app. two weeks, it is not possible to schedule the outage in advance to a period when the amount of wind power generation in the studied region would not be close to the maximum for at least few hours during the two-week period. In such cases, the planning and preparation of the scheduled outage needs to be done considering the maximum flexibility need to avoid overloading and decrease in voltage level and to guarantee the N−1 compliance.
As the amount of flexibility need is high in the contingency scenario during the case A, i.e., both the permanent and temporary loadings are exceeded, there is a need to restrict the input of active power of generation facilities connected to the substation A (in 110 kV and in 20 kV levels) and to the 110 kV lines (TL1, TL2, TL3) into the transmission grid preventively, i.e. restrictions are set for the duration of the planned outage in advance. The restrictions of active power input into the transmission grid could be also combined with market-based flexibility mechanisms by a TSO e.g. if the temporary admissible loadings of the grid components can be used as an enabler of utilization of flexible resources of the region [16], i.e., down-regulation of flexible resources in specific grid locations would be activated in 15 minutes after a contingency condition during a planned outage to avoid exceeding the operational security limits, solve the grid congestion, and to comply with the N−1 criterion.
An advanced scenario of the Case A where the TL1 (110 kV) is in planned outage simultaneously with the TL5 (400 kV) was also analyzed. In the contingency condition of such planned outage, the PSS/E iteration process did not find a reliable power flow result for app. 20 % of the hours of the year. This 20 % represents the hours of the highest wind power generation in the region. The result indicates that in order to comply with the operational security limits and the N−1 criterion during such planned outage scenario, there is a need to either restrict the input of active power into the transmission grid (preventively, prior to the start of the planned outage) and / or a need to implement other flexibility mechanisms in advance, if those are technically possible.
5.3. Results of the case B
The studied region of the case B consists of a larger geographical area than in the case A (as illustrated in Fig. 2). In the contingency scenario during the planned outage case B, congestion occurs in the TL1, TL2 and TL4. As in the case A, the flexibility need correlates highly with the amount of wind power generation in the Central Finland. Fig. 11 shows the flexibility needs of TL1 and TL2 as a sum (left) and TL4 (right). In Fig. 11, 1.0 p.u. represents the maximum amount of flexibility need calculated based on the permanent loadings of the TL1, TL2, and TL4. In Fig. 11, the flexibility need is sorted from the largest to the smallest value based on the flexibility need calculated using the permanent loadings of the TL1, TL2, TL4.
In the contingency scenario during the planned outage, a flexibility need occurs during 37 % of the hours of the year on TL1 and TL2 if the permanent admissible loadings are used as a reference and during 31 % of the hours of the year if the temporary admissible loadings are used as a reference. The highest flexibility need occurs in the same 110 kV transmission line as in the case A (TL1). The high wind power generation in the substation A also causes the flexibility need of the TL4 connected to the substation B. However, the flexibility need of the TL4 is significantly lower than the flexibility needs of the TL1 and TL2. In the case B, the PSS/E iteration process of the power flow calculation did not find a reliable result for 2 % of the hours of the year.
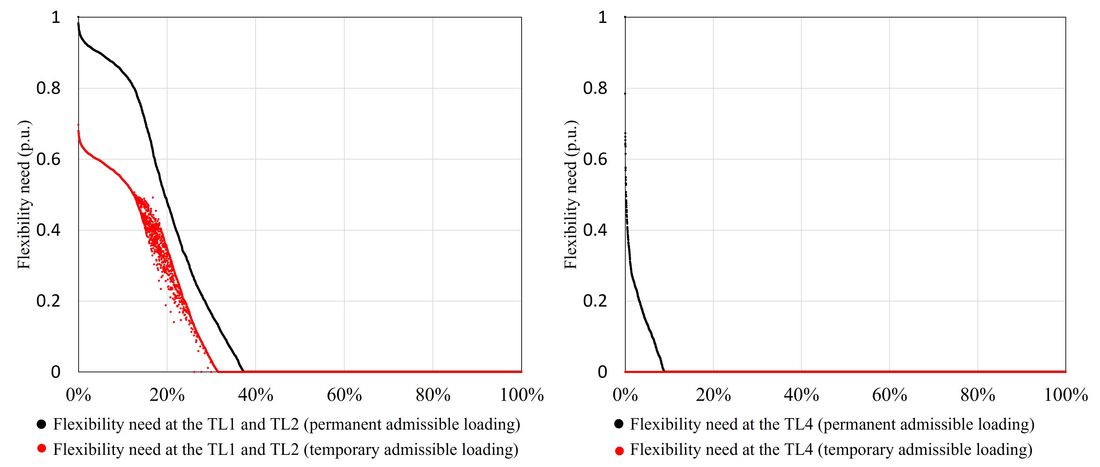
Figure 11 - The flexibility needs at TL1 and TL2 (as a sum, left) and TL4 (right) in the contingency scenario during the planned outage case B
Fig. 12 shows the voltage data of the Substations A and B in the case B (400 kV busbars). During 28 % of the hours of the year, the voltages in the 400 kV busbars of the substations A and B decrease below the accepted minimum voltage level in the contingency condition. In the 110 kV busbars of the substations A and B, the voltage remains within the acceptable minimum voltage level for 98 % of the hours of the year.

Figure 12 - The duration curve of the voltage in the Substation A (400 kV busbar, left) and the Substation B (400 kV busbar, right). The target voltage is set at 1 p.u. and the minimum acceptable voltage in the contingency condition is 0.91 p.u.
The decrease of 400 kV voltage level in Substation A and B correlates highly with the total flexibility need caused by thermal overloading in TL1, TL2 and TL4 and thus it also correlates highly with the amount of wind power generation in the area. If flexibility mechanisms such as restrictions of the input of active power of generation facilities connected to the substation A are used to solve the flexibility needs caused by thermal overloading, those restrictions will likely also solve the flexibility need caused by decrease in the voltage level. As a conclusion and similarly to the case A, the flexibility need caused by thermal overloading of transmission lines is more significant issue than the flexibility need caused by decrease of voltage in the case B.
5.4. Results of the case C
In the case C, the iteration process of the power flow calculation in the PSS/E did not find a reliable result for app. 20 % of the hours of the year in the contingency scenario during the planned outage. It was observed from the data of the contingency scenario during the case C that if the wind power generation is extremely high (app. above 90 % from its maximum), the power flow and voltage results of the PSS/E iteration process are not reliable. This result indicates that the power flows and voltages of the studied contingency scenario are very challenging to manage if the wind power generation in the region is close to its maximum. Thus, there is a need to implement flexibility mechanisms and / or to set restrictions of active power input into the transmission grid in advance in relevant grid locations (preventively, for the duration of the planned outage) to comply with the operational security limits and the N−1 criterion during the planned outage.
5.5. Results of the case D
In the case D, the planned outage is on the power transformer T1 of the substation A (see Fig. 2). In the related contingency scenario, the T2 of the substation A is in a fault during the planned outage. As a result, in the contingency scenario during the case D, the third power transformer of the substation (T3) may become congested due to the high wind generation capacity connected to the substation A.
Fig. 13 presents a duration curve of the T3 in the contingency scenario during the planned outage. In Fig. 13, the rating of the T3 is fixed and set at 1.0 p.u. The maximum power flows are 1.1 p.u. higher than the fixed rating of the T3. Flexibility need occurs during 35 % of the hours of the year and it is highly dependent on the amount of wind power generation connected to the substation A.
A fixed rating of the power transformer T3 was used as a simplification. However, the loading capability of a power transformer varies and is dependent on the outdoor temperature. Thus, the dynamic rating of the power transformer may provide a partial solution for the flexibility need in the case D depending on the weather conditions. The use of dynamic transformer rating and its impacts has been studied e.g., in [23],[24]. The voltage in the Substation A (400 kV and 110 kV busbars) remained within the operational security limits for all hours of the year.
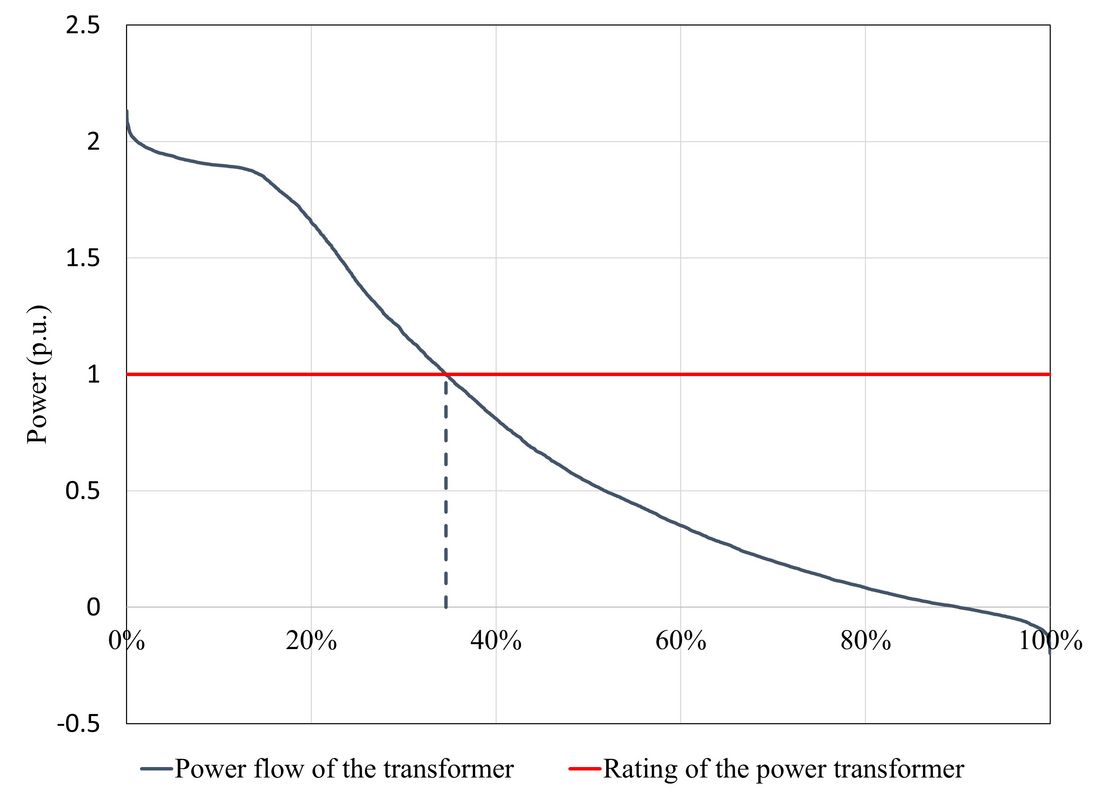
Figure 13 - Duration curve of the power flow of the power transformer T3 in the contingency scenario during the planned outage case D. Data of the whole calendar year is included
6. Discussion
6.1. Advantages of the presented approach
The most significant advantage of the proposed market modeling approach is that it allows detailed analysis on the characteristics and variability of the power flows, voltages, grid congestions and related flexibility needs within the studied time frame. The case studies presented in Section 5 showed that the market modeling approach is well suited to study regional and local planned outage cases and related contingency scenarios to determine which transmission lines and power transformers of the region are congested, how much, how long time and how often. Such detailed level of information cannot be obtained using the traditional approaches of outage planning, i.e., analyzing only the minimum and maximum scenarios. The approach is especially suited to study cases where the generation and / or consumption and the power flows are variable and unpredictable, and the historical measurement data of previous years does not reflect the future power flows.
In addition, the market modeling approach can be used to study correlations between different variables. In the case studies presented in Section 5, the most significant correlation was the correlation between the wind power generation and the power flows of the transmission lines. Moreover, the approach is also capable to show the correlations between the flexibility needs caused by thermal overloading and the flexibility needs caused by violation of voltage limits. In addition, the approach can be used to study which one, thermal overloading or violation of voltage limits, is more significant issue and whether solving the flexibility need caused by thermal overloading simultaneously solves the flexibility need caused by violation of voltage limits.
The case studies were performed on the mid-term time frame (one to three years prior to the planned outage) and the approach was sufficient to estimate flexibility needs and its characteristics during a planned outage and related contingency condition. The obtained estimations of power flows, voltages, and grid congestions can be utilized in the decision-making regarding the seasonal or monthly level timing of the planned outage and the preliminary selection of feasible flexibility mechanisms. The presented approach is capable to reveal seasonal and monthly level variability of power flows and help outage planning specialists to set a tentative schedule for the planned outage. As the power system is becoming more complex, the seasonal and monthly level variations of power flows may no longer be obvious which might have been the case in the past. The flexibility need assessment done in the mid-term time frame provides a starting point for outage planning and the analysis needs to be specified closer to the planned outage.
The paper was focused on the outage planning use case of the proposed approach. However, the approach is not only applicable for planned outages but, in general, for analyzation of a condition where a permanent fault is followed by another permanent fault (“N−2 analysis”).
The market modelling tool was applied to study planned outage cases in the transmission grid of Finland. In general, the approach is suitable to study other countries if a detailed grid model (PSS/E) is available. Different countries may have country-specific details or conditions that need to be known and considered when applying the approach for another country.
6.2. Limitations of the presented approach
Since the presented approach is not in operational use in outage planning, there are still some issues related to its usability. Currently, one disadvantage of the approach is that the preparation and data allocation of the scenarios, and the flexibility need assessment both require manual work. Due to the required manual work, the proposed approach can be, at the moment, used only for a few climate years, planned outage cases and related contingency scenarios. However, in operational use in outage planning, the whole process should be automated, and the requirement of manual work would no longer be an issue.
The contingency scenarios may also be such complex that the PSS/E iteration is unable to find a reliable solution for all hours of the year, as it was detected in the case C and in the more complex variation of the case A. This may cause some unreliability to the results of the flexibility need assessment. However, if the PSS/E iteration process does not find a reliable solution and there are no errors in the used grid model, it is usually a strong indication that the studied contingency scenario during a planned outage is very complex. Thus, thermal overloading of grid components and / or violation of voltage limits is likely if flexibility mechanisms and / or restrictions of active power input into the grid / output from the grid are not used.
The case studies presented in Section 5 show that the approach is suitable for studying local and regional grid congestions inside a bidding zone that are caused by thermal overloading of transmission lines and power transformers and / or by violation of voltage limits. The flexibility needs that are caused e.g., by power system stability issues were not in the scope of this study. However, in some planned outage cases and related contingency scenarios, grid stability issue, especially due to converter-connected generation, may cause higher flexibility needs than the need caused by the thermal overloading. In the overall outage planning process of a TSO, the flexibility needs caused by power system stability need to be also identified.
6.3. Assumptions and choices affecting the initial data and the results of the case study
The results of the case studies are dependent on the choices and assumptions that were necessary to create the market modeling scenario. There are uncertainties and assumptions related to the initial data that is used in the market modeling process, since the flexibility need assessment is done in the mid-term time frame, one to three years prior to the planned outage. The most significant assumption that impacts the results of the case studies presented in Section 5 is the amount of wind power capacity in the region during the studied year. An assumption (the best estimate) was required as it is extremely difficult to predict one to three years in advance, which of the new wind power generation investments will be finalized and in full operation according to the original planned schedule. A challenging scenario, i.e., high amount of wind power capacity, was created on purpose to evaluate the maximum level of flexibility need in the selected cases. In addition, as a simplification, it was assumed that the wind power capacity remains stable during the whole calendar year, which is not the case in practice.
As explained in the Section 5, fixed values of the permanent and temporary admissible loadings were utilized in this study. However, the loading capabilities of both, high voltage overhead transmission lines and power transformers, are variable. Dynamic rating could be used to solve the flexibility need partially or fully depending on the characteristics and amount of the need. In addition, it should be noted that the ratings of current transformers need to be checked as a part of the outage planning process as it may also become a limiting element.
6.4. Future developments
A method to define the characteristics of flexibility needs and the variability of power flows is a prerequisite to be able to fully utilize the potential of flexibility mechanisms in the outage planning of a transmission grid. Flexible resources (generation, consumption, and storages) connected to the transmission and distribution grids may be capable of providing flexibility, i.e., down- or up-regulation at the request of a TSO. The presented approach based on market modeling and time series data provides added information especially for planned outage cases where the power flows of a region are variable and unpredictable. As a future development, the usability of the presented approach should be improved by reducing the amount of manual work related to the use of the YALFCM tool and the flexibility need assessment. There is an ongoing development project to automate the YAFLCM process and improve its usability.
Overall, the processes of outage planning need to be developed in different time horizons to enable efficient outage planning and decision-making. The approach presented in this paper addresses the current lack of methods of a TSO to study power flows and to estimate flexibility needs in a time horizon of one to three years prior to a planned outage. The power flow and flexibility need estimations obtained using the presented approach provide a starting point for the decision-making in the outage planning process. For example, if the nature of the flexibility need during a planned outage is low, i.e., the power flows are over the permanent admissible loadings but under the temporary admissible loadings, and short in duration, market-based flexibility mechanisms could provide a solution. However, if the nature of the flexibility need in the contingency condition during a planned outage is high, i.e., power flows exceed the temporary admissible loadings, the need is rather continuous and likely, other mechanisms such as the restrictions of active power input into the transmission grid / output from the transmission grid in relevant grid locations are needed. Furthermore, combinations of several types of flexibility mechanisms to manage grid congestions may be considered by a TSO in the operational planning phase as discussed in [16]. As an example, the use of restrictions may be combined with the utilization of market-based flexibility mechanisms such as locational flexibility procurement [16]. To be able to utilize and combine different flexibility mechanisms in the future, the characteristics of the flexibility need should be defined, and the presented market modeling approach provides a solution for this task in the mid-term time frame.
To be able to accurately define the amount of flexibility need, it is essential to improve the estimate of the flexibility need closer to the planned outage. An improved estimate of the power flows, voltages, and flexibility needs should be executed by a TSO e.g., from weeks to six months ahead of a planned outage to specify the amount and characteristics of the flexibility need and to determine which flexibility mechanisms will be utilized. This estimate will be further improved when the short-term forecasts (from a day to a week ahead) are available. The resolution of these short-term forecasts should also be lower than one hour, e.g., 15 minutes. If market-based mechanisms are a part of the solution, the specifications of the procurement need to be defined well in advance. These specifications include e.g., amount, location, time frame, activation time and type, remuneration mechanism, verification, and settlement processes.
A short-term (from hours to a day and to a week ahead) forecast of the power flows and generation surpluses or deficits in the region is needed for the final decision-making. The short-term forecast can be used to make final adjustments to the plan of the scheduled outage if the forecasted power flows differ from the previously anticipated, e.g., the conditions have changed due to an unexpected reason and there is a need for more or less flexibility than originally forecasted.
As the variability and unpredictability in the power system increases, also new ways to consider the probabilities and risks need to be developed. As the results of the case studies of the generation surplus regions showed (Section 5), the flexibility need is likely in the studied contingency scenarios of the planned outages and the power flows of the studied cases correlate highly with the amount of wind power generation. However, the realization of a contingency condition during a planned outage is extremely unlikely. This problematic setting of two probabilities, an extremely unlikely contingency but a rather likely flexibility need in the contingency condition, complicates the planning of scheduled outages. It creates a need for a TSO to define basic principles that are followed to decide between applicable flexibility mechanisms and restrictions but also a need to define in which circumstances the preparation is executed according to the worst-case scenario and in which circumstances some level of risk is acceptable, i.e., the N−1 compliance is not completely guaranteed during a planned outage.
In addition to the methodological development needs, there will be an increasing need to coordinate the use of flexible resources between the TSOs and the DSOs especially if both utilize market-based mechanisms. For example, if a flexible resource or an aggregated group of flexible resources located in the distribution grid are activated due to the congestion management need of a TSO, the activation of these resources should not cause further congestions in the distribution grid. In congestion management, it is also essential to know the location of the flexible resource, i.e., from the perspective of a TSO, the connection point of the flexible resource to the transmission grid.
7. Conclusions
In this paper, an approach based on market modeling and analyzation of time series data was presented to estimate power flows, voltages, grid congestions and flexibility needs that are caused by a planned outage and related contingency scenario. The advantage of the proposed approach is that it allows a detailed time series analysis of the characteristics and variability of grid congestions and related flexibility needs while the traditional outage planning approach is not capable of providing such information. The results of a case study of four planned outage cases and four related contingency scenarios in a significantly surplus region in Finland were presented to demonstrate the applicability of the approach in practice. The results of the case study show that the proposed approach is capable of considering regional and local changes in the operational environment and estimating the power flows, voltages, grid congestions and flexibility needs in the context of outage planning in the mid-term time frame. As a future step, the usability of the presented approach should be still improved to become a part of outage planning processes. A method to estimate the grid congestions and related flexibility needs is a prerequisite to be able to fully utilize the potential of flexibility mechanisms in outage planning in the future.
Acknowledgment
The authors gratefully acknowledge the contributions of Eveliina Seppälä (Fingrid Oyj) to the market modeling part of this work.
This project (OneNet) has received funding from the European Union’s Horizon 2020 research and innovation programme under grant agreement No 957739.
References
- European Union, “Clean energy for all Europeans,” Publications Office of the European Union, Luxemburg, 2019. [Online]. Accessed: 24.3.2023.
- European Commission, “Fit for 55 package,” Press release of the European Commission, July 2021. [Online]. Accessed: 24.3.2023.
- International Energy Agency (IEA), “Status of power system transformation 2019: power system flexibility,” IEA, 2019. [Online]. Accessed: 24.3.2023.
- E. Hillberg et al., “Flexibility needs in the future power system,” publication prepared for International Smart Grid Action Network (ISGAN), March 2019. [Online]. Accessed: 24.3.2023.
- O.M. Babatunde., J.L. Munda, Y. Hamam, “Power system flexibility: A review,” Energy Reports, vol 6, supplement 2, pp. 101-106, 2020.
- J. Cochran et al., “Flexibility in 21st century power systems,” NREL, 2014. [Online]. Accessed: 24.3.2023.
- A. Akrami, M. Doostizadeh, F. Aminifar, "Power system flexibility: an overview of emergence to evolution,” Journal of Modern Power Systems and Clean Energy, vol. 7, no. 5, pp. 987-1007, September 2019.
- E. Lannoye, D. Flynn, M. O'Malley, “The role of power system flexibility in generation planning,” 2011 IEEE Power and Energy Society General Meeting, pp. 1-6, 2011.
- N.E. Koltsaklis, A.S. Dagoumas, I.P. Panapakidis, “Impact of the penetration of renewables on flexibility needs,” Journal Energy Policy, vol. 109, pp- 360-369, 2017.
- J. H. Zhao, J. Foster, Z. Y. Dong, K. P. Wong, “Flexible transmission network planning considering distributed generation impacts,” IEEE Transactions on Power Systems, vol. 26, no. 3, pp. 1434-1443, Aug. 2011.
- M. Z. Degefa, I. B. Sperstad, H. Sæle, “Comprehensive classifications and characterizations of power system flexibility resources,” Electric Power Systems Research, vol. 194, May 2021.
- CIGRE WG 37.10, Methods for planning under uncertainty: toward flexibility in power system development, Electra, pp. 143-163, 1995. REF. ELT_161_11
- S.R. Khuntia, B.W. Tuinema, J.L. Rueda, M.A.M.M. van der Meijden, “Time-horizons in the planning and operation of transmission networks: An overview,” IET Generation, Transmission and Distribution, 10(4), pp. 841-848, 2016. [Online]. Accessed: 24.3.2023.
- Commission Regulation (EU) 2017/1485 of 2 August 2017 establishing a guideline on electricity transmission system operation.
- Regulation (EU) 2019/943 of the European Parliament and of the Council of 5 June 2019 on the internal market for electricity
- S. Peltoketo, A. Kuusela, A.-J. Nikkilä, T. Mäkihannu and T. Rauhala, "Utilization of flexibility mechanisms in regional outage planning of transmission systems," 2022 IEEE PES Innovative Smart Grid Technologies Conference Europe (ISGT-Europe), 2022, pp. 1-6
- A. Kuusela, L. Ala-Mutka, A.-J. Nikkilä, S. Peltoketo and T. Rauhala, "Flexible connection concept and planning studies for its piloting in a transmission system," 2022 IEEE PES Innovative Smart Grid Technologies Conference Europe (ISGT-Europe), 2022, pp. 1-6.
- A. Summanen, “Regional flexibility demand in the Finnish power system,” Master’s Thesis, Department of Electrical Engineering, Aalto University, 2021.
- AFRY, “BID3: AFRY’s power market modelling suite,” [Online]. Accessed: 24.3.2023.
- Siemens, “PSSE – high-performance transmission planning and analysis software,” [Online]. Accessed: 24.3.2023.
- J. Tonteri, “Utilization of an electricity market model in regional power transmission system planning,” Master’s Thesis, Department of Electrical Engineering, Aalto University, 2014.
- Entso-e. “Policy 3: Operational security”, Entso-e, Operation Handbook, Policy 3, ap-proved by SC on 19 March 2009. [Online]. Accessed: 24.3.2023.
- T. Zarei, K. Morozovska, T. Laneryd, P. Hilber, M. Wihlén, O. Hansson, “Reliability considerations and economic benefits of dynamic transformer rating for wind energy integration,” International Journal of Electrical Power & Energy Systems, vol. 106, pp. 598-606, 2019.
- M. F. Lachman, P. J. Griffin, W. Walter, A. Wilson, "Real-time dynamic loading and thermal diagnostic of power transformers," IEEE Transactions on Power Delivery, vol. 18, no. 1, pp. 142-148, Jan. 2003.