Experiences with 100% Wind Power Generation in an Isolated Power System – Suðuroy, Faroe Islands
Authors
H.M. TRONDHEIM, T. NIELSEN - R&D Department, Power Company SEV, Denmark

Summary
The Faroe Islands are aiming for a 100% renewable electricity production by 2030. In order to reach this goal, one step was to install a wind power plant in the isolated grid of the most southern island Suðuroy. Suðuroy has an annual demand of 37 GWh with a peak demand of 8 MW and a mean demand of 4 MW. The wind farm installed is 6.3 MW, and thus it can supply the whole island depending on the demand and the wind speed. The high penetration of wind power initiated investments in a battery system (6.3 MW/7.5 MWh) and a synchronous condenser (8 MVA). The paper analyses and discusses the experiences gained by running with 100% wind power generation in Suðuroy. Examples of disturbances are included, as well as general observations. This study shows that with the right equipment, it is very possible to run with 100% wind power generation.
Keywords
Wind power - isolated power system - power system stability - 100% inverter-basedNomenclature
SEV The Power Company in the Faroe Islands
WP Wind power
PV Photovoltaic
HP Hydro power
HFO Heavy fuel oil
BS Battery system
SC Synchronous condenser
IBG Inverter-based generation
PDF Probability density function
1. Introduction
One crucial step toward a 100% renewable electricity sector is to enable and ensure a stable and safe operation of the power system with a high penetration of variable inverter-based generation. Subject to this, one important step is to translate current research in inverter dominated power systems into real hands-on projects.
Suðuroy, the most southern island in the Faroe Islands, and is electrically isolated from the other islands. The consumption in 2022 was 37 GWh, of which 20 GWh were produced by heavy fuel oil (HFO), 12 GWh wind power (WP), 5 GWh hydro power (HP) and <1 GWh photovoltaic (PV) power, i.e. ~46% renewable.
The islanded power system of Suðuroy runs frequently with 100% instantaneous wind power generation. Thus, this is an important step in reaching the vision of 100% renewable electricity generation in the Faroe Islands by 2030.
Previous analysis have studied the power system of Suðuroy in terms of, analysing the impact of IBG to frequency and voltage based on simulations [1], the wind power plants impact on the frequency [2], the voltage and frequency stability towards 2030 based on simulations [3] and finally a study using both measurements and simulations [4]. This study aims to give an overall view of the experiences going from 100% synchronous generation to 100% IBG.
1.1 The Power System of Suðuroy
The first WP plant in Suðuroy was installed late in 2020. The power plant consists of seven 900 kW wind turbines, i.e. 6.3 MW in total. In addition to this, the generation in Suðuroy consists of 3 MW HP, 13 MW HFO and 0.26 MW of PV panels. The average load in 2020 was 4 MW, with a peak of 8 MW and minimum of 2 MW. In order to accommodate the high penetration of wind power, a battery system (BS) of 6.3 MW/7.5 MWh and a synchronous condenser (SC) of 8 MVA were installed in 2022. A single line diagram of the power system can be seen on Figure 1 [3].
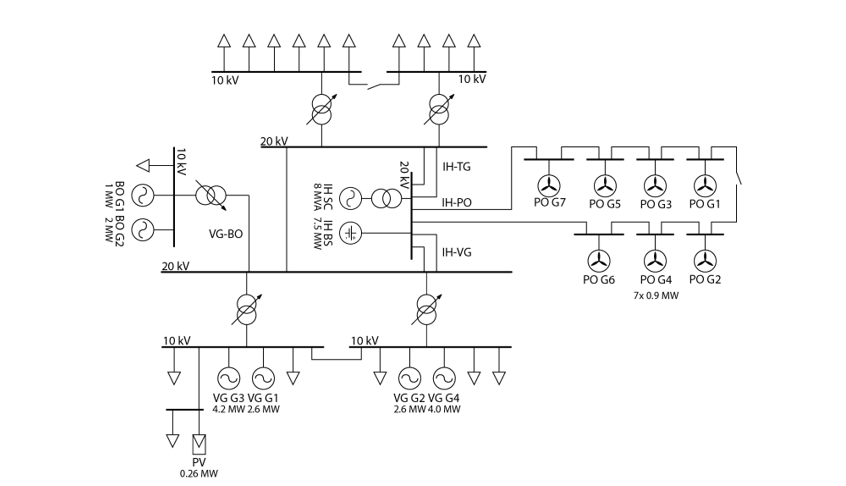
Figure 1 - Single line diagram of the power system of Suðuroy. The diagram shows the generator units, i.e. hydro (BO G1-BO G2), thermal (VG G1-VG G4), wind turbines (PO G1-PO G7), the battery system (IH BS) and the synchronous condenser (IH SC) together with the loads, lines, transformers and busbars [3]
The BS has been sized to be able to supply the whole island for 1 hour when fully charged, which means that there is enough time to start HFO engines, in case the WP production drops, whilst the HFO engines are offline. This can be due to a sudden change in wind speed and/or direction. In case the WP production picks up again in a reasonable amount of time, the island can also be supplied by the BS, instead of turning the HFO engines on, during the lack of WP production. The BS is primarily used for frequency regulation.
A conservative approach has been used to size the SC, as the SC has been sized to contribute with the same amount of short circuit power as the thermal power plant. This is in order to ensure enough short circuit power during high load when the thermal power plant is offline.
The wind turbines are set-point regulated, and thus, do not contribute to frequency and voltage stability. The PV produces based on the irradiation and a cosϕ of 1. The thermal and hydro generators are equipped with automatic voltage regulators and governors, but the secondary control is manual.
1.2 Paper Purpose and Structure
The purpose of the analysis is to uncover the impact that the WP plant has had on the frequency and voltage in the power system of Suðuroy, with and without the BS and SC.
Section 1 is an introduction to the study and the power system, whilst section 2 introduces the methods and materials used. The analysis of the system is divided into two sections, "3. Operation Examples", which gives short term examples from the operation and "4. General Observations", which shows the general impact of the WP, BS and SC on the system frequency, voltage and potential wind energy utilisation. The final section of this paper is the conclusion.
2. Methods and Materials
This section briefly describes the approach of the analysis in this paper. The data measurements and acquisition used in the analysis are also introduced.
2.1 Analysis Approach
This analysis includes operation examples, i.e. seconds to hours, which are investigated by qualitative observations. The behaviour of the different components in the grid is visualised using plots with data measurements and then described in text. The measurements used are frequency, voltage, active and reactive power.
The general impact of WP and BS/SC to the power system is analysed using quantitative statistical approaches over longer periods, i.e. several months. More specifically this includes e.g. probability density functions (PDF), mean and standard deviations. The general observations are made by comparing frequency and voltage measurements from the power system of Suðuroy during three nine months periods, all from September to May:
- 2019-2020: Before the wind turbines were installed.
- 2021-2022: The period with wind turbines but without BS and SC.
- 2022-2023: After the BS and SC have been put into operation.
Additionally the utilisation of the potential wind energy on a monthly basis is presented.
2.2 Data Measurements and Acquisition
Loggers are installed on every synchronous generator, battery system, wind power plant, synchronous condenser and the main busbars to measure current, frequency, voltage, active power and reactive power. The devices used to measure these parameters are listed in Table 1 together with the acquisition and software. The measuring frequency is 10 Hz, but since this analysis includes a data set of a total 27 months, i.e. 700 mio. measurements per variable with a sampling frequency of 10 Hz, the sampling has been reduced to 1 Hz.
| Name | Application |
|---|---|
DEIF MTR-3F-215 | Voltage and frequency measurements |
Camille Bauer CAM | Current and power measurements |
Yokogawa MX100 | Data acquisition system |
CAD Computer MCPS 7 | Software |
3. Operation Examples
Interesting measurements from different operation examples have been obtained since the BS and SC were commissioned. This section describes a commissioning test of the BS, an unexpected outage of a hydro turbine, a sudden loss of all the power production and a few hours with unstable wind conditions.
3.1 Commissioning Test
The BS was commissioned in August 2022, and Figure 2 shows measurements from the first time both the HFO and HP were switched off, and all of the electricity production was therefore based on WP and PV power. The figure shows a) the grid frequency, b) voltage at VG 20 kV, c) active power production of VG G2 and BO G1 (HFO and HP), d) reactive power production of VG G2 and BO G1, e) active WP production, f) reactive WP production, g) active power of BS and SC and finally h) reactive power of BS and SC. The reactive power control of the wind farm was set to 0 Mvar during the commissioning test. There are no fast sampled measurements of the PV production, and therefore it is not included in the figure, however; during this period the PV production peaked at 220 kW.
There is no indication that switching the HFO and HP off impacts the grid frequency, but there is a small voltage drop when the synchronous generators, especially VG G2, are switched off. The voltage is measured at VG 20 kV, and while VG G2 is connected to VG 10 kV, BO G1 is connected to BO 10 kV, which is 6 km from the VG substation/power plant. The reactive power output of the BS increases when the other units go offline, and thus compensates for them. The active power of the BS increases, when the WP generation starts to fluctuate more and decrease. If desired, it is possible to tune the regulator of the BS to obtain a even smoother frequency, but this would increase the wear and tear of the BS and the benefits are limited; if any. Overall, this commissioning test proves that the system can operate on 100% steady state IBG, without having a negative impact on the frequency and voltage of the system.
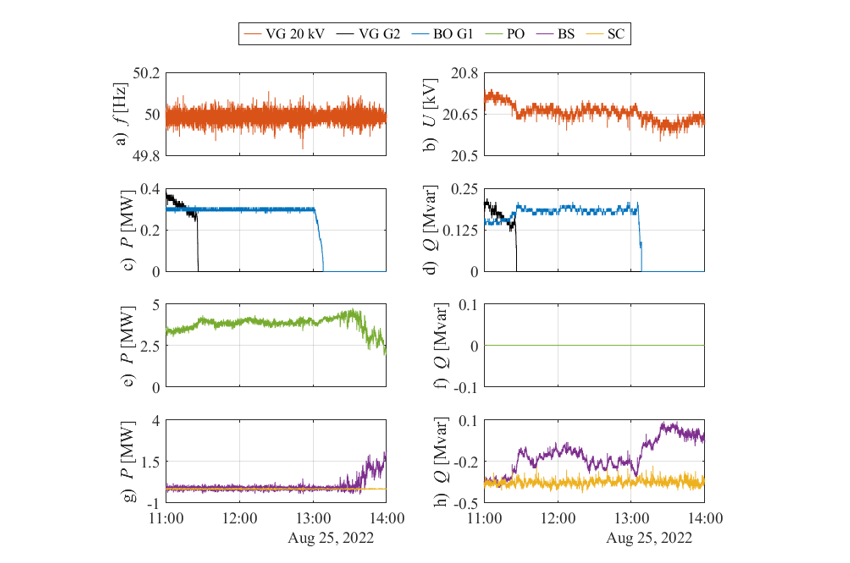
Figure 2 - Commissioning test on the 25th of August 2022. First time running with 100% inverter-based generation. a) VG 20 kV busbar frequency, b) VG 20 kV busbar voltage, c) VG G2 and BO G1 active power, d) VG G2 and BO G1 reactive power, e) PO active power, f) PO reactive power, g) SC and BS active power and h) SC and BS reactive power
3.2 Hydro Turbine Outage
During the period of commissioning and testing, an unexpected outage of one of the hydro turbines occurred, and the responses from the other units online are seen on Figure 3. The generation from the hydro turbines are not included in the plot, due to a communication error and thus lack of available fast sampled measurements of BO G1 and BO G2. However, BO G1 was producing 0.4 MW and BO G2 was producing 1.1 MW, but due to some error, an outage occurred on BO G2. This outage corresponds to around 20% of the total production, which is also clear in the significant frequency drop. The PV panels were producing around 140 kW.
In this example the difference in the contribution of the SC and BS is quite clear. The SC is faster and delivers the inertial response and then goes down to 0 MW again, while the BS is a bit slower, but keeps delivering active power until the frequency has reached around 49.85 Hz. The wind conditions are stable during this event, and the wind turbines are not contributing in terms of stabilisation of the grid frequency. VG G3 also delivers an inertial response, but is maybe a 1/3 of the synchronous condenser, which is a larger machine with a higher inertia. This example shows that the system could handle a synchronous generation loss of 20% already in August 2022, when the BS was commissioned and tested.
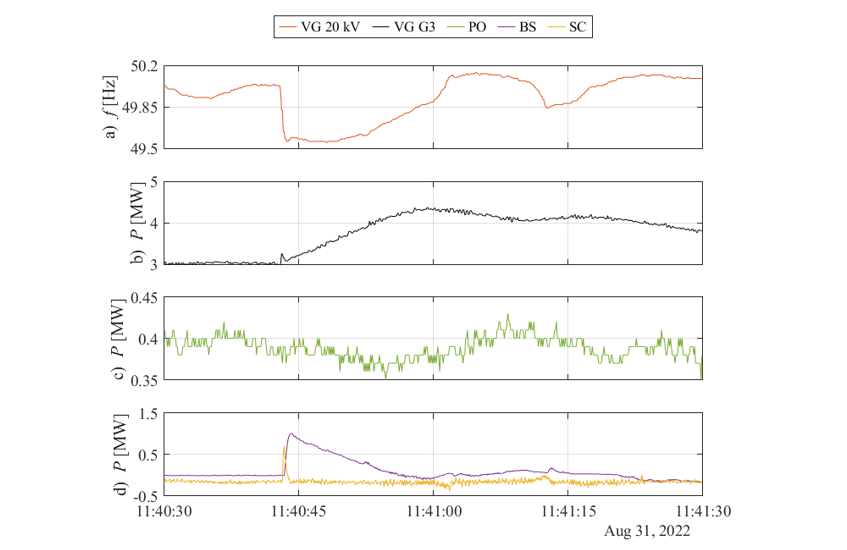
Figure 3 - a) Frequency at VG 20 kV, b) active power of VG G3, c) active WP, d) active power of BS and SC during the outage of BO G2
3.3 Full Production Drop in 15 seconds
The system on Suðuroy is frequently running on 100% IBG, i.e. either WP and PV power or just WP. An example of 100% wind power is shown in Figure 4. As shown in the figure, the WP suddenly drops to 0 MW within 15 seconds, and since WP is the only production in the grid at this specific moment, this corresponds a full production loss. This particular case was a control error, but similar occurrences have been due to unstable wind conditions.
The frequency is clearly impacted by the sudden loss of production, but it stabilises quickly as the BS starts discharging. The response of the SC is not included here, as it is not significant, due to the fact that the production drop happens over 15 seconds. In this case the power capacity of the BS is a vital component in riding through the disturbance.
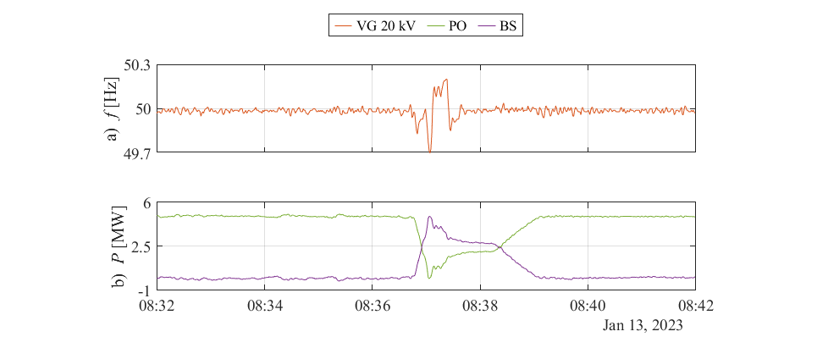
Figure 4 - a) Frequency at VG 20 kV and b) WP and BS active power during a loss of full production within 15 seconds
3.4 Unstable Wind Conditions
Sudden variations in the WP production are not uncommon, and Figure 5 shows an example of a day with varying wind conditions and thus production. The figure shows a period of four hours with multiple significant drops in the WP production. During this period one of the hydro turbines, BO G2, is also online and the PV production peaks at 200 kW.
The variations in the WP are reciprocated in the BS, and thus a stable frequency output is maintained. However, this requires a lot from the energy capacity of the BS, and around time 15:15 the battery starts charging. By looking at plot b) it is clear that the operator increases the output of BO G2 to charge the BS, hence; the battery is charged with renewable energy. In this example both the power and storage capacities of the BS are important, as the fluctuations are large and over a long time.
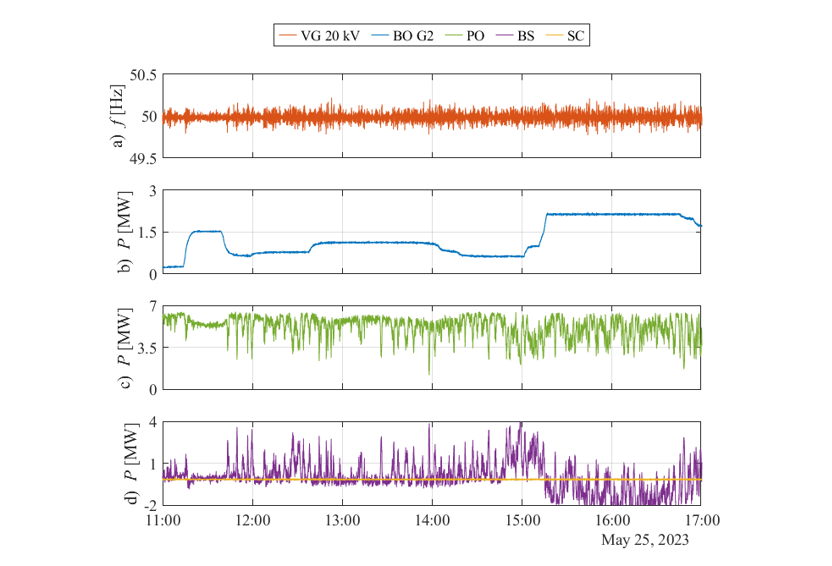
Figure 5 - a) Frequency at VG 20 kV, b) active power of BO G2, c) active WP and d) BS and SC active power
4. General Observations
The general observations of the experiences with a high penetration of wind power in Suðuroy are discussed based on the utilisation of the potential wind energy, the distribution of the frequency measurements and the fluctuations in the voltage measurements.
4.1 Wind Utilisation
The utilisation of the potential WP production has increased significantly since the SC and BS were commissioned, which allowed for 100% wind and PV power production from September 2022, see Figure 6. The figure shows that between January 2022 and August 2022, the utilisation of the potential wind energy was between 20% and 40%, while it from September 2022 to May 2023 was between 70% and 90%, with the exception of January 2023 and February 2023. The reason for this is that the BS was out of service for some weeks for control updates. The present curtailment is due to the mismatch between the wind and the demand.
Increasing the utilisation also increases the overall wind energy shares, and thus renewable shares of the production. In March 2022 the potential wind energy was higher than the total consumption, however the wind energy shares were 34%, which is the highest shares prior to the BS and SC in Figure 6, while the shares in May 2023 were 64%. March 2022 had a wind energy potential of 2.7 GWh and a total consumption of 2.5 GWh, while May 2023 had a wind energy potential of 2.3 GWh and a total consumption of 2.6 GWh. In October 2022 the thermal power plant was offline for 22 days in total, whilst over 10 days the production was 100% IBG.
The SC was installed in the spring of 2022, but it was not until the BS also was in operation, that the wind utilisation and wind/renewable shares increased, due to the fact that HFO was needed online for sufficient frequency reserves.

Figure 6 - Monthly utilised wind energy, potential wind energy and total consumption from January 2022 to May 2023
4.2 Frequency Distribution
The probability density function (PDF), n, of a normal distribution is given by (1), where σ and µ are the standard deviation and mean of variable X [5].
(1)
Calculating the PDFs of the frequency measurements for the different periods and comparing them, gives a good indication of how the distribution of the frequency has changed from one period to another period. The PDF has been used to describe the distribution of the frequency measurements in Suðuroy in previous publications [2], [3]. The conclusion in these publications is that the wind power generation has had a negative impact on the frequency distribution, as the standard deviation increased from 47 mHz, 49 mHz and 48 mHz in 2018, 2019 and 2020, respectively, to 88 mHz in 2021, when the wind farm was in operation. No other significant changes were made in the power system during this period. The BS and SC have now been in operation for a few months, and thus, it is possible to investigate, which impact this has had on the on the frequency distribution.
Figure 7 a) shows the distribution of the measured frequency (x-axis) with the probability density on the y-axis, where the variable X in (1) in this case is the grid frequency measured in Hertz. It is clear that the distribution of the frequency measurements increased when the wind farm was installed, similarly to what [2], [3] showed. However, since the BS and SC have been installed the distribution has become narrower, even more than prior to the wind farm. The standard deviation is given in Table 2 together with the mean. The mean is slightly shifted from 50.00 Hz in all cases, and this is due to measurement inaccuracies. The shift is also visible in the figure. The standard deviation was 60 mHz in September 2019-May 2020, increased to 90 mHz in September 2021-May 2022 and decreased to 40 mHz in September 2022-May 2023. This highlights that not only have the BS and SC improved the frequency distribution caused by the wind farm, but to a degree that it is 33% better than before the wind farm.
Plot b) on Figure 7 shows the probability of the occurrences of the measurements with a resolution of 10 mHz. The improvement is even more visible in this plot, and it is quite clear that the BS regulates within a deadband, which the majority of the measurements are in.
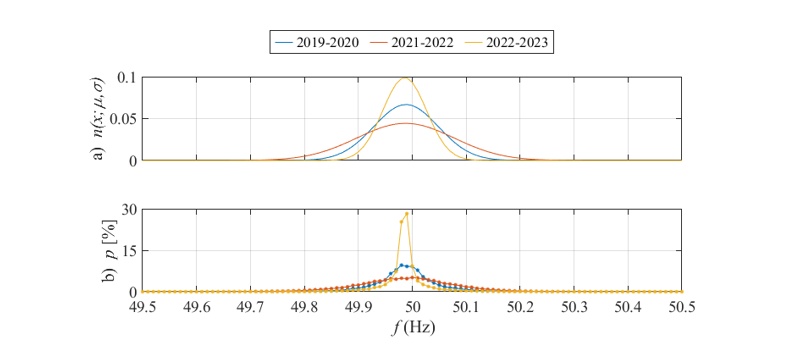
Figure 7 - a) Probability density functions based on mean and standard deviation from frequency measurements. b) Probability of occurences of frequency measurements
| Period | 2019-2020 | 2021-2022 | 2022-2023 |
|---|---|---|---|
μ (Hz) | 49.99 | 49.99 | 49.99 |
σ (mHz) | 60 | 90 | 40 |
4.3 Voltage Fluctuations
A distribution of the voltage, does not give the same insight into the impact of the WP on the voltage, as it does on the frequency. The reason is that the voltage set-point at a specific busbar changes, depending on the production mixture and the load. Therefore the mean and standard deviations will naturally change, and these are the two variables forming a normal distribution, as seen in (1).
Instead of investigating the distribution of the voltage measurements, the voltage measurements are investigated by the fluctuations from one second to another. This was also done in an investigation of the wind power impact based on simulations [1].
Figure 8 shows the duration curves of the voltage fluctuations in the three study cases. Similarly to the frequency, the worst case, i.e. with the most voltage fluctuations, is the case with WP generation but without the BS and SC (2021-2022), while the best case is the system with WP, BS and SC. The impact of the wind farm to the voltage fluctuations is not as significant as in the frequency distribution, i.e. the two graphs are quite similar, but there are some differences. The wind farm is expected to have a higher impact on the frequency than the voltage, as the reactive power of the wind farm is set-point regulated.
In Table 3 one can find the mean, max and standard deviation of the voltage fluctuations. In addition to this, the amount of fluctuations above 20 V/s are given in percentages. The fluctuations above 20 V/s are significantly decreased from 16% to 2% of the time. By comparing these values to Table IV in [1], one can see that the simulations underestimate the maximum fluctuations, while both the mean, standard deviation and fluctuations above or equal to 20 V/s are similar. However the simulation case in [1] is for 4.5 hours, while the measurements are for 9 months.

Figure 8 - Duration curves of the voltage fluctuations
| Period | 2019-2020 | 2021-2022 | 2022-2023 |
|---|---|---|---|
μ (V/s) | 11 | 13 | 6 |
max (V/s) | 990 | 980 | 950 |
σ (V/s) | 14 | 15 | 7 |
≥ 20 V/s (%) | 10 | 16 | 2 |
5. Conclusions
The experiences with a high penetration of wind power in Suðuroy shown in section 3, show that with a relatively large SC and BS, it is possible to run 100% IBG without problems both during steady state operation and disturbances. Section 4 showed that the WP had a negative impact on the frequency distribution and voltage fluctuations, but the contribution of the BS and SC has resulted in a narrower frequency distribution and less voltage fluctuations than prior to the wind farm. The sizes of the BS and SC could however likely be optimised, but examples shown here show the contribution of both the SC, and the energy and power capacity of the BS. Overall it can be said that running 100% IBG is possible, which e.g. was done in Suðuroy for a total of 10 days in October 2022.
References
- H. M. Tróndheim et al., “Frequency and Voltage Analysis of the Hybrid Power System in Suðuroy, Faroe Islands,” in Proceedings of Virtual 5th International Hybrid Power Systems Workshop, Energynautics, 2021.
- H. M. Tróndheim and T. Nielsen, “A wind power plant’s impact on the grid frequency - Analysis of Measurements in an Electrically Isolated Island with High Penetration of Inverter-Based Wind Generation,” in Proceedings of 6th International Hybrid Power Systems Workshop, Energynautics, 2022, pp. 6–9.
- H. M. Tróndheim et al., “Frequency and Voltage Stability Towards 100 % Renewables in Suðuroy , Faroe Islands” CIGRE Science & Engineering, vol. 25, no. June 2022, pp. 1–20, 2022.
- F. Baccino and M. Santarelli, “Advanced Battery Energy Storage Systems for Hybrid Power and Energy Management,” in Proceedings of the 7th International Hybrid Power Plants and Systems Workshop, Energynautics, 2023.
- R. E. Walpole, R. H. Myers, S. L. Myers, and K. Ye, Probability & Statistics for Engineers Scientists Probability & Statistics for Engineers & Scientists, 9th ed., vol. 6. Essex, England: Pearson Education Limited, 2007. [Online]
