Integrating Green Hydrogen Systems and Emission Control Strategies in Electricity Markets: Case of Alberta and Ontario
Authors
Anshul GOYAL, Kankar BHATTACHARYA
Department of Electrical and Computer Engineering, University of Waterloo, Canada

Summary
This paper presents a novel, Green Hydrogen Systems (GHSs) integrated, Uniform Marginal Price (UMP)-based Day-Ahead Market (DAM) framework and the mathematical model for electricity market auction. The wholesale electricity market participation of GHSs, comprising electrolyzers, storage tanks and fuel cells, is examined considering their bids and offers for charging and discharging modes, respectively. The GHS considered in this work is based on a Power-to- Power (P2P) configuration with two operating cycles: (a) charging mode (Power-to-Hydrogen (PtH) using an electrolyzer) and (b) discharging mode (Hydrogen-to-Power (HtP) via a fuel cell unit). The market auction mathematical model, formulated as a Mixed Integer Programming (MIP) problem, is implemented on the IEEE 24-bus Reliability Test System (RTS), with inclusion of Renewable Energy Sources (RES), and taking into account operational, energy arbitrage and physical constraints of market entities such as consumers, gencos, RES and GHSs. To support transition toward achieving a net-zero Greenhouse Gas (GHG) emissions grid, the emissions from different market supply participants are considered by including a carbon pricing term in the auction model. Two real systems with distinct characteristics, Alberta and Ontario provinces of Canada, are considered to demonstrate the working and benefits of the proposed framework and market model. Results depict the role of carbon pricing and GHSs in achieving a net-zero CO2 emissions grid, and their impact on Market Clearing Prices (MCPs), dispatch schedules and system emissions for each province. Detailed sensitivity analyses are carried out to evaluate the performance of the model considering RES uncertainties and to examine the impact of inclusion of GHS in the DAM with varying values of emission control strategies (emission cap and carbon pricing), and further by varying the GHS operational characteristics.
Keywords
Carbon pricing, day-ahead electricity market, emission, green hydrogen system, uniform marginal priceNomenclature
Blocks of gencos offers,
Blocks of consumer bids,
Buses,
Generators (gencos),
Hydro generators
Solar (PV) facilities,
Time (hour),
Green hydrogen system units,
Wind generation facilities,
Efficiency of GHS charging/discharging operation, %
Maximum number of hydrogen moles produced by the electrolyzer, mol
Maximum number of hydrogen moles consumed by the fuel cell, mol
Maximum pressure of the GHS storage tank, Pa
Maximum power of the electrolyzer, MW
Maximum power generated by the fuel cell, MW
ℜ Constant of gases, JK−1mol−1
Minimum pressure of the GHS storage tank, Pa
Minimum power of the electrolyzer, MW
Minimum power generated by the fuel cell, MW
Consumers bid price in DAM, $/MWh
Carbon pricing in DAM, $/tonnes
Gencos start-up/shut-down cost, $
Gencos energy offer price in DAM, $/MWh
GHS charging/discharging bid/offer price in DAM, $/MWh
Solar (PV) energy offer price in DAM, $/MWh
Wind energy offer price in DAM, $/MWh
Gencos emission factor, tonnes/MWh
Minimum thermal energy content of hydrogen, MW/mol
Average temperature of the GHS storage tank, K
Volume of the GHS storage tank, m3
1, if GHS charging/discharging, 0 otherwise
Number of hydrogen moles produced by electrolyzer (GHS charging), mol
Number of hydrogen moles consumed by fuel cell (GHS discharging), mol
Demand cleared in DAM, MW
Gencos offer cleared for energy in DAM, MW
GHS charging power (electrolyzer) in DAM, MW
GHS discharging power (fuel cell) in DAM, MW
Solar (PV) generation cleared in DAM, MW
Wind generation cleared in DAM, MW
Pressure of the GHS storage tank, Pa
1, if gencos start/shut-down, 0 otherwise
1. Introduction
Carbon dioxide (CO2) emissions from the energy sector increased by 321 Mt in 2022, exceeding the past years’ and climbing to a new level above 36.8 Gt globally [1]. The largest contributors to this increase were from the electricity and heating sectors, raising concerns and a challenge to find innovative and sustainable solutions. Most countries have set a vision of net-zero Greenhouse Gas (GHG) emissions [2] by 2050; however, based on current trends, many of them are lagging in meeting the targets, even for 2025. The ongoing effort to support the transition to a decarbonized system is to deploy large-scale Renewable Energy Sources (RES); but even after the remarkable increase in deployment of RES, it still seems impossible to achieve decarbonization targets.
In this context, hydrogen emerges as a potential solution to meet the CO2 emission reduction targets. It is a flexible energy carrier with potential applications in several fields [3] and is expected to be a ground-breaking technology for a sustainable world [4]. Currently, deployment of hydrogen-based technologies in the power system has been to a limited extent only, because of their low overall efficiency, high Levelized Cost of Energy (LCoE), limited scale of production of electrolyzers and fuel cells and lack of government policies or incentives. However, with advancements in fuel cell technology and hydrogen storage methods, it is anticipated that by 2030 the LCoE for hydrogen will be at par with RES [3]. Furthermore, initiatives such as the (US) Inflation Reduction Act of 2022 (IRA 2022) [5] and the (US) Hydrogen Earthshot programme (‘111’ Hydrogen Shot) [6] are attracting a lot of investors and industrialists to deploy hydrogenbased energy systems. It is anticipated that hydrogen can potentially help achieve a decarbonized economy.
In [4], a solar-based Electric Vehicle (EV) charging station with hydrogen integration, as an energy storage alternative, is developed. The model considered energy and exergy-based thermodynamic analysis for performance evaluation. The paper examined two operational periods: (a) hydrogen production using electrolyzer during daytime via solar-based station, and (b) power generation through hydrogen fuel cells during low output periods of solar energy. The results demonstrate the relationship between hydrogen production, PV panel area and EV charging station capacity. Despite incorporating thermodynamic aspects and green electricity production, the developed model is not suitable for electricity market applications because it does not include any appropriate bid/offer structure or market settlement model. Reference [7] presented a multivariate coupled economic model for a hydrogen system wherein RES coupled with off-peak electricity are considered for hydrogen production. A scheme is proposed therein, to determine the range of off-peak electricity consumption hours. The economic model takes into account the cost of carbon related to off-peak electricity utilization. Reference [8] presented a techno-economic review of hydrogen systems focusing on their operation in multiple sectors as flexible assets.
In [9], the performances of Battery Energy Storage System (BESS) and hydrogen system are evaluated for a single dwelling application with PV installation. The results demonstrate that BESS allows more PV energy to be utilized by the load as compared to the hydrogen system, mainly due to the lower round-trip efficiency of the latter. Reference [10] evaluated the economic viability of hydrogen storage and BESS (Li-ion) in Poland. The operating profits and net present values for both kinds of storage technologies were compared wherein it was concluded that based on current cost metrics and efficiencies of both technologies, BESS was more profitable as compared to hydrogen storage systems for short-term operations due to their higher efficiency and lower cost. However, based on decarbonization pathways released by different system operators globally and governmental initiatives (as discussed earlier), there is a need for alternative sources of energy in addition to BESS for achieving a decarbonized economy wherein hydrogen is considered to be a promising technology and is projected to be an essential part of the emissions reduction plan and the decarbonized supply mix of the future [11, 12, 13].
From the literature review, it can be noted that several works have been proposed for analyzing the environmental and economic impact of hydrogen systems. Some works examine their integration with renewables in microgrids or in single dwelling applications. However, while most of the works consider the emission, cost, coupling with RES and carbon capture, they neglect the operational and physical characteristics of a Green Hydrogen System (GHS) and its components. Some works suggest the participation in hydrogen markets for low carbon hydrogen production and their deployment for multiple applications. However, there are no reported works, to the best of the authors’ knowledge, that proposes a framework or model for participation of GHSs in wholesale electricity markets.
In this paper, the authors propose a framework and appropriate market design to integrate GHSs in the electricity markets, to explore their role in achieving a net-zero CO2 emissions grid [2] in an operational time frame. Furthermore, a comprehensive sensitivity analyses is carried out to examine the model performance under RES uncertainties and to investigate the effect of inclusion of GHS in the DAM with different emission control strategies, such as emission cap and carbon pricing, and furthermore examine the effect of varying GHS operational characteristics i.e. storage tanks’ initial moles content.
The work presented in this paper is carried out with the assumption that only GHS, and no other competing energy storage technologies such as BESS, compressed air energy storage, thermal storage, etc. are considered in the electricity markets under study. The two real systems, Alberta and Ontario provinces of Canada, are considered to examine the benefits of the proposed framework and market model wherein the current supply mix of technologies are included.
The remainder of the paper is organized as follows: Section 2 presents an overview of GHS based on Power-to-Power (P2P) configuration, the proposed GHS integrated market framework and the detailed mathematical model for Uniform Marginal Price (UMP)-based Day-Ahead Market (DAM) including operational, energy arbitrage and physical constraints of market entities. Case studies, results and analyses are presented in Section 3 while Section 4 draws the main conclusions of this work.
2. GHS integrated UMP-based DAM framework and auction model
2.1 Overview of GHS: P2P configuration
Hydrogen system can be broadly categorized into three stages: hydrogen production, hydrogen storage and lastly, stored hydrogen utilization. Figure 1 illustrates the typical layout of P2P system and its components, which comprises an electrolyzer, hydrogen storage tanks and the fuel cell [8, 14, 15].
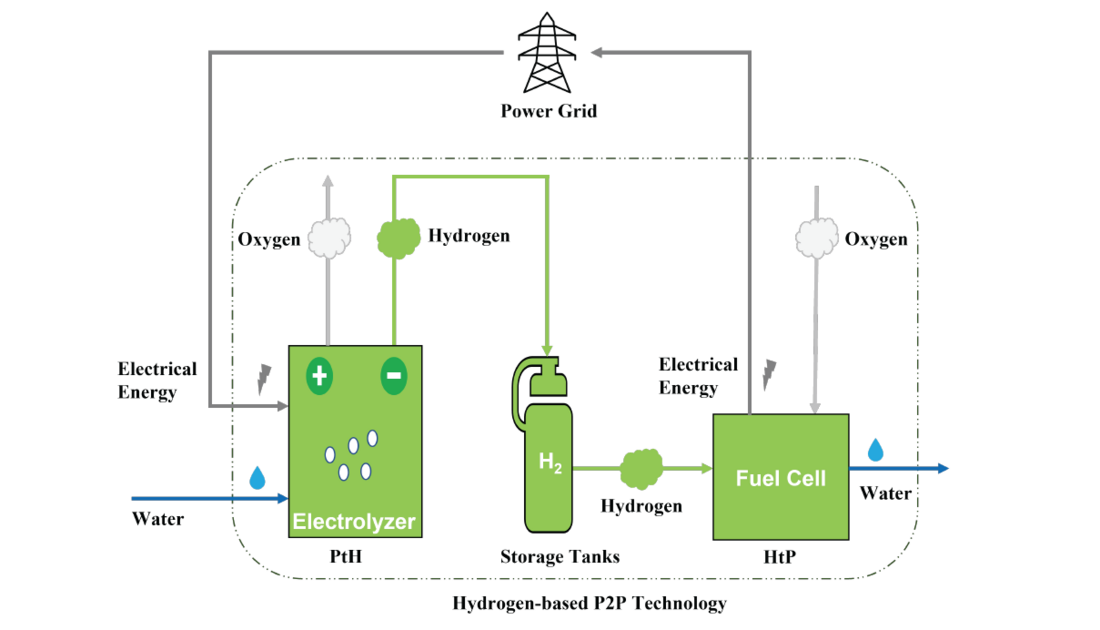
Figure 1 - Typical Layout of Hydrogen Power-to-Power (P2P) Configuration
Similar to other energy storage systems, this system also operates mainly in two modes, which are as follows:
- Charging Mode: In this mode, the P2P facility utilizes electrical energy from the grid to produce hydrogen via electrolyzer (Power-to-Hydrogen (PtH) process) and store it. In charging mode, the P2P facility needs to pay for the electricity drawn from the grid.
- Discharging Mode: In this mode, the stored hydrogen is extracted and used to produce the electrical energy, typically through a fuel cell (Hydrogen-to-Power (HtP) process). In this mode, the P2P facility is paid for the energy supplied to the grid.
If RES are utilized to supply the electrical energy for the electrolysis, then the hydrogen so produced is labelled as green hydrogen due to the fact that the whole process would be net-zero CO2 emissions and the system can be termed as Green Hydrogen System (GHS).
2.2. Proposed GHS integrated DAM framework
In this paper, a novel framework is proposed to enable GHS participation in the DAM as a market participant. The GHS considered, comprises of three major components: electrolyzers, storage tanks and fuel cells. A grid-scale, independently owned GHS participates in the DAM auction by submitting bids (in price-quantity pairs) to buy energy and offers (in price-quantity pairs) to sell energy to the Independent System Operator (ISO). Other market participants also submit their bids/offers to the ISO based on their functionality such as consumers submit buy bids for energy, gencos submit sell offers for energy, RES submit sell offers for energy, etc. Once the bids and/or offers are received from various market participants, the ISO settles the DAM to release the market settlement outcomes. In this work, the market settlement is carried out by considering a double-auction UMP-based DAM, which is formulated as a Mixed Integer Programming (MIP) optimization model. The outputs of the model comprises Unit Commitment (UC) decisions, dispatch schedules of generators and loads, GHSs charging and discharging operations, Market Clearing Prices (MCPs) and total emissions.
2.3. GHS integrated UMP-based DAM auction model
2.3.1. Objective function
To maximize the social welfare, given as follows:
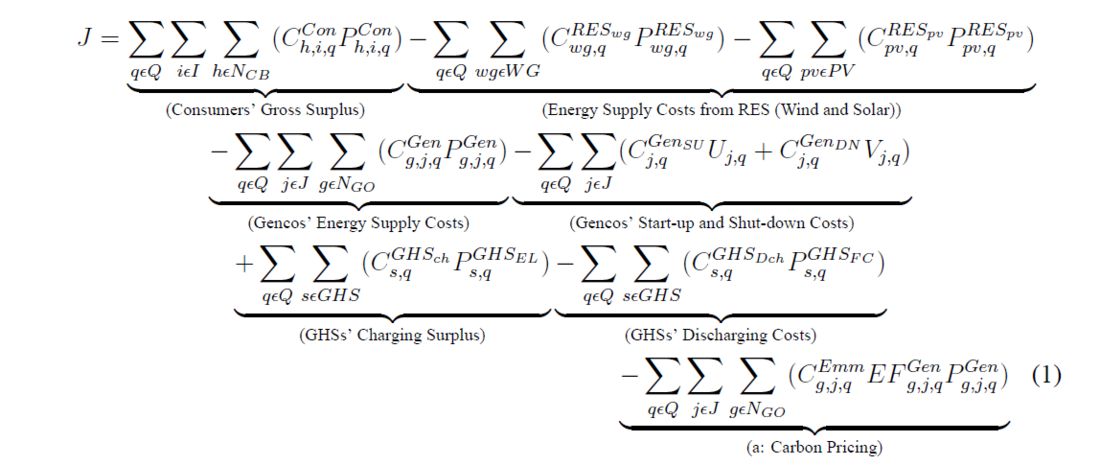
The first term in (1) represents the consumers’ gross surplus. The second and third terms denote the total cost of energy supply from RES (wind and solar). The fourth term denotes the operational cost of gencos for energy supply. The start-up and shut-down cost of gencos are given by the fifth term. The sixth term represents the charging cost of GHSs while the seventh term denotes the discharging cost of GHSs for energy supply. Lastly, the eighth term represents the carbon pricing pertaining to total carbon emissions. Equation (1), excluding term (a), represents the objective function of the DAM without considering carbon emissions pricing.
Along with other ongoing efforts to achieve decarbonization in the energy sector, one of the attractive mechanisms is to implement emission trading. Carbon pricing is one of such emission trading scheme wherein the system is penalized based on its emissions, typically quantified in terms of CO2 or CO2eq emissions contributed. Such schemes are needed to meet climate change challenges and accelerate the process of decarbonization. Carbon pricing assists in monetizing the environmental factors associated with different types of resources and mostly results in higher market prices. To this effect, low/zero emission resources are benefited by their increased chances of clearance despite being costlier, while net revenue and total dispatch of emission-intensive resources reduces. In this work, carbon pricing is formulated by considering an emission factor (expressed in tonnes/MWh) of each participating resource which varies based on resource-type,cost associated with emissions ($/tonnes) and hourly generation being cleared from the respective resource in the DAM. The objective function is subjected to the following set of constraints.
2.3.2. Demand-Supply Balance
This constraint ensures the balance between demand and supply for the system at each hour.
(2)
2.3.3. GHS Constraints: Energy Arbitrage, Physical and Operational
Electrolyzer Constraints:
The number of hydrogen moles generated in terms of the power drawn by the electrolyzer are given by,
(3)
Maximum number of hydrogen moles that can be produced by the electrolyzer are limited as follows:
(4)
While the maximum and minimum power consumption limits of the (PtH) component of the GHS i.e. electrolyzer, are given by,
(5)
Storage Tank Constraints:
Based on the Gas Law [16], the pressure in the hydrogen storage tank at any time q can be expressed as a function of the pressure at the previous interval q-1, the number of hydrogen moles generated by the electrolyzer and utilized by the fuel cell, given by the following equations:
(6)
where
(7)
and
(8)
Following constraints define the maximum and minimum pressure limits of the hydrogen storage tanks:
(9)
Fuel Cell Constraints:
The number of hydrogen moles utilized for power generation by the fuel cell is given by,
(10)
Maximum number of hydrogen moles that can be utilized by the fuel cell are limited by the following:
(11)
The maximum and minimum limit on power generation by the (HtP) component of the GHS i.e. fuel cell, are given as follows:
(12)
To avoid the simultaneous charging and discharging of GHS, the following constraints are applied:
(13)
Green Hydrogen Constraints:
The energy consumed by electrolyzers during charging operation of GHSs must be supplied by the cleared dispatch of RES and hydro generation only, to ensure that the GHSs are net-zero CO2 emissions resources. As primary aim of this work is to demonstrate the integration of GHSs as market participants, it is assumed that there will be a mutual contract/mechanism between GHS owners and ISO to ensure the energy consumption by GHSs are supplied through the clean resources only. This paper focuses on determining the impact on the market settlement due to GHSs participation, the extra payments for such contracts are considered to be part of their bids/offers, and are not explicitly segregated and presented here.
(14)
2.3.4. Market Clearing and Other Constraints
These constraints ensure that the market cleared consumers’ demands and gencos’ supplies are within their respective maximum bid/offer quantities. These also include UC constraints such as ramp-rate limits, minimum up-time/down-time constraints, generation limits and coordination constraints. While these constraints are considered in the proposed MIP optimization model, they are not presented here in detail for brevity [17].
3. Case studies, results and analyses
To examine the effectiveness and performance of the proposed model, the Alberta and Ontario provinces transmission-connected supply mix were considered (Figure 2), considering the same percentage share of each fuel type resource, as these provinces possess in actual, [18, 19]. The total generation capacity was scaled-down to configure with the IEEE 24-bus Reliability Test System (RTS) with RES (wind and solar) for each province. These two provinces were shortlisted for study in this paper since they have distinct spectrum of energy technologies’ mix, Alberta’s 81% generation capacity being fed by emission-intensive resources (Figure 2(a)), while Ontario has 72% of its capacity from low-zero emission resources (Figure 2(b)).
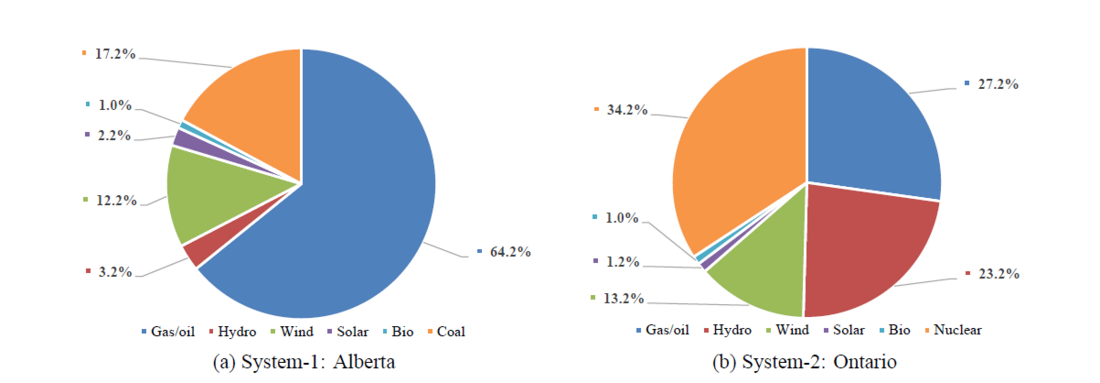
Figure 2 - Transmission-connected energy mix
The gencos’ offers and consumers’ bids are in three price-quantity pairs while those of RES are in a single price-quantity pair. There are 10 GHS units of distinct ratings, with a total capacity of 340 MW, located at ten different buses in both systems. These GHSs submit their bids (for charging mode) and offers (for discharging mode) in single price-quantity pair [8]. The proposed UMP-based DAM auction model is formulated as an MIP problem and solved using the CPLEX solver in GAMS environment. Various cases and scenarios are developed to investigate the impact of GHSs participation and consideration of carbon pricing in the electricity market settlement and emissions reduction, which are described in Table 1. The carbon price is considered to be 65$[1]/tonnes for both systems under study, as per [12].
Systems | |
System-1 | Alberta (emission-intensive resources dominant) |
System-2 | Ontario (low-emission resources dominant) |
Scenarios | |
Scenario-1 | Considering emission cap |
Scenario-2 | Considering carbon pricing |
Cases | |
Case-1 | Without GHS |
Case-2 | Considering GHS |
3.1. Business As Usual (BAU)
This considers the base system for each, Alberta and Ontario, without any emission control strategies or GHSs, and serves as the reference for further analyses presented in subsequent subsections. The social welfare and system emissions obtained for Business As Usual (BAU) scenario for Alberta are $3,328,000 and 29.4 kTonne, respectively; while for Ontario, are $4,569,000 and 6.43 kTonne, respectively. Furthermore, when GHSs were included in the BAU scenario with their current cost metrics (typically cost of hydrogen as 3 USD/kg), it was observed that the GHSs were not cleared in the DAM settlement in either systems because of being an expensive resource.
3.2. Social Cost of Carbon (SCC) and Green Paradox
The Social Cost of Carbon (SCC) is well-recognized globally as a central concept to estimate the climate change damages in the Cost-Benefit Analysis (CBA) of climate change public policies and public investments, and is defined as marginal economic loss or cost caused when an additional ton of carbon or its equivalent is released into the environment [20, 21, 22, 23, 24, 25]. It denotes the present-value of damage in monetary terms which can be further use as a benefit for policies/projects that induces a net carbon emissions reduction and/or can be added as a cost term for projects which lead to carbon emissions [26]. Many countries have explored the role of carbon taxes or SCC and have developed their own ways for estimating it. In reported literature, various theories, approximation models and approaches are explored with different sets of assumptions and objectives [20, 21, 22, 23, 24, 25, 26]. An important concern which is being highlighted in the reported works is Green Paradox, which states that the policies or measures aiming towards carbon emissions reduction and climate change abatement, may result in reducing welfare and potentially increasing emissions in the near-term [26]. In reference [26], it was concluded that the carbon pricing seems to be a better way for regulating emissions as compared to other approaches such as subsidies to RES, etc., while avoiding the issue of Green Paradox. Thus, in this paper, the authors investigate the role of SCC in both approaches of being considered as (a) a benefit item to obtain gross social welfare which then may be distributed to consumers in some form of incentives/rebates, and (b) a cost term in the objective function of the mathematical model (in form of carbon pricing) to penalize the resources causing carbon emissions; these are discussed in detail in subsequent subsections.
3.3. Studies Considering Emission Control Strategies
With the goal to achieve a net-zero CO2 emissions grid, two potential emission control strategies are proposed herein, considering their ease of implementation and being realistic, namely, emission cap and carbon pricing. The emission cap is included as a constraint in the market settlement mathematical model while the carbon pricing strategy is included by modifying the model objective function. Figure 3(a) shows the MCP profiles over 24-hr horizon obtained for Alberta when an additional constraint to cap the emissions (Scenario-1) to 60% of the existing emissions (base case) is considered. The two curves corresponds to cases without (Case-1) and with (Case-2) GHSs participation, respectively. The MCPs increased when an emission cap was included in both cases as compared to the base case, however, the spikes in energy prices during peak hours (17,18 & 21) were flattened in the latter case when GHSs participated (Case-2). This is due to the fact that GHSs discharge during these hours (as shown in Figure 3(c)) to limit the price rise, as they are cheaper resources and do not contribute to emissions, being net-zero CO2 emissions resources. While, Figure 3(b) presents the Scenario-2 MCP plots when carbon pricing is included in the objective function considering the emission factors from each resource, in the market optimization model. It can be noted that consideration of carbon pricing increased the MCPs in comparison to base case, however the increase in Case-2 was flattened during peak hours as compared to Case-1 due to discharging operation of GHSs at those hours (Figure 3(d)).
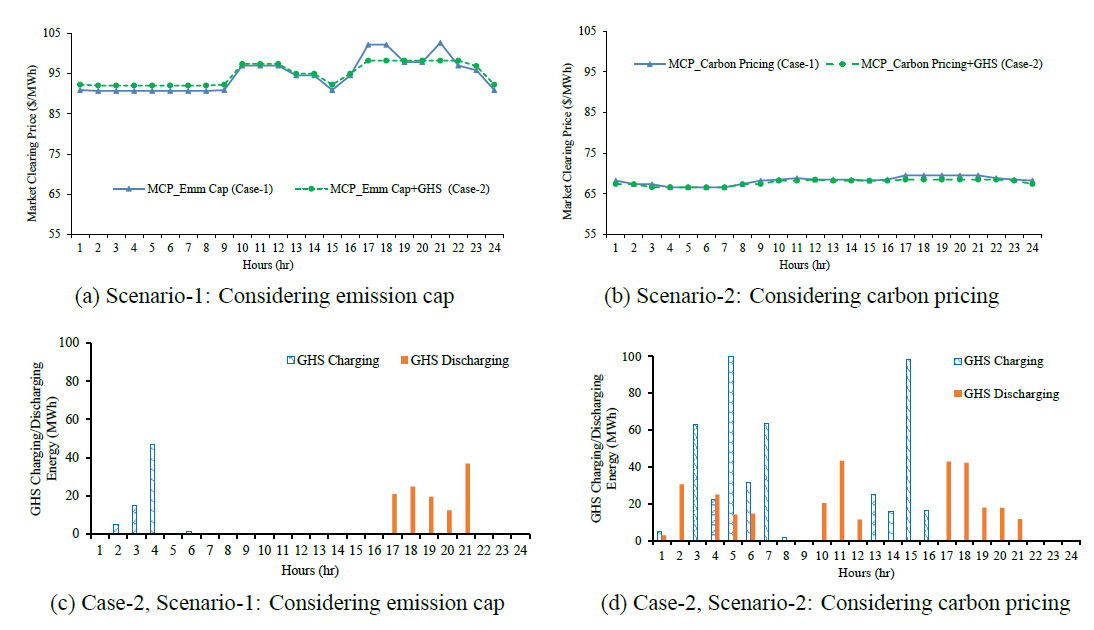
Figure 3 - Market clearing price and GHS charging/discharging profiles for Alberta (System-1)
In Ontario, the MCPs increased when an emission cap of 80% was imposed (Scenario-1) in the market model. It can be noted from Figure 4(a) that the price increase was lower when GHSs were included (Case-2) as compared to without considering them (Case-1). Moreover, GHSs assisted in flattening the MCP spikes during the peak hour (21). The small rise in MCPs during low demand hours (3-6) in case of GHSs participation (Case-2) as compared to Case-1, can be attributed to their charging operation (as shown in Figure 4(c)). Figure 4(b) presents the MCP plots for Scenario-2 for Ontario. It can be seen that in Case-2 the MCP profile flattens during peak hours (17-22) and alleviates spike at hour-21 as compared to Case-1. This is again due to the GHSs discharging operation during high price hours (as shown in Figure 4(d)) which limits and/or alleviates such spikes in the energy prices. Moreover, it is anticipated that further reduced MCPs could be obtained in both scenarios for Case-2 if significant capacities of GHSs were deployed with respect to the overall system size and/or their bids/offers are modified incorporating the benefits and rebates received under schemes such as IRA 2022, 111 Hydrogen Shot, etc. The deployment of these steps could accelerate the transition to a decarbonized electricity sector for both systems.
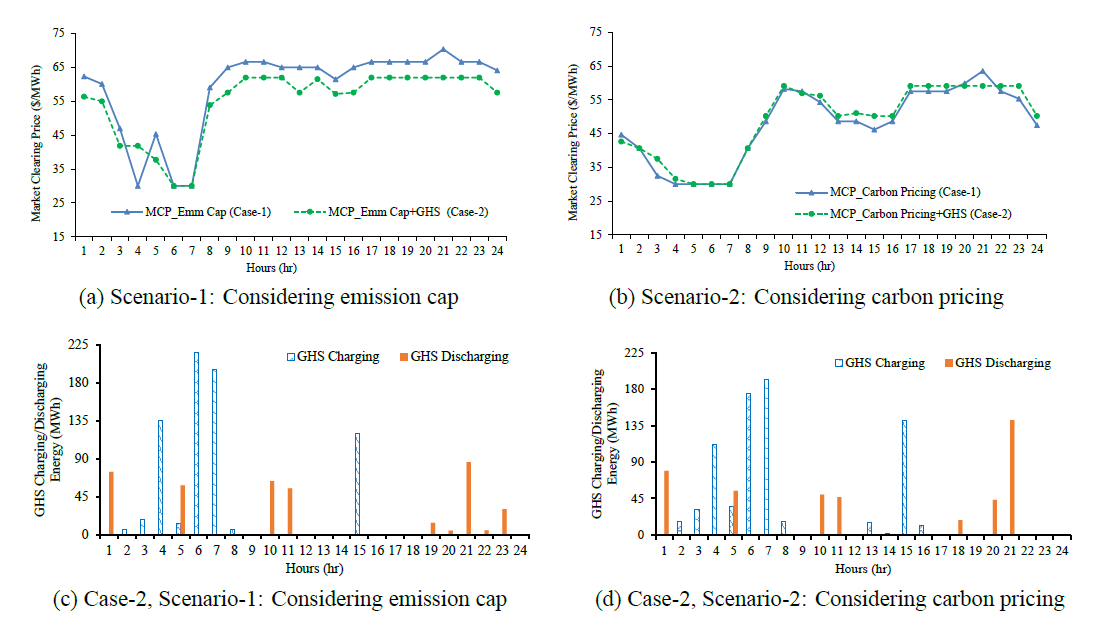
Figure 4 - Market clearing price and GHS charging/discharging profiles for Ontario (System-2)
It can be observed that there is a considerable difference in price profiles between Scenario-1 (emission cap) and Scenario-2 (carbon pricing) for both systems, Alberta and Ontario, as depicted in Figure 3(a) & (b) and Figure 4(a) & (b). Note that an emission cap is a hard constraint, and enforces the more expensive low-emission resources to be dispatched, in Scenario-1, in lieu of the cheaper emission-intensive resources, irrespective of the total system cost. This increases the system’s marginal cost and hence the market price. On the other hand, Scenario-2 with carbon pricing considers an additional cost in the objective function, and an optimal solution is arrived at, wherein the emission-intensive resources are not substituted as much as in Scenario-1 by expensive low-emission resources since their offer prices are higher than the carbon price considered (65 $/tonne). This effect is more observed in the Alberta system with 81% of its capacity being emission-intensive resources while much less effect in Ontario which has 28% of its capacity emission-intensive resources.
Table 2 presents a summary of some market clearing results of the UMP-based DAM for both the systems under study. For Alberta, it can be noted that the social welfare increased in both scenarios in Case-2 as compared to Case-1; thus GHSs participation yielded higher social welfare. The consideration of emission cap (Scenario-1) restricted the total emissions to 60% (17.64 kTonne) of the base case emissions (29.4 kTonne). It can be seen that GHSs participated in the market more through discharging operation than charging, in Scenario-1 to satisfy the emissions cap. The social welfare decreased in Scenario-2 for each case in comparison to Scenario-1 due to the consideration of carbon pricing. The inclusion of carbon pricing in the market model resulted in reduction of emissions (20.9 kTonne) as compared to base case emissions (29.4 kTonne). The GHSs participation in Scenario-2 was considerably higher than Scenario-1 because their bids/offers were in the range of carbon price and MCPs which resulted in their increased participation while, in Scenario-1 more gas-fired generators had to be dispatched to satisfy the emission cap and other UC constraints, hence limiting the GHSs participation.
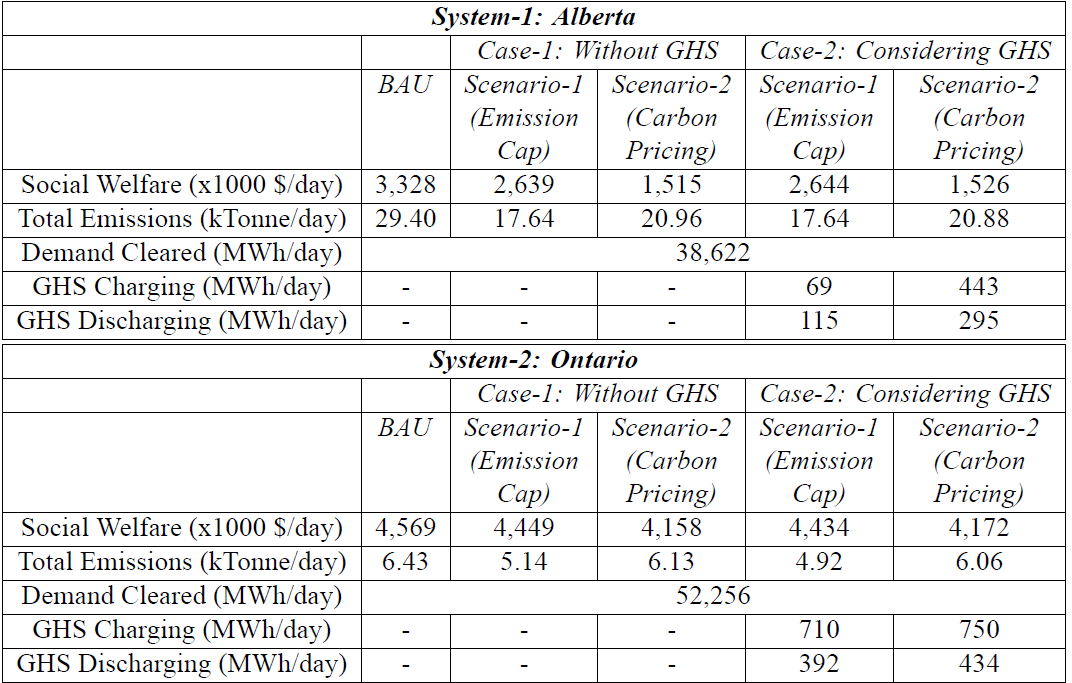
Table 2 - Summary of Market Clearing Results of DAM (aggregated over 24-hours)
For Ontario, the social welfare decreased by a small amount in Case-2 as compared to Case- 1 for Scenario-1 contrary to Alberta results. However, this can be attributed to decrease in the total emissions, 4.92 kTonne in Case-2 over 5.14 kTonne in Case-1. For same emissions amount, the social welfare will be higher in Case-2. And for Scenario-2, the observations remain same as discussed for Alberta. The emission cap of 80% of the base case emissions (6.43 kTonne) restricted the emissions to 5.14 kTonne in Scenario-1. Carbon pricing consideration resulted in emissions reduction (6.1 kTonne, Scenario-2) as compared to the base case for Ontario as well and the social welfare also decreased. Interestingly, it can be observed that GHSs participation in Ontario was higher as compared to Alberta. This is mainly because of the Green Hydrogen Constraint (14), described in Section 2.3.3, which limits the consumption of GHSs through only cleaner resources. Since, Ontario have more cleaner resources as compared to Alberta, the GHSs participation is higher for the former. The authors anticipate that if this constraint is relaxed to incorporate other colors of hydrogen systems, the participation of such hydrogen systems will increase in Alberta significantly. It can be inferred from Table 2 that out of two proposed emission control strategies, emission cap was more effective strategy when the impact on social welfare and reduction in system emissions are considered to be determining factors; on the other hand, carbon pricing was the preferred approach if the impact on MCP is the determining attribute, in both Alberta and Ontario systems.
3.4. Sensitivity Analyses
Detailed sensitivity studies are carried out to evaluate the performance of the proposed mathematical model without and with the inclusion of GHS, and considering RES uncertainties and the two emission control strategies, emission cap and carbon pricing. The emission cap limiting value and the choice of carbon price value are varied over a range. The GHS operational characteristics, such as storage tanks’ initial moles content, are also varied.
3.4.1. Effect of RES Uncertainties
To evaluate the model performance and effectiveness, Monte Carlo Simulation (MCS) is carried out over 2,000 samples by varying the RES generation (wind and solar) in DAM settlements, for each system, Ontario and Alberta. For the Alberta system, Figure 5(a) presents the expected social welfare without and with GHS for Scenario-1 (considering emission cap) and Figure 5(b) shows the social welfare for without/with GHS for Scenario-2 (considering carbon pricing), demonstrating their convergence. Figure 6 presents the convergence of hourly MCPs without and with GHS in each of the scenarios, for Alberta.
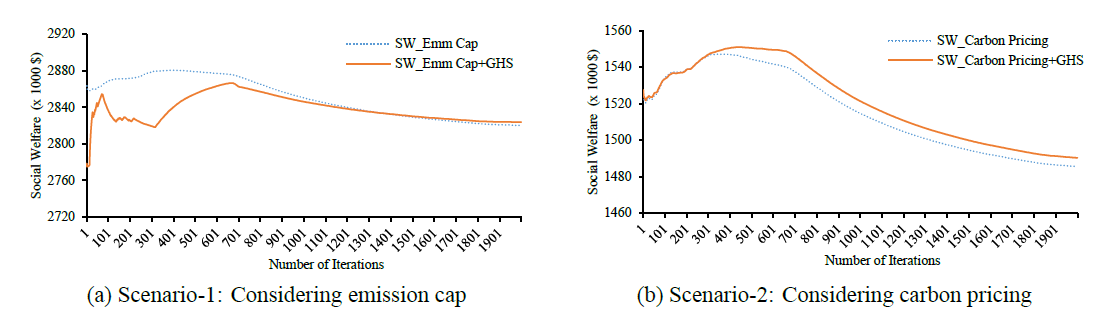
Figure 5 - Social welfare profiles considering RES uncertainties for Alberta (System-1)
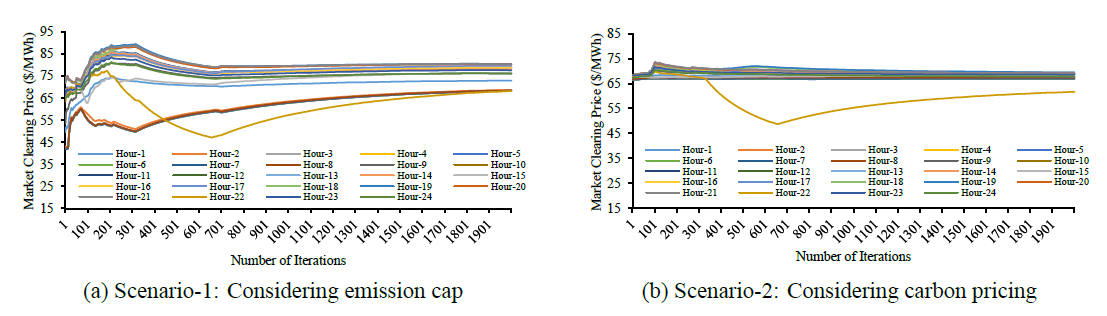
Figure 6 - Market clearing price profiles considering RES uncertainties for Alberta (System-1)
On the other hand, for the Ontario system studies, Figure 7 presents the convergence of the expected social welfare, without and with GHS, in each of the scenarios. Figure 8 demonstrate the convergence of Ontario’s hourly MCPs without and with GHS, for both scenarios.
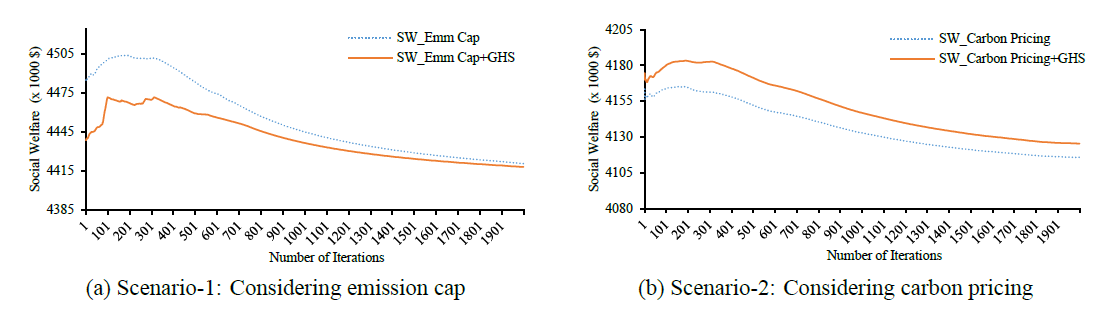
Figure 7 - Social welfare profiles considering RES uncertainties for Ontario (System-2)
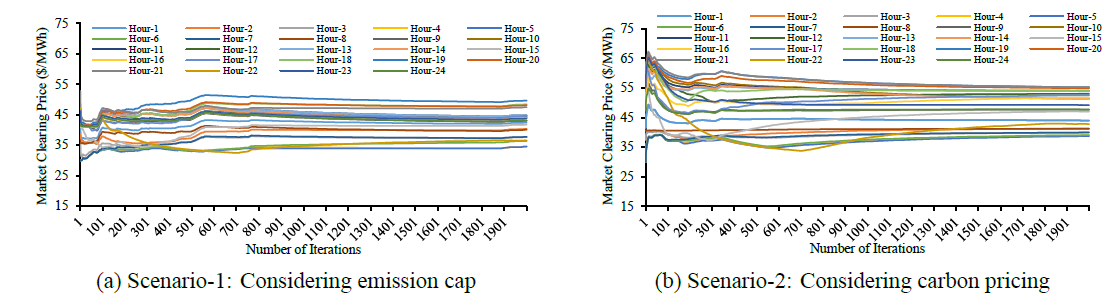
Figure 8 - Market clearing price profiles considering RES uncertainties for Ontario (System-2)
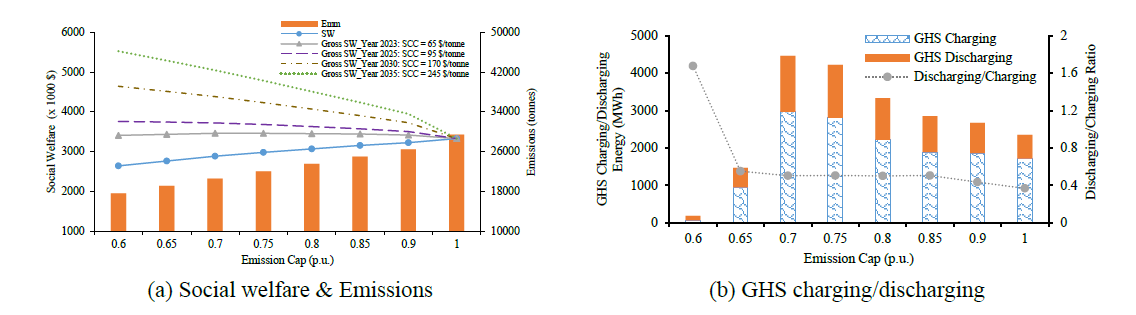
Figure 9 - Effect of emission cap for Alberta (System-1)
3.4.2. Effect of Emission Cap
For Alberta, the emission cap is varied over a range from 0.6 to 1 per unit (p.u.), i.e. emissions are varied in range of 60% to 100% of BAU emissions, and its effect on the social welfare and GHS charging & discharging operations are examined. It is noted from Figure 9 that as the emission cap is tightened, the social welfare decreases while the GHS discharging to charging ratio gradually increases, up to the cap value of 0.7 p.u., and beyond that, charging/discharging operations are significantly reduced. In the case of Ontario, the emission cap was varied from 0.75 to 1 p.u. and the results show that the social welfare decreased as the emission cap was tightened (Figure 10(a)) and the GHS discharging/charging ratio increased (Figure 10(b)).
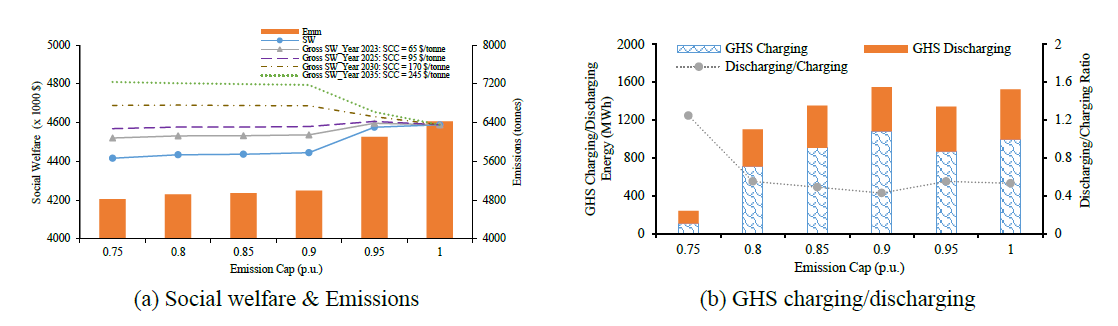
Figure 10 - Effect of emission cap for Ontario (System-2)
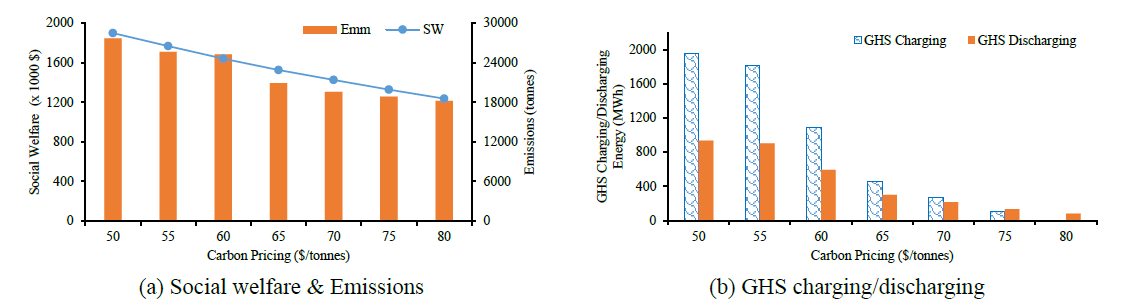
Figure 11 - Effect of carbon pricing for Alberta (System-1)
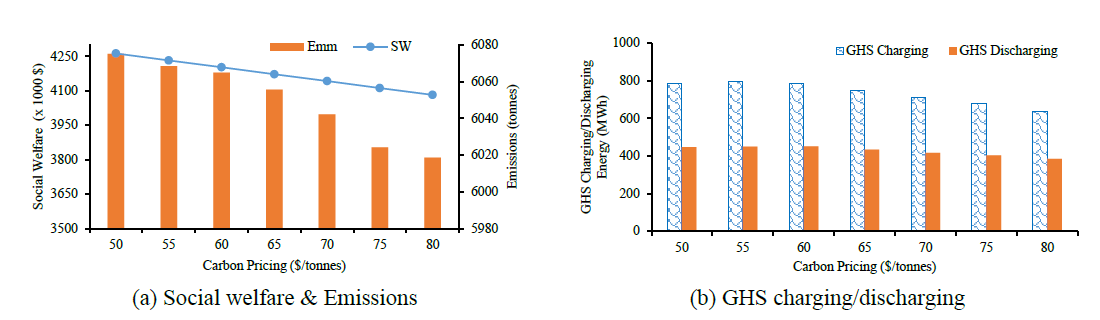
Figure 12 - Effect of carbon pricing for Ontario (System-2)
From Figure 9(a) and Figure 10(a) for both Alberta and Ontario, the Green Paradox effect is observed i.e. with the reduction in carbon emissions the social welfare also decreased. From system operator or market operator perspective, the conventional approach of calculating social welfare via the market settlement does not consider the benefit from net carbon emissions reduction and hence, the social welfare decreases with emissions reduction due to low-zero emitting resources being cleared which are costlier. However, if the gross social welfare is calculated by adding the benefit term using the SCC as discussed in subsection 3.2, then it can be seen that the social welfare increased with the reduction in carbon emissions. The gross social welfare can be calculated as Gross SW = SW + (Net Emission Reduction x SCC). The effect of choice of SCC on gross social welfare with varying limit of emission cap is demonstrated in Figure 9(a) and Figure 10(a) for Alberta and Ontario, respectively wherein the SCC is increased annually by 15 $/tonnes from year 2023 to 2035 [12].
3.4.3. Effect of Carbon Pricing
A study was performed to examine the impact of carbon pricing on system attributes by varying the price from 55 $/tonnes to 80 $/tonnes in steps of 5 $/tonnes. From Figure 11(a) and Figure 12(a), it can be observed that with increase in carbon pricing, the social welfare and system emissions reduced in both Alberta and Ontario. The reduction in case of Alberta was more significant (in the range of 50%) while in Ontario the reduction was lower, in the range of 5%. This is because the share of low/zero emission resources in the energy mix of Ontario is 72%, as compared to 19% in Alberta. With increase in carbon price, the GHS charging/discharging operations were reduced, more noticeably in Alberta (Figure 11(b)) as compared to Ontario (Figure 12(b)).
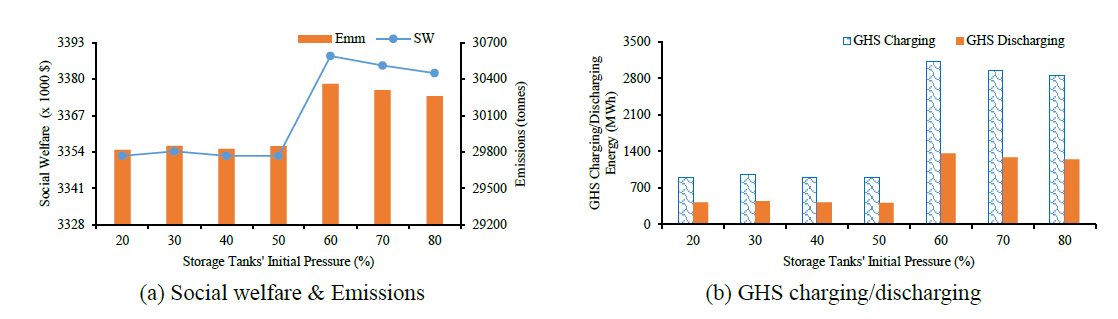
Figure 13 - Effect of storage tanks’ initial pressure for Alberta (System-1)
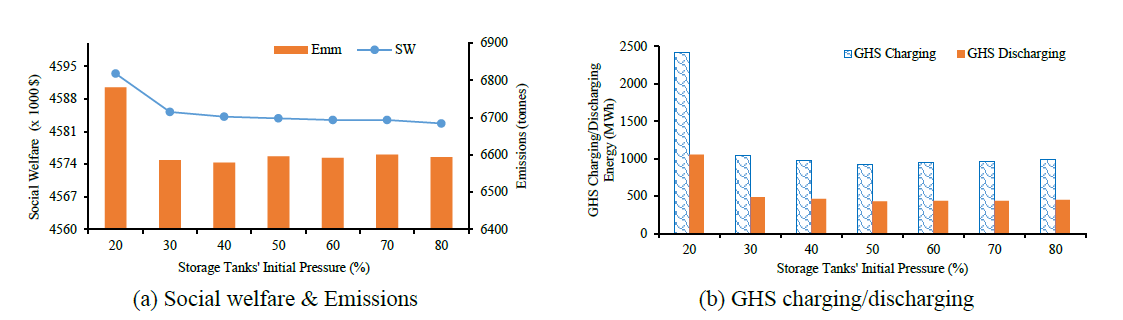
Figure 14 - Effect of storage tanks’ initial pressure for Ontario (System-2)
3.4.4. Effect of Changing the Initial Conditions of GHS Storage Tanks
Analysis was carried out to examine the effect of varying the initial conditions of the GHS storage tanks; varying the initial pressure (moles content) over a range from 20% to 80% of its maximum capacity. Also, the following end-point constraint is included in the mathematical model to ensure that storage tank pressure at the end of the day is greater than or equal to its initial value, in preparation for the next day:
(15)
From Figure 13(a), it can be noted that for Alberta, with the increase in initial moles content (pressure) of GHS storage tanks, the social welfare and system emissions remained at a fairly uniform level up to 50% and increased significantly at 60%. This is because with higher initial moles content, the total generation cleared from gencos are higher as compared to that with lower inital moles content, which leads to higher charging of GHSs and hence increased social welfare but at the price of higher system emissions. Alternatively, when the same sensitivity analysis is carried out by imposing emission constraint in the model where emissions are restricted to that obtained in case of 20% then, with increase in the initial pressure of GHS storage tanks the social welfare reduced; for instance the social welfare obtained are $3,352,625 and $3,312,832 at 20% and 60% inital pressure of tanks, respectively. In Ontario, the social welfare and system emissions decreased with the increase in initial moles content of GHS tanks (Figure 14(a)). Similar effect is observed on charging/discharging operations of the GHS units for both systems, Alberta and Ontario, as presented in Figure 13(b) amd Figure 14(b), respectively.
4. Conclusions
In this paper, a new framework and a comprehensive mathematical model were proposed which integrated GHSs in an UMP-based day-ahead electricity market. The effect of considering two emission control strategies, namely emission cap and carbon pricing, on electricity market settlements were investigated in detail. The effectiveness and performance of the model was evaluated by considering the IEEE 24-bus RTS and the supply mix of two real power systems with distinct characteristics, that of the Alberta and Ontario provinces of Canada. The model was comprehensively formulated to take into account the effect of carbon emissions, physical and operational characteristics of market participants. It was noted that in the base scenario without any emission control strategy, the GHSs were not cleared in the DAM settlement due to their expensive cost metrics. However, GHSs were cleared in each system when emission control strategies were introduced, these being net-zero CO2 emissions resources. The consideration of carbon pricing and emission cap in the market model helped in reducing the system emissions although yielding higher MCPs and reduced social welfare as compared to the BAU case. The inclusion of GHSs helped in smoothing the effect of inclusion of carbon pricing and emission cap on the MCPs, by flattening the MCP profiles considerably during peak hours (17-21). From the results, it was observed that the participation of GHSs improved the social welfare for all scenarios; in Alberta, it increased by 5,000 $/day and by 11,000 $/day in Scenario-1 and Scenario-2, respectively while in Ontario, the change in social welfare was 15,000 $/day and 14,000 $/day in Scenario-1 and Scenario-2, respectively.
It was observed from the studies presented that emission cap was more effective strategy when the impact on social welfare and reduction in system emissions are considered to be determining factors; on the other hand, carbon pricing was the preferred approach if the impact on MCP is the determining attribute, in both Alberta and Ontario systems. From the MCS studies considering RES (wind and solar) uncertainties, it was noted that both systems in each scenario converged to their expected values. From the sensitivity analyses, it was seen that as the emission cap was relaxed (0.6 to 1 p.u for Alberta and 0.75 to 1 p.u. for Ontario) the social welfare increased while the GHS discharging to charging ratio decreased. When the SCC was increased in increments of 15 $/tonnes from year 2023 to 2035, the system emissions decreased while the gross social welfare increased, with more significant effect observed in Alberta as compared to Ontario. It was observed that when the carbon price was considered and varied from 55 $/tonnes to 80 $/tonnes in steps of 5 $/tonnes, the social welfare and system emissions both decreased, with more noticeable impact seen in Alberta as compared to Ontario. It was noted that when the initial condition of GHSs’ storage tanks was varied (20% to 80% of its maximum capacity), then for Alberta with higher initial pressure, the social welfare and total emissions increased while they decreased for Ontario. It is anticipated that with reduction in GHS cost metrics and technology development, their penetration in electricity markets will increase, resulting in lowering of emissions and MCPs. GHS possesses generation, storage and consumption components which can assist the system operators to meet the complex needs of the power grid and help in achieving a net-zero GHG emissions grid.
References
- IEA, “CO2 emissions in 2022,” Tech. Rep. [Online].
- S. Jeudy-Hugo, L. L. Re, and C. Falduto, “Understanding countries’ net-zero emissions targets,” 2021. [Online].
- A. Körner, C. Tam, S. Bennett, and J. Gagné, “Technology roadmap-hydrogen and fuel cells,” International Energy Agency (IEA): Paris, France, 2015.
- D. Erdemir and I. Dincer, “Development of solar-driven charging station integrated with hydrogen as an energy storage option,” Energy Conversion and Management, vol. 257, p.115436, 2022.
- Inflation Reduction Act of 2022. (2022) Congressional Record vol. 168, no. 133. [Online].
- US DOE. (2021) Hydrogen Shot 111. [Online].
- H. Wu, S. Zhang, X. Li, S. Liu, and L. Liang, “A multivariate coupled economic model study on hydrogen production by renewable energy combined with off-peak electricity,” International Journal of Hydrogen Energy, vol. 47, no. 58, pp. 24 481–24 492, 2022.
- D. Parra, L. Valverde, F. J. Pino, and M. K. Patel, “A review on the role, cost and value of hydrogen energy systems for deep decarbonisation,” Renewable and Sustainable Energy Reviews, vol. 101, pp. 279–294, 2019.
- D. Parra, G. S. Walker, and M. Gillott, “Modeling of PV generation, battery and hydrogen storage to investigate the benefits of energy storage for single dwelling,” Sustainable Cities and Society, vol. 10, pp. 1–10, 2014.
- A. Komorowska, P. Olczak, E. Hanc, and J. Kamiński, “An analysis of the competitiveness of hydrogen storage and li-ion batteries based on price arbitrage in the day-ahead market,” International Journal of Hydrogen Energy, vol. 47, no. 66, pp. 28 556–28 572, 2022.
- D. B. Layzell, C. Young, J. Lof, J. Leary, and S. Sit, “Towards net-zero energy systems in Canada: A key role for hydrogen,” Transition accelerator reports, vol. 2, no. 3, 2020.
- IESO, “Pathways to decarbonization,” Tech. Rep., 2022. [Online].
- AESO, “Net-zero emissions pathways report,” Tech. Rep., 2022. [Online].
- V. Maestre, A. Ortiz, and I. Ortiz, “Challenges and prospects of renewable hydrogen-based strategies for full decarbonization of stationary power applications,” Renewable and Sustainable Energy Reviews, vol. 152, p. 111628, 2021.
- G. Buffo, P. Marocco, D. Ferrero, A. Lanzini, and M. Santarelli, “Power-to-x and powerto-power routes,” in Solar Hydrogen Production, 2019, pp. 529–557.
- C. M. Correa-Posada and P. Sanchez-Martin, “Integrated power and natural gas model for energy adequacy in short-term operation,” IEEE Trans. on Power Systems, vol. 30, no. 6, pp. 3347–3355, 2014.
- A. L. Motto, F. D. Galiana, A. J. Conejo, and J. M. Arroyo, “Network-constrained multiperiod auction for a pool-based electricity market,” IEEE Trans. on Power Systems, vol. 17, no. 3, pp. 646–653, 2002.
- AESO. (2022) Alberta’s fast-evolving supply mix. [Online].
- IESO, “Reliability outlook - an adequacy assessment of Ontario’s electricity system - July 2023 to December 2024,” Tech. Rep., 2023. [Online].
- D. Anthoff and R. S. Tol, “The uncertainty about the social cost of carbon: A decomposition analysis using fund,” Climatic Change, vol. 117, pp. 515–530, 2013.
- W. D. Nordhaus, “Revisiting the social cost of carbon,” Proceedings of the National Academy of Sciences, vol. 114, no. 7, pp. 1518–1523, 2017.
- K. Gillingham and J. H. Stock, “The cost of reducing greenhouse gas emissions,” Journal of Economic Perspectives, vol. 32, no. 4, pp. 53–72, 2018.
- P. Wang, X. Deng, H. Zhou, and S. Yu, “Estimates of the social cost of carbon: A review based on meta-analysis,” Journal of Cleaner Production, vol. 209, pp. 1494–1507, 2019.
- Y. Cai and T. S. Lontzek, “The social cost of carbon with economic and climate risks,” Journal of Political Economy, vol. 127, no. 6, pp. 2684–2734, 2019.
- C. Hepburn, N. Stern, and J. E. Stiglitz, “Carbon pricing,” Special Issue in the European Economic Review, vol. 127, p. 103440, 2020.
- OECD, The social cost of carbon, in Cost-Benefit Analysis and the Environment: Further Developments and Policy Use, 2018. [Online].
Biographies
Anshul Goyal received the B.Tech. degree in Electrical Engineering from Nirma University, Ahmedabad, Gujarat, India, in 2015. He is currently a Ph.D. candidate in the Department of Electrical and Computer Engineering, University of Waterloo, Waterloo, ON, Canada. He worked as an Executive Electrical Engineer in the EPC business of the oil & gas sector with Linde Engineering, Vadodara, Gujarat, India, from 2015 to 2019. His research interests include the integration of energy storage systems and carbon-neutral technologies into the power system, electricity markets modeling and design, and optimization of power systems.
Kankar Bhattacharya received the Ph.D. degree in Electrical Engineering from the Indian Institute of Technology Delhi, New Delhi, India, in 1993. He was in the faculty of Indira Gandhi Institute of Development Research, Mumbai, India, from 1993 to 1998, and with the Department of Electric Power Engineering, Chalmers University of Technology, Gothenburg, Sweden, from 1998 to 2002. In 2003, he joined the Electrical and Computer Engineering Department, University of Waterloo, Waterloo, ON, Canada, where he is currently a full Professor. His current research interests include power system economics and operational aspects. He is a Registered Professional Engineer in the province of Ontario.
- [1] It is to be noted that all the costs in this paper are in Canadian Dollars unless stated otherwise.