Touch voltage measurements: new approach for measurements on lines in service
Authors
J. LUNDENGÅRD, C. AHLHOLM - I2G, Sweden
A. KARLSSON, K.O. JONSSON, W. MARAKBI - Svenska Kraftnät, Sweden

Summary
Touch voltages may arise in the vicinity of transmission lines in case an earth fault occurs, and the earthing design must ensure safe operation even in such cases. Measurements to verify that touch voltages are within stipulated limits are today made by Svenska kraftnät with the heavy-current injection method, which requires that the transmission lines are taken out of service during measurement. Due to increased utilization of the grid, scheduling the line outages for touch voltage measurements have become more difficult. Therefore, a so-called high-voltage method is being developed, making it possible to perform touch voltage measurements on transmission lines in service. The method has been verified through an initial field test on a 220 kV transmission line in service. The results have been compared with results from measurement with the heavy-current injection method, and as shown in this paper, there was good agreement of the results. Svenska kraftnät is now taking the next step in the development process of a mobile equipment to perform measurement with the high-voltage method on 400 kV transmission lines.
Keywords
Touch voltage measurements, transferred potential, potential rise, earthing system, phase to earth fault1. Introduction and goal
Touch voltages may arise in the vicinity of an overhead line (OHL) in case an earth fault occurs. If the subsequent earth fault current is high, these voltages can reach levels that are harmful to human beings and animals. Therefore, it is important to assess the potential touch voltages to ensure that stipulated levels are not exceeded [1][2]. In Sweden, high touch voltages are a common problem near OHLs since the low-voltage (LV) system is a TN system which is earthed at the LV/MV transformer. The typical issue is that earth faults in the low-impedance earthed 130/220/400 kV systems may cause hazardous potential differences between the soil and the combined protective earth neutral (PEN) conductor at the LV-customer. The heavy-current injection method, which is used today for assessment of touch voltages, requires that the OHL is taken out of service. Due to increased utilization of the transmission network, such possibilities have become more limited. At the same time, the need for these measurements have increased because of changes in, or introduction of, nearby LV-networks. Against this background, the benefits of performing measurements on OHL while in service has increased. Therefore, the work to develop new approaches for such measurements was initiated by Svenska kraftnät, the Swedish transmission system operator.
2. How touch voltages originate in Swedish LV-systems
When an earth fault occurs in a transmission network with low-impedance neutral earthing, an earth fault current (IF) of large magnitude flows from the main circuit through ground and back to the source. For a 3-phase circuit, IF is the sum of the zero-sequence current, 3I0. In systems with low-impedance earthing the earth-fault current is usually in the range of tens of kA near substations and decreases with distance further out on the OHL as the impedance increases. There are two possible contributions to the touch voltages. Firstly, the resistive component which is the increase of the earth potential and where the soil surface potential is of special interest and CIGRE Technical Brochure No. 694 [3] provides a good overview of the problem. Secondly, the inductive component by which objects parallel to the OHL can obtain an induced voltage, and this topic is explained in CIGRE Technical Brochure No. 95 [4]. The soil resistivity in Sweden is usually in the range of a few thousands Ωm and leads to a widespread rise of the earth-surface voltage around the earthing system subjected to an earth fault. The earth-surface voltage will lead to non-metallic transfer of earth potential rise to nearby conductors e.g. LV- and telecommunication-systems. This phenomenon is described in more detail in CIGRE Technical Brochure No. 592 [5].
In Figure 1, the earth-surface voltage is presented from a modelling case typical for Sweden, but with homogenous soil. The funnel-shaped equipotential lines illustrate the earth-surface voltage during an earth-fault at the prospective measuring site near LV-customers. At the remote earth electrode, a similar funnel of opposite polarity is formed. A more widespread earth electrode having a larger area will result in a wider funnel of lower amplitude.
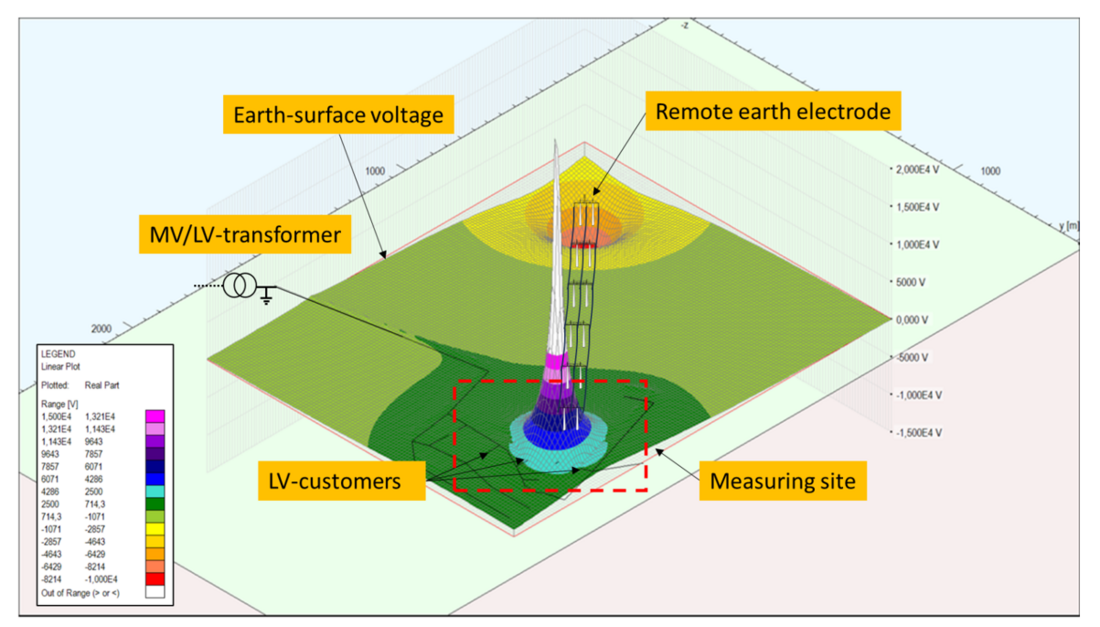
Figure 1 - Modelling case illustrating the earth-surface voltage during an earth-fault at the prospective measuring site
The earth-surface voltage may lead to hazardous potential differences, especially near remotely earthed objects, e.g. LV-systems. Experience has shown that the hazard generally occurs within 1 km from the OHL. A more detailed illustration of the common problem in Sweden is presented in Figure 2. The PEN conductor to the residential house is normally insulated and earthed at the LV/MV transformer, which may be far away, and will therefore obtain the earth-surface voltage at that position. If the residential house is located closer to the OHL the earth-surface voltage will be higher than the PEN conductor potential. This could present a hazard, e.g., to a person standing on the soil surface and being in contact with objects connected to the PEN conductor while an earth fault occurs on the nearby OHL. The prospective touch voltage is illustrated by the smooth curve in Figure 2 and is the voltage between the earth surface and the PEN conductor. The dip in the curve illustrates the voltage drop caused by a person standing on soil, wearing shoes and being in contact with the PEN conductor when performing the touch voltage measurement, which implies a current flow through a simulated body impedance of typically 1 kΩ.
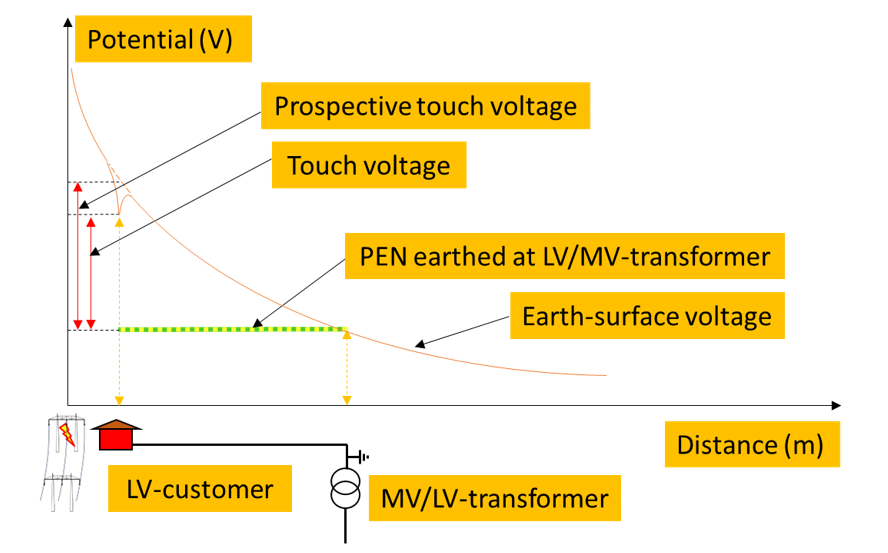
Figure 2 - Illustration of how an earth fault on the OHL can result in hazardous touch voltage between the soil and the remotely earthed PEN conductor
Significant contributions to the touch voltage from induction is less common but may occur when the LV-system runs in parallel to the transmission line for a long distance, and this is the main reason for avoiding such routing. The contribution to inductive voltage rise is not only dependent on the earth fault current, but also on the distance to the OHL and the extension in parallel. The induced voltage component magnitude will add to the resistive component magnitude as a phasor.
3. Present measurement approach
Today’s touch voltage measurements on large earthing system of OHLs are in Sweden in most cases limited to the heavy-current injection method [2]. During the measurements, the OHL is taken out of service and an earth loop is formed by connecting one of the phase conductors to earth near the measuring site and at a sufficient distance away from the measuring site, typically >10 km. If the earth loop is too small, the distribution of the injected current will not be representative. A source is used to generate an AC current in the loop, typically with an amplitude in the range of 20 A, see the example of a current circuit in Figure 3. The frequency of the test current in the heavy-current injection method is typically chosen not to coincide with the power frequency to avoid interference from background noise. The voltage measurements are consequently required to be made with a frequency selective voltmeter. The voltage UTM is measured to assess the touch voltages according to EN 50522 [2]. The ratio of the current through earth over the sum of current injected at the earth-fault location is indicated by the reduction factor (r).
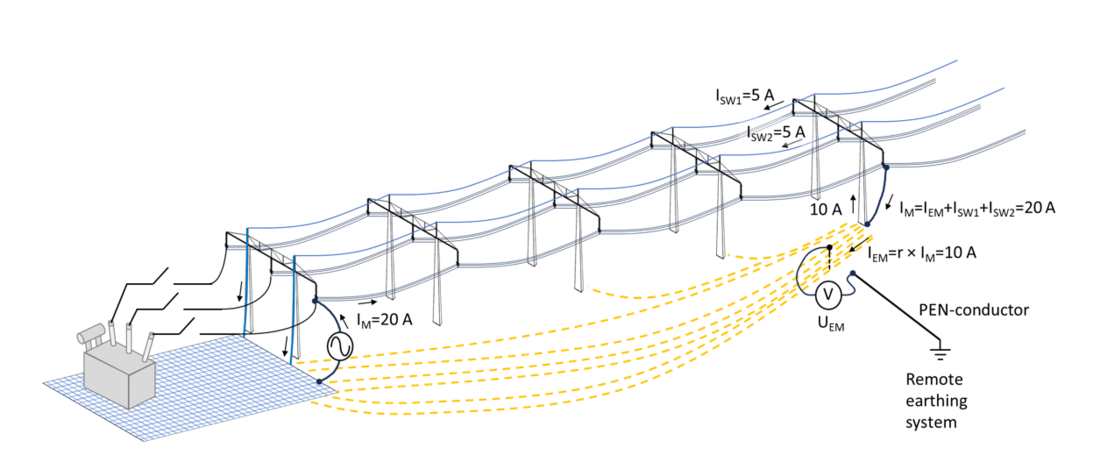
Figure 3 - Principle scheme for heavy-current injection method, and how the injected current distributes
The current injected in the earthing system results in touch voltages which are measured at relevant locations, typically the potential difference between soil and remotely earthed objects e.g. nearby LV-systems. From the measured potential difference UTM and the measured test current IM the apparent transfer impedance ZM can be calculated as described in (1).
(1)
where ZM can be seen as a non-physical parameter used for direct calculation of touch voltage per ampere of fault current injected in the earthing system. The test current IM may, depending on the OHL design, split in different return paths where IEM is the current returning through the soil. ZM includes the reduction factor (r) representing the portion of injected current conducted through the soil back to the remote earth electrode. The reduction factor may be determined by calculation or by measurement, and typical values of reduction factors are given in EN 50522 Annex I [2]. For overhead lines without earth wires the reduction factor r = 1, which means that all of the earth fault current (or test current) will return through the soil.
The potential difference e.g. touch voltage UT for an earth fault current can then be calculated as described in (2).
(2)
Besides the drawback of taking the line out of service, the measurements made by the heavy-current injection method do not necessarily reflect the inductive component as the test current is normally fed from one direction, one station in most cases. This means that the test current is limited to circulate on one side of the fault location only. Relevant results can also be very difficult to obtain when measurements are made on an OHL closely in parallel to another OHL in service, which will induce currents in the test circuit, and this can lead to excessive current through the generator connected for test.
4. Development of a new approach
The work intended to find an alternative to the heavy-current injection method, making it possible to perform touch voltage measurements without taking the OHLs out of service, started already in 2016. The most promising idea that came up was to use one of the phase conductors as a source to provide the test current for measurements, and this approach was therefore called the “high-voltage method”.
4.1. Basic description of the new approach
The basic principle of the high-voltage method is to inject a test current created by a controlled earth fault from one of the phase conductors while the OHL is energized, as illustrated in Figure 4. By limiting the duration and amplitude of the earth fault current, tripping of the OHL is avoided, thereby ensuring that the OHL is kept in service. The earth fault current generated is used for making the measurements of the touch voltages in a similar way as with the heavy-current injection method. Besides keeping the OHL in service, an advantage of this method is that it resembles the condition for a real earth fault, since the contribution to the test current injected in the earthing system, will be fed from both directions with correctly scaled magnitudes. This is illustrated by the currents IM1 and IM2 in Figure 4. This means that the test current is expected to be the same as for a real earth fault, except for the duration and amplitude of the current. Consequently, the measured UTM is expected to be the same as for a real earth fault and only be scaled to the earth fault current. The new measurement approach also allows for determination of the inductive component. Even though separating the measured touch voltages into resistive and inductive components are not of primary interest, this information can be very useful in case mitigation actions are required to reduce the touch voltages.
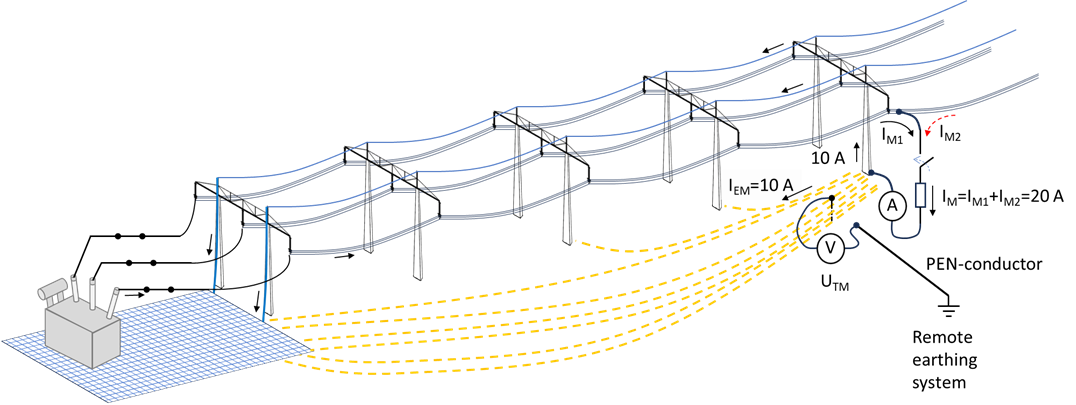
Figure 4 - Principle scheme for the high-voltage method. The station circuit-breakers are closed, and the line in service
4.2. Requirements for the current generation equipment
Since the test current IM will be at power frequency with the high-voltage method, the measured voltage will be the vectorial sum of the background noise and the touch voltage caused by the test current. In order to develop the test procedure and determine a suitable test current, several measurements of the background noise were made at different sites. The measurements of background noise were made on equipment connected to the PEN conductor in the LV-systems. From the analysis it was concluded that a test current of about 20 A during 0,3 s is enough to provide measurement results of good quality, as the UTM expected to be measured during injection of IM of 20 A can be distinguished from the background noise
4.3. Mobile test set-up for current generation
The foreseen mobile equipment for the high-voltage method will include a circuit-breaker with accessories for limiting the test current duration to the specified values. Testing will not be done when there is risk of lightning, and the automatic reclosure of the line will be blocked. These restrictions prevent occurrence of the highest transient overvoltage amplitudes, which will allow for optimizing the circuit-breaker. The benefit if this is that, hopefully, a more compact mobile set-up can be built. The drawback is that the circuit-breaker will, from voltage withstand point of view, become the weakest point along the OHL.
The amplitude of the current to earth is to be limited by a high-voltage resistor, which must withstand the phase-to-ground voltage of the OHL during the 0,3 seconds the circuit-breaker is closed. The power dissipated in the resistor will be rather high; with 20 A drawn from a 420kV OHL the power is calculated as P = I x U = 20 x 242 = 4 840 kW. The energy dissipated in the resistor will be E = P x t = 4 840 x 0,3 = 1 452 kWs. This will increase the temperature of the resistor, thereby limiting the number of tests that can be made within a short time with this test set-up. Preferably the resistor shall allow 2-3 tests within few minutes, in case one test need to be repeated. After that, a longer time is foreseen for moving the test equipment, and during this time cooling of the resistor will take place.
A method for connecting one of the circuit breaker terminals to the phase conductor is also being developed, with the primary goal to use a drone. Such method will allow quick remote control of the connection and disconnection of the test equipment to the line; thereby minimizing the duration the test equipment is exposed to voltage from the OHL, including transient overvoltages. Remote control of connection to the OHL is also an advantage from a personal safety perspective, as the operator can stay at a safe distance from the test equipment. By automizing the breaker control to a level where just a remote start signal is needed, no personnel have to be near the test set-up during the entire test procedure.
4.4. Measurements and evaluation
In order to increase the efficiency of the touch voltage measurements, specially designed modules are also being developed, illustrated as a voltmeter in Figure 4. These will automatically measure the touch voltages during the test and send the measured data to a computer for further evaluation. The voltage UTM will be measured according to procedures in EN 50522 [2], typically between an exposed part in contact with PEN conductor and a probe driven up to 20 cm deep into the soil 1 m from the object. The voltage measuring modules are designed to measure the touch voltage both without additional resistances in parallel to the voltage measurement, i.e., the prospective touch voltage, and the voltage over the human body simulated by a 1 kΩ resistor [2][6], i.e., the touch voltage. Measurements over a 1 kΩ resistor also complies with present Swedish regulations [1] and technical guidelines of Svenska kraftnät [7]. The measuring sequence of the specially developed voltage module will start before the test current is initiated and stop after test current is interrupted to measure the background noise before and after the test current injection. During the current injection of 0,3 s, the module will measure both prospective touch voltage and the touch voltage, all during the same test sequence. The test current IM will be measured by a current measuring module using a current shunt placed between the bottom of the resistor and tower earth electrode. The current measuring module is illustrated as an amperemeter in Figure 4.
The modules used for measurement are all to be synchronized with relatively small time differences, preferably <100µs, to allow for determination of the resistive and inductive component when evaluating the apparent transfer impedance. This synchronization will be realized by use of global navigation satellite system signals.
These measurements can owing to compensation, be made at sites with high levels of electrical disturbance and to reduce the impact of the background noise following method was used. This may sound complicated, but basically the complex results of the 50 Hz component obtained from the segments with background noise UTM0 are subtracted from the complex results of the segments during current injection UTM1 as shown in (3).
(3)
where UTM is the voltage change caused by test current IM.
Based on UTM and IM the apparent transfer impedance ZM can then be calculated as described in (1).
A more illustrative explanation for the compensation of the measured signal is given in Figure 5.
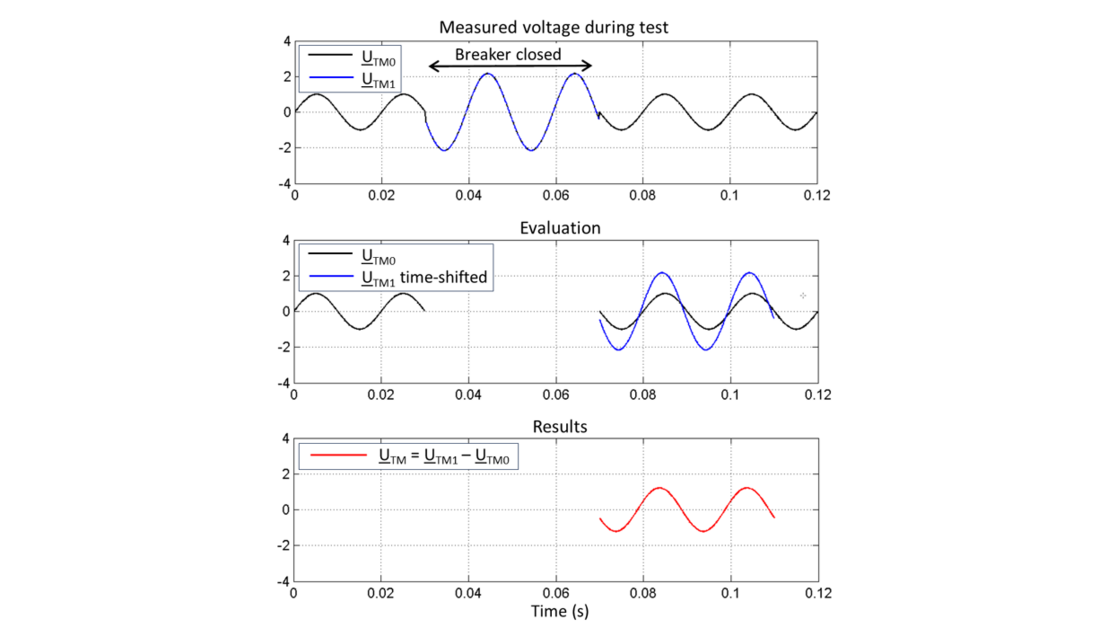
Figure 5 - Principle for compensation of the measured signal to obtain UTM caused by the test current
A few different algorithms have been tested for automatic analysis of these relatively short recordings. The best method found so far, is to make a fast Fourier transform, FFT, of a number of 60 ms segments in the measurement as indicated in Figure 10. Via FFT, the magnitude and phase of the fundamental frequency i.e. 50 or 60 Hz are obtained for each segment containing test current and no transients.
An overdetermined third-degree polynomial fit is made to determine the magnitude and phase of the fundamental frequency values on the segments recorded before and after injection of test current. Based on this curve fit, compensations are calculated for the various segments with test current, based on the time instant of these segments.
The segments with test current are then compensated based on these curve fit polynomials from segments with no test current, leaving basically only the resultant values caused by the test current. A quality check of the measurement results can also be made by comparing the results of segments which reflect similar conditions during one current injection.
5. Preliminary field test
To verify the high-voltage method in practice, a field test was performed at two towers, designated A and B. To allow for direct comparison between the new approach and the presently used method, measurements were also made by the heavy-current injection method. The methods were not applied simultaneously, but within a couple of hours, thus the same conditions in the earthing system are assumed in the comparison.
The field test was made on a 70 km long 220 kV overhead line, where high touch voltages had been measured earlier. The OHL has no earth wires at this section where the tests were performed and has wooden poles with an earth electrode at the tower leg connected to tower stays and metal crossbar. However, there are earth wires on short sections of the line at distance from the test sites, e.g. near the stations. Swedish 220 kV system is low-impedance earthed and the fault current is approximately 5 kA at the test sites. Measurements of touch voltages were made at nearby residential houses having LV-systems of TN-type.
Regardless of the measurement method applied, there will in most cases be unknown properties at the measuring site that will affect the results, e.g. various layers of soil or rock, buried conductors or pipes. However, the effects of these unknown properties will be captured in the measurements and is not expected to vary under persistent conditions.
5.1. Test procedure
After the OHL was taken out of service, the resistance of the tower earth electrode was initially measured to verify its integrity to be used for the test and also to be used as earth electrode for the planned work. The resistance values measured for the tower earth electrodes were 41 Ω for tower A and 26 Ω for tower B. For safety reasons, this verification must be made before the test, since too high resistance may result in harmful voltage at this point. To reduce the need for circuit-breaker and control equipment at the measuring site, the OHL circuit-breaker in the station was used for these tests, see Figure 6. Note that the figure is showing the principle, e.g. not reflecting the exact number of towers or distance to the station 70 km away. At the opposite end about 10 km from the test site, the OHL was open during these tests, but this will not be the case when the circuit-breaker is in place at the test site.
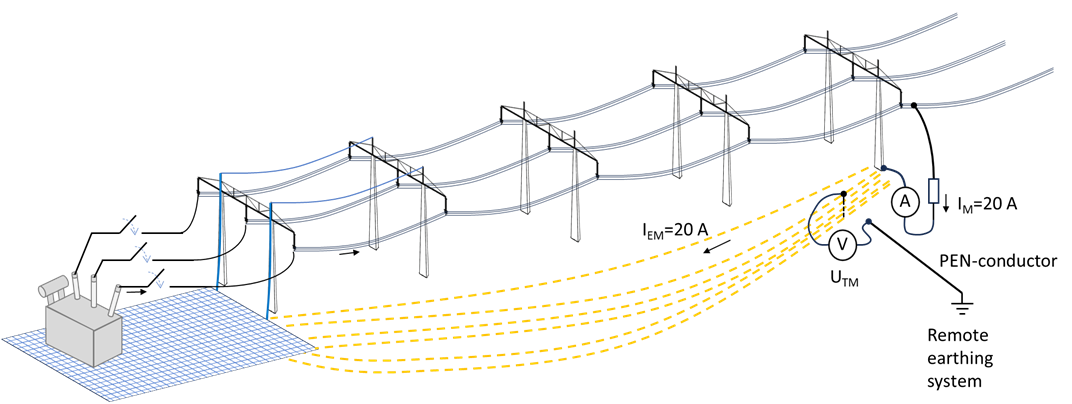
Figure 6 - Principle scheme for field test of high-voltage method. The line circuit-breaker in one station was used for the test and it was closed during 0,3 s
A specially designed and tested high-voltage water resistor was connected between one of the phase conductors and the tower earth electrode, see Figure 7. The water resistor was built using a 3,3 m long hollow core composite insulator, with special electrodes in the water. To avoid high pressure inside from the expanding water volume, the insulator was not closed, only covered at the top to prevent pollution to come in. The performance of the water resistor was verified in a high voltage laboratory up to 460 kV AC phase-to-earth before the site test. A blend of tap water and de-ionized water was used to achieve the target resistance which was verified by a megohmmeter before the tests. The water resistor was filled with a volume of 85 L and the water temperature and conductivity were measured before and after the tests at each site.
To allow for measurement of the test current, a low-resistance current shunt of 0,01 Ω was inserted in the connection close to the tower earthing.
When all the set-up of equipment was ready, the OHL circuit breaker in one of the stations was closed for 0,3 s, which energized the OHL and the connected resistor during a sufficient time to allow for the measurements. During that time nobody was allowed near the tower and the water resistor. All the three phases were energized during this test to allow for selection of the appropriate phase conductor upon arrival to the test site.
The test of the high-voltage method was carried out at two towers, and the touch voltages were measured at few different locations where significant touch voltages were expected. The measurement locations and their distance to the towers where the current was injected are shown in Figure 8 and Figure 9. For measurement of the test current and touch voltages, early-stage versions of the measuring modules were used with computer-based oscilloscopes connected in parallel. The modules for voltage measurements were connected between an earth rod driven 20 cm into the soil and to different exposed parts (fusebox and outlets) connected to a PEN conductor at LV-customers.
The test current was controlled to vary from 10 to 26 A during the tests. This was made by keeping the resistance of the water resistor between 4,2-10,5 kΩ, achieved by varying the conductivity of the water.
After the test with the high-voltage method was finished, measurements with the heavy-current injection method were made at the same measurement sites. The frequency of the test current for the heavy-current injection method was 40 Hz and the touch voltages were measured with a frequency selective voltmeter.
The prospective touch voltage was measured over a resistance >1 MΩ and the touch voltage was measured over a 1 kΩ resistance, by both the high-voltage and heavy-current injection method.
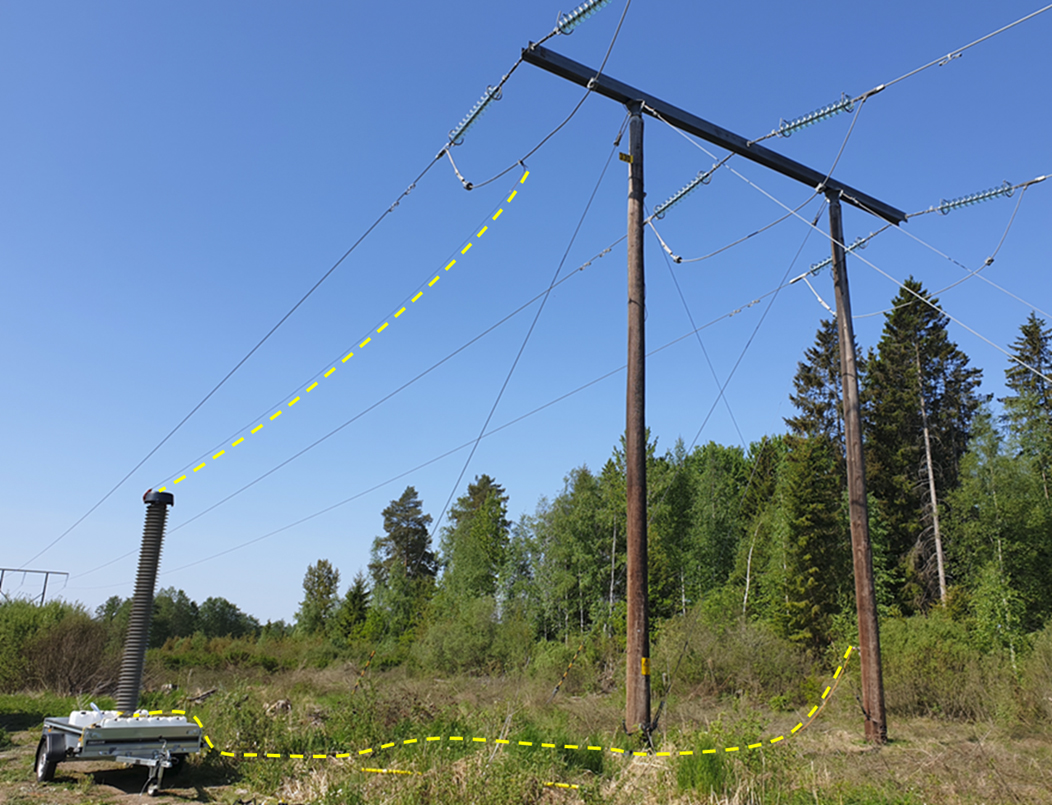
Figure 7 - High-voltage resistor connected to the outer phase conductor and the tower A earth electrode. The dashed yellow lines indicate the connections during test. The metallic crossbar is connected to the tower electrode and so are metallic stay wires
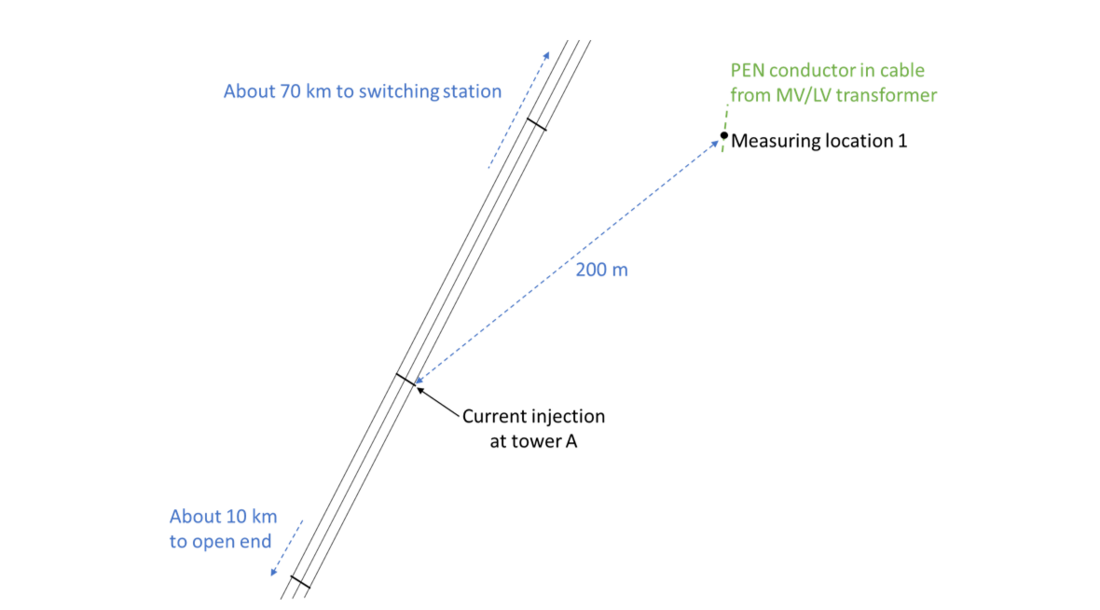
Figure 8 - Schematic sketch to describe the measuring location near tower A
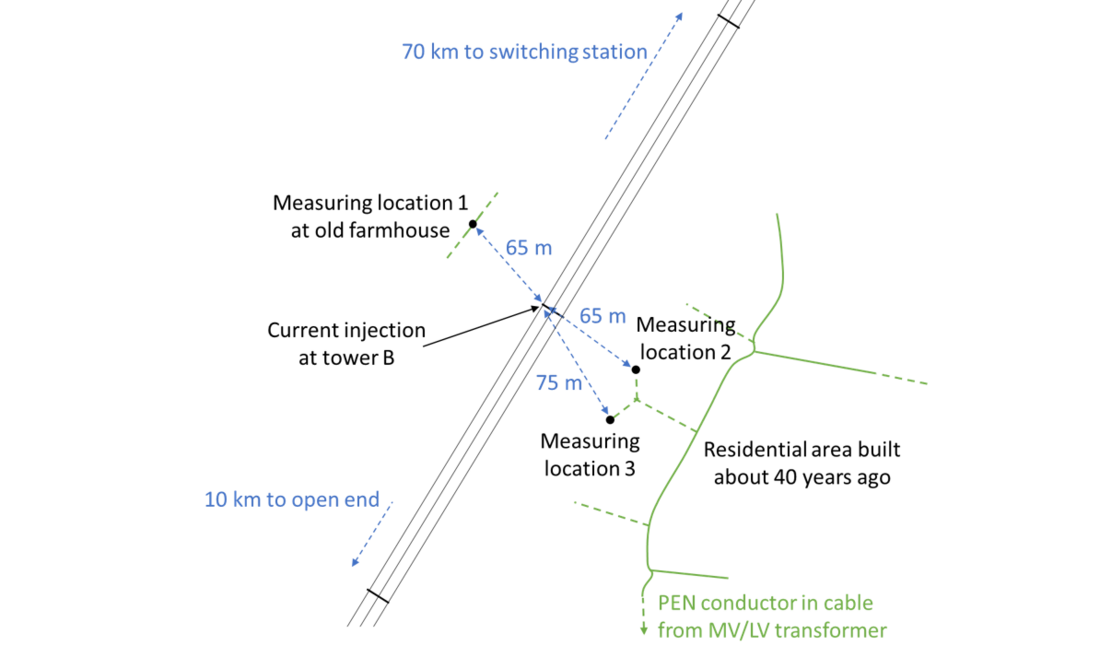
Figure 9 - Schematic sketch to describe the measuring locations near tower B
5.2. Results
The measurements of the current through the water resistor confirmed the design of the water resistor and that it, by just changing the conductivity of the water, is possible to control the current amplitude to not differ much from the target value. Also, the heating of the water by 1-2 degrees during each test was as expected, corresponding to the dissipated energy from Joule heating at 10-20 A and this led to a negligible resistance increase. It was noted that the temperature increase in the water resistor was larger due to solar radiation.
An example of measured current and voltage is presented in Figure 10, where the test current IM with an amplitude of 10,7 ARMS and the prospective touch voltage of 7,3 VRMS were measured at tower B, location No. 1. At this site, the measured voltages were basically purely resistive since there is no phase shift between voltage and current.
As mentioned earlier the measurements were divided into 60 ms segments, and several from each recording were evaluated. Segments without transients are selected for the analysis. For analyse of the background level directly before and after the current injection, segments S1, S2 respectively S7, S8 were used. S3-S5 were used for analysis of the levels during current injection. Switching off the line occurred in segment S6 which was therefore disregarded in the analysis. To make a quality check of the measurement, values for segments obtained from FFT can be compared, e.g. in Figure 10 the FFT results for S3, S4 and S5 do not differ much.
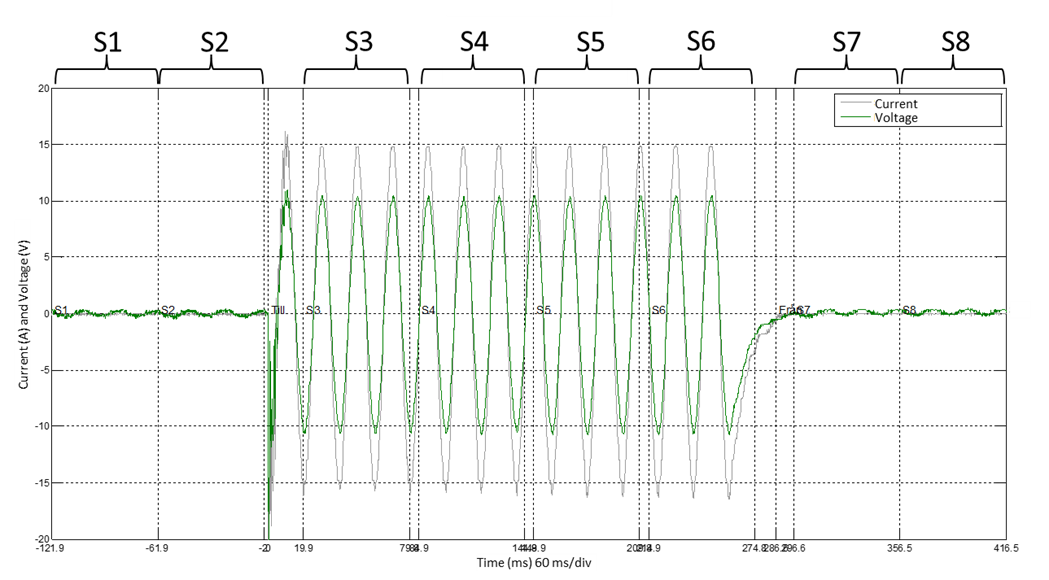
Figure 10 - Example of oscillogram showing recorded test current and voltage during the test measured without additional resistors simulating body resistance. The 60 ms segments S1-S8 indicated were used for FFT analysis
Before and after injection of the test current, the measured background noise UTM0 was less than 0,2 VRMS. The background noise was subtracted from the signal measured during the current injection UTM1 according to (3) and the resulting UTM was used for evaluating the apparent transfer impedance ZM as described in (1).
The repeatability of the high-voltage (HV) method was checked by repeating some of the test. It can be seen in Table 1 that the calculated apparent transfer impedance ZM is practically constant. It can be noted that the current amplitude increased slightly for each repetition of test due to the heating of the water in the high-voltage resistor, which leads to a decrease in resistance. Moreover, measurements were also made using the heavy-current injection (HC) method at tower A, location No. 1. Results in Table 1 shows that the values of ZM differ less than 5 % from the values obtained by the high-voltage method. To notify the multiple use of results obtained with the HC method, these results are marked by italic figures.
Location | Body resistance | HV method, 50 Hz | HC method, 40 Hz | ZM difference | |||||
Tower | Loc. | (Ω) | IM (A) | UTM (V) | ZM (Ω) | IM (A) | UTM (V) | ZM (Ω) | % |
A | 1 | >1 M | 26,9 | 8,67 | 0,322 | 6,5 | 2,15 | 0,331 | -2,8% |
A | 1 | >1 M | 28,8 | 9,11 | 0,317 | 6,5 | 2,15 | 0,331 | -4,5% |
A | 1 | >1 M | 30,2 | 9,67 | 0,321 | 6,5 | 2,15 | 0,331 | -3,1% |
Measurements were made using both methods also at tower B, and the results are presented in Table 2. Similar to the results in Table 1, the resulting impedance differ between the two methods, however, the differences can be considered as acceptable for the purpose of the measurements and the accuracy of the equipment used during the test.
Location | Body resistance | HV method, 50 Hz | HC method, 40 Hz | ZM difference | |||||
Tower | Loc. | (Ω) | IM (A) | UTM V) | ZM (Ω) 1 | IM (A) | UTM (V) | ZM (Ω) | % |
B | 1 | >1 M | 10,7 | 7,31 | 0,683 | 6,5 | 4,6 | 0,708 | -3,7% |
B | 1 | 1 k | 11,1 | 1,50 | 0,140 | 6,5 | 0,98 | 0,151 | -7,7% |
B | 1 | 1 k | 11,3 2 | 1,55 | 0,141 | 6,5 | 0,98 | 0,151 | -6,9% |
B | 2 | >1M | 12,0 | 3,89 | 0,344 | 6,5 | 2,4 | 0,369 | -7,3% |
B | 2 | 1 k | 12,2 2 | 0,67 | 0,059 | 6,5 | 0,39 | 0,060 | -1,7% |
B | 3 | >1 M | 12,7 2 | 3,10 | 0,265 | 6,5 | 1,85 | 0,285 | -7,4% |
B | 3 | 1 k | 13,0 2 | 0,43 | 0,037 | 6,5 | 0,27 | 0,042 | -12,3% |
B | 3 | 1 k | 13,1 | 0,46 | 0,038 | 6,5 | 0,27 | 0,042 | -9,3% |
1 Evaluation of ZM according to preliminary method for analysis of the measurements.
2 Recordings of the test current is missing, and the given values are estimations.
The low values of ZM measured over 1 kΩ at location 3 can be related to high resistance in the soil.
6. Discussion and conclusions
The initial studies have showed that the high-voltage method is a feasible method for measuring touch voltages in the vicinity of OHL. The method will make it possible to perform measurements while keeping the OHL in service. The method has been verified through preliminary field tests where the results show good conformity with the results from the presently used heavy-current injection method. As long as the circuit-breaker and HV-resistor is properly designed, the tests by use of high-voltage method are foreseen to simulate full scale earth faults as far as possible without creating such. This is due to the nature of the high-voltage test method where the test current is expected to be distributed similar as for a real earth fault.
Svenska kraftnät is now proceeding with the construction of a mobile test system for performing measurements with the high-voltage method on 400 kV OHL. The work will include development of a control and measurement system, establishing a procedure for connection to the phase conductor using a drone, and implementation of an SF6-free circuit-breaker.
References
- ELSÄK-FS 2022:1, "Regulations and general advice of the National Electrical Safety Board regarding the installation of electrical installations," Swedish National Electrical Safety Board, April 2022.
- EN 50522, "Earthing of power installations exceeding 1 kV a.c.," CENELEC, March 2022.
- CIGRE Technical Brochure No. 694, "Ground potential rise at overhead AC transmission line structures during power frequency faults," July 2017.
- CIGRE Technical Brochure No. 95, "Guide on the influence of high voltage AC power systems on metallic pipelines," 1995.
- CIGRE Technical Brochure No. 592, "Guide for Assessment of Transferred EPR on Telecommunication Systems due to Faults in A.C. Power Systems," August 2014.
- IEEE Std 81, "IEEE Guide for Measuring Earth Resistivity, Ground Impedance, and Earth Surface Potentials of a Grounding System," IEEE Power and Energy Society, December 2012.
- Svenska kraftnät Teknisk riktlinje TR15-13, "Luftledningar - Jordning," May 2018.