Small Signal Stability Analysis of Power Systems with a Very High Penetration of Converter Based Generation
Authors
Angel CLARK, Mehrdad GHANDHARI - KTH Royal Institute of Technology
Pinaki MITRA, Bahram SHAKERIGHADI - Grid and Power Quality Solutions, Hitachi Energy, Västerås, Sweden
Nicklas JOHANSSON - Hitachi Energy Research, Hitachi Energy, Västerås, Sweden

Summary
In this work, the small signal stability of a two-area four-machine test system and a reduced CIGRE Nordic system is analyzed. The effect on the stability of the system at high penetration levels of non-synchronous generation (NSG) as well as the placement and distribution of NSG are discussed in detail. The focus of this paper is on the behavior of the frequency and damping of the inter-area modes as the system approaches very low levels of inertia. A methodology to identify the inter-area mode frequency based on the system inertia is proposed. The developed theory is compared to the obtained eigen-value results for the small and large test systems, it is shown that the proposed methodology successfully predicts the inter-area mode frequency of the two test bed systems. Time domain simulations of the smaller test system are performed as a point of reference, in order to validate the eigen-value analysis. Additionally, the paper explores the impact of the inertia of grid-forming converters on the behavior of the inter-area mode frequency. Although, the focus of this paper is on the inter-area oscillations of two-area systems; the proposed theory is also applied to a multi-area frequency mode for the large test system and is validated.
Keywords
eigen-value, inter-area, NSG, small signal stability, wind power, VSM, multi-area, frequency, modes1. Introduction
Throughout the world, countries have made a strong and concerted effort to grow their proportion of power, which is produced from renewable, converter based generation such as wind and solar power [1]. Additionally, in order to adequately decrease carbon emissions within the coming years, there is an urgent need to increase the share of converter based generation. Consequently, bulk electrical power systems will begin to transition towards a majority share of converter based generation. It has been well documented that there will be significant power system stability issues associated with high levels of converter based generation and low levels of system inertia [2]-[3]. Grid operators already experience challenges at existing penetration levels, which are not yet at a majority share penetration [4]-[5]. Therefore, in order to facilitate a transition to power systems that are capable of providing a majority of their instantaneous generation from non-synchronous generation (NSG) sources, it is important to understand how system characteristics will change as systems approach very low levels of inertia.
The effect of the integration of converter based generation on the small signal stability of power systems has been studied extensively for many different systems and configurations. In [6], a Southeastern European system was studied for a high penetration of wind power in Greece. The damping of the electromechanical and inter-area modes generally improved with increasing wind power penetration. It was shown in specific scenarios, the damping of the modes can be reduced due to interaction with the voltage control modes of the wind power. However, these modes can be adequately controlled with proper selection of control parameters. In [7], interactions between the voltage controller of the wind power and the inter-area modes were also observed, which led to the instability of the electro-mechanical modes. By decreasing the gain of the reactive power control, the instability was mitigated. It was also shown that the frequencies of the inter-area modes increase with higher wind power penetration. Doubly-fed induction generator (DFIG) modeled wind farms were incorporated into a two-area five-machine system in [8]. The authors determined that the higher wind power penetration had a significant, positive effect on the inter-area mode damping of the system. Of the participating control states, the voltage control had the greatest effect and it was found that increasing the gain, aided the overall damping. Though, this system was only studied at a 10 and 20 percent penetration level. The effect of the control parameters was also discussed in [9] for a simplified system consisting of a generator, inverter and load. The authors highlighted that the interaction between the machine exciter and inverter control can be de-stabilizing. Additionally, it was found that by increasing the current control gains, the stability margin increased.
The Western Electricity Coordinating Council (WECC) system has been extensively analyzed. PV penetration levels up to 50% in the WECC system were studied in [10]. A sensitivity analysis identified that the damping of the modes was detrimentally affected by the loss of inertia. In [11], type 3 and type 4 wind turbines as well as solar photovoltaic (PV) were added to the WECC system. The state variables related to the converter based generation had very low participation in the traditional inter-area modes. Although, two new types of modes were identified within the inter-area electro-mechanical frequency range that were related to the state variables of the converter based generation. Lastly, the authors in [12] increased solar and wind power generation from the base case scenario for the WECC system. It was shown that the frequency of the modes increased with renewable generation and the damping was largely not affected.
The US Midwest interconnection was studied in [13]; it was concluded that the damping of the modes of the system can be both positively and negatively affected by an increased penetration of wind power. The effect of wind power integration was analyzed for the New Zealand test system in [14]. The authors demonstrated that the damping was comparable for the studied base case, in comparison to the integrated wind power scenarios. Time domain simulations were used to observe the inter-area modes of a reduced CIGRE Nordic system for scenarios integrating different forms of wind power generation technology [15]. Specifically, it was observed that the DFIG scenario slightly decreased the damping of the inter-area modes, but did not have a great effect overall.
Solar PV was incorporated into a two-area four-machine system in [16]. The damping of the inter-area mode improved when solar PV was placed in Area 1. However, when it was added to Area 2, the damping initially improved and then worsened with increasing solar PV penetration. The authors highlighted that the impact on the inter-area modes is dependent on the location of the integrated solar and removal of the inertia. In [17], the effect of placement was also explored. It was shown through analysis of the SE Australia network that the placement of voltage source converters can impact the achievable penetration level.
Based on the existing literature, it can be concluded that the specific results are highly dependent on the system configuration, excitation system, type of PSS as well as the voltage control of the NSG. The damping can both improve and worsen with increased penetration for the inter-area and local modes. Also, under certain conditions the voltage controllers of the NSG may interact with an inter-area mode. However, this is specific to certain controller parameters and bandwidth as well as the frequencies of the critical inter-area modes.
One generalized conclusion that can be drawn, is that the frequency of the inter-area modes increases with higher NSG penetration. Within the studies that have been performed, a limited level of NSG was often studied, below majority share. The effect of the placement of NSG within the system on the inter-area mode frequency and damping was not fully explored. As well as the analysis of the inter-area mode frequency for systems with grid-forming converters and the impact of the inertial contribution they can provide. The contributions of this paper include the rigorous analysis of the inter-area modes for a progressive increase of NSG to levels beyond majority share. The novelty of this work is the proposed methodology to predict the inter-area mode frequency, based on the distribution of inertia throughout the system. To the authors’ knowledge, no such theory has been proposed linking the frequency of the inter-area mode to the spatial distribution of inertia. Using this method, a derived expression can be used to estimate the inter-area frequency, without requiring detailed studies and system knowledge. This is an important area of focus, considering that installed renewable generation may be clustered into specific, resource dense areas. This method highlights the relationship between inertia and the inter-area frequency, leading to an increased understanding of the system dynamics that will occur with changes in network topology.
In this paper, the analytical formulation for the inter-area mode frequency will be presented in Section II. In Section III, the small and large test systems, modeling of the NSG as well as the studied wind power scenarios will be discussed. The characteristics of the critical inter-area modes from the eigen-value analysis will be studied in Section IV for both test systems, according to different distributions of NSG connected using the grid-following converters. The modes found from the eigen-value analysis will be compared to the predicted inter-area mode frequencies from the proposed theoretical formulation, to assess its accuracy. Time domain simulations are performed to compare the results to the small signal stability analysis. The inter-area mode frequency of the small-test system with NSG connected grid-forming converters is also studied. Lastly, the efficacy of the proposed formulation for potential multi-area modes is assessed.
2. Theory
2.1. Small Signal Stability Analysis
Small signal stability refers to the ability of a system to return to a stable operating point, after a small disturbance. This form of stability analysis solely concerns the effect of small disturbances on the system, therefore the linearization of the system equations is a valid approach to study the system behavior [18]. To analyze the small signal stability, the critical eigen-values or modes and their respective participation factors can be found. Assuming the system dynamic can be adequately captured from a set of differential and algebraic equations:
(1)
(2)
The equations are then linearized and the Jacobian matrices of the system are found [19]:
(3)
(4)
The state matrix can then be derived. The eigenvalues are then determined from the state matrix and the corresponding damping ratio of each eigen-value can be identified:
(5)
(6)
(7)
The right and left eigen-vectors are found, pertaining to the eigen-value λi, which satisfy the following equations:
(8)
(9)
The participation factor can be found by the equation below from the corresponding elements of the left and right eigen-vectors. It represents the degree of participation of a state variable k in mode i:
(10)
2.2. Identification of the Inter-Area Mode Frequency
Inter-area oscillations, or electro-mechanical oscillations between groups of generators that occur over long distances, are of particular interest. Poorly damped inter-area modes can cause oscillations of line currents that can trigger protection circuits and lead to cascaded tripping. As the generation mix of synchronous generation (SG) and non-synchronous generation (NSG) begins to change, the behavior of the electro-mechanical oscillations will alter as well. Here, a method is proposed to predict the frequency of the inter-area mode as a function of grid inertia. Utilizing this approach, one is able to see the impact that increasing NSG and decreasing SG has on the inter-area mode characteristics of the system. First, the electro-mechanical equation of a classical synchronous generator model can be defined as:
(11)
J [kg·m²] is the moment of inertia, ωm [rad/s] is the rotational speed of the machine, Pm [W] is the mechanical power generated by the turbine and Pe [W] is the produced electrical power. The damping constant of the generator is not modeled in (11). It is straightforward to model the damping constant of a single generator. However, the modeled generators for this application represent an aggregation of several generators and loads in a given grid area. The specific voltage control and frequency dynamics of the loads and generators are too complex to make a general approximation. Further, the rating of the generator is modified at various NSG penetration levels, which will have an additional effect on the voltage and frequency dynamics. These dynamics additionally will be highly dependent on the geographical location of the generators and loads. Rather, the focus of this work is on the prediction of the inter-area mode frequency and therefore the voltage dynamics are not modeled. The inertia constant H [s] can be further written as:
(12)
The rotational energy of the machine is Er [J], ωmo [rad/s] is the nominal rotational speed of the machine and SB [W] is the three-phase rating of the generator. The electrical angle δe [rad] is directly proportional to the mechanical angle δm [rad], based on the number of poles in the machine and it is assumed that the electrical speed ωeo is close to its nominal value. Considering that ωm = dδm/dt, therefore by (11) and (12), the equation below is given:
(13)
For a simplified dynamic study, it can be assumed that a power grid area A with multiple loads and synchronous generators can be represented as an aggregated synchronous generator with an inertia constant HA. Such inertia constant is calculated as the total rotational energy of all of the machines in the grid area divided by a sum of the ratings of the machines.
(14)
In this representation, ErA is the total rotational energy in the grid area and SBA is the total installed generation. The focus of this analysis is on the inter-area modes, therefore the local intra-area electromechanical oscillations within the grid area have been neglected.

Figure 1 - Aggregated Grid Area Representation
It is initially assumed that the two grid areas A and B are connected by a long distance transmission line as seen in Fig. 1. For both grid-areas, an aggregated synchronous machine is used to represent the areas; the inertia of the areas are expressed by HA and HB, electrical angles δA and δB, installed base ratings SBA and SBB, and internal generator voltages E’qA and E’qB. The impedance between the two generators is an inductive impedance X. The electrical power can therefore be expressed as:
(15)
Here, it is assumed that the steady state electric power is equivalent to the mechanical power of each machine. The electrical power can then be linearized around the initial angle difference at equilibrium δstat = δAo − δBo and can be written as:
(16)
Using (13) and (16) the following equations can be obtained:
(17)
(18)
The difference between the two derived expressions can be derived as:
(19)
The constants used in (17)-(19) are defined as:
(20)
(21)
Here, Pemax is the maximum power that can be transmitted over the transmission line. It can be assumed that the difference in the deviation of the rotor angles of generator A and generator B can be expressed as an oscillatory function with an amplitude α and a frequency ωosc, such that it is the frequency of the inter-area oscillation that occurs between grid area A and grid area B:
(22)
Using (22) in (19), an expression for ωosc can be derived:
(23)
An equivalent inertia constant, Heq, is defined based on the total rotational energy in the respective grid area ErA=HASBA and ErB = HBSBB:
(24)
Here, SBase can be arbitrarily defined. Thus,
(25)
(26)
In the defined expression, k is a constant that can be approximately estimated based on the above equations with knowledge of the power system data. The inter-area mode frequency is estimated using an aggregated two machine system that represents two grid areas connected by a long transmission line. The inter-area mode frequency is studied at different levels and distributions of inertia as the converter based generation changes within the system. It is a suitable approach to solely model the generators and their changing inertia levels, considering that the modeled converter based generation is PLL based. The PLL dynamics are much faster than the inter-area mode dynamics. Considering the inter-area time-scale, the NSG may thus be approximated as constant active power sources, which do not affect the inter-area oscillation frequency significantly. The simplified approach used in this paper neglects the influence that the slower voltage control loop of the NSG may have on the inter-area oscillations. This is done since this is among other things dependent on the placement of the loads and their voltage dependence; aspects that cannot easily be taken into account in an approximate analytical model. Therefore, it is reasonable to neglect them within the overall analytical expression.
Based on the developed theory, it can be concluded that the oscillation frequency between grid areas A and B is inversely proportional to the square root of the equivalent inertia calculated. Furthermore, the equivalent inertia term primarily governs the inter-area frequency. It is clear that a decrease of inertia will result in a higher frequency. It can also be observed that an unequal distribution of inertia will have a greater impact on the equivalent inertia and the overall inter-area mode frequency. Using this formulation, an approximate relationship between the inertia and inter-area mode frequency of the system can be easily predicted. Using this formulation, the relationship between the inertia and inter-area mode frequency of the system is shown through a simplified expression. The inter-area mode frequency can then be predicted after determining the equivalent inertia of the system.
2.3. Virtual Synchronous Machine (VSM) Converter
A grid-forming converter is a type of converter that is designed to emulate the behavior of a synchronous generator and is able to provide voltage and frequency support [20]. In this paper, the virtual synchronous machine (VSM) will be studied and its dynamic is governed by (27). The angular frequency of the VSM is ωVSM [rad/s], ωset [rad/s] is the rated frequency of the VSM, Pset [W] is the active power set point and Pmeas [W] is the measured active power. Dp is the modeled damping coefficient of the VSM, TA [s] is the emulated mechanical time constant and H [s] is the modeled inertia time constant:
(27)
Ta = 2H. (28)
3. Methodology
3.1. Two-Area Four-Machine System
The two-area four-machine system shown in Fig. 2, used for this analysis is adapted from the classical test system [19]. The length of the parallel transmission lines from Bus 7 to Bus 9 has been modified to 200 km. The generator inertia has been lowered to 3 s for G1, G2 and 2.5 s for G3, G4 from the values in [19] in order to model hydro synchronous generators. The power transfer across the long transmission lines, from Area 1 to Area 2 is 400 MW. The modeled loads are constant impedance loads. All of the generators in the system have a thyristor exciter with a high transient gain and a Power System Stabilizer (PSS) (IEEE PSS1A) [19]. G1 and G3 provide governor response, a mechanical hydraulic governor and a hydro model based on IEEE type non-elastic water column with no surge tank turbine [21] is used.

Figure 2 - Two-Area Four-Machine Base System
3.2. CIGRE Nordic System
The CIGRE Nordic32 system is an established 32 node model that was designed to represent the Nordic power system. For this application, it is being used as the large test-bed system. The model was developed by the CIGRE working group [22]; it represents the Nordic power grid at the time of development. A one-line diagram of the system can be seen in Fig. 3. There are four main grid areas in the CIGRE Nordic32 system: the North, Central, Southwest and External regions. It can be seen that the North and Central region are interconnected through long transmission lines. The aggregation by the long distance transmission lines represents a distribution between the two areas, North/External and Central/Southwest. Therefore, the system can be considered as analogous to the two-area four-machine system, which is comprised of two grid areas. The generators in the system have an excitation system with an automatic voltage regulator (AVR) and PSSSTAB2A [22]. Many of the generators in the North and External regions are equipped with hydro governor response. The active power loads are modeled as constant current loads and the reactive power loads are modeled as constant impedance loads, according to the voltage dependency of the load assumptions stated in [22], however the frequency dependency of the loads is not modeled.
3.3. Modeling of Full Rated Converter Model
A full rated converter wind turbine generator model is used to model the NSG in the CIGRE Nordic32 and two-area four-machine system. In this model, the DC voltage dynamics are not considered and an average converter model is utilized, which is in PQ control mode. It is assumed that due to the timescale of the DC voltage dynamics, there are no interactions with the inter-area modes so therefore this is an appropriate assumption. A wind farm is modeled through the application of a scaling factor. The inner and outer current control of the model employ a PI regulator.
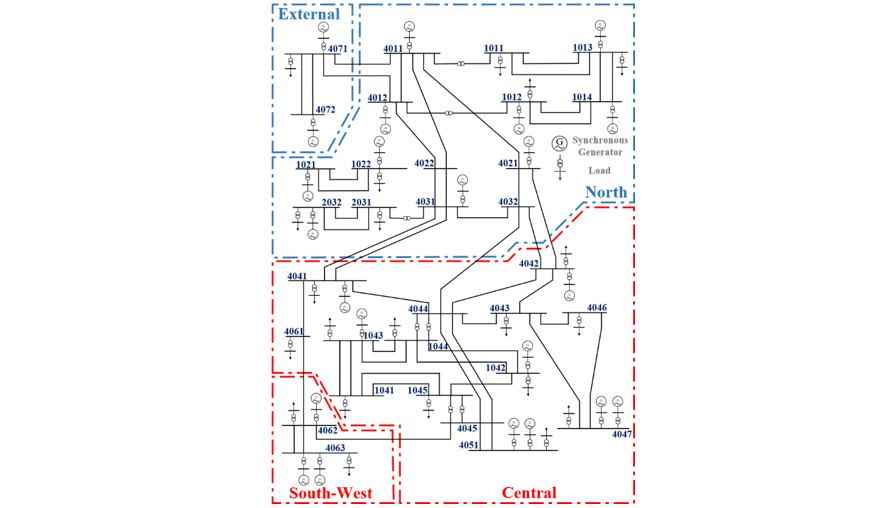
Figure 3 - CIGRE Nordic32 Base System
A supplementary voltage control is added to the outer loop current control of the converter model. This control loop is based on QU-droop and can be seen in Fig. 4. Many countries require NSG to provide voltage control as part of their grid code, therefore it is integral to model such capability in this study. The applied voltage control is based on the UK grid code for voltage control of NSG [23]. The voltage controller is intentionally designed to be slow and facilitate post-fault recovery, such that the control is not enabled during fault conditions. The grid code requirements specify a 4% droop, combined with a slow response time [23]. So, a voltage variation of ∆U of 4% should yield a maximum reactive power response ∆Q of 0.5 pu according to [23]. Therefore a “slow” time constant of Tqu=0.8 s and the gain based on the previous specified requirements Kqu=12.5 are applied.

Figure 4 - QU Droop Control Block Diagram
3.3. Modeling of VSM
The Virtual Synchronous machine model was used to analyze the effect of grid-forming converters and virtual inertia. The DC voltage dynamics are not modeled and an average converter model is used. The active power control loop of the VSM is shown in Fig. 5. The damping of the modeled VSMs is Dp = 35 pu/pu. The mechanical time constant of the VSMs in Area 1 is TA=5 s or H=2.5 s and in Area 2 the values are TA=5 s or H=2.5 s. The inertia time constant of the VSMs was set to be the same as SG1 and SG2 in Area 1 and SG3 and SG4 in Area 2.

Figure 5 - VSM Control Block Diagram
3.4. Integration of NSG to the Test Systems
NSG is incorporated into both systems, by adding a wind farm at each generation node. The specific converter type, the grid-forming and grid-following converter is then specified within the case. The base rating and the active and reactive power output of the SG is then decreased as the NSG rating and active and reactive power is correspondingly increased [24]. The power flow of the system at the generation nodes is therefore preserved. Decreasing the rating of the SG represents a loss of inertia to the system. The representation of the penetration level used to define the NSG penetration is described in (29). SGact is the sum of the base ratings of the synchronous generators in the acting case and SG0 is the sum of the ratings in the base case.
(29)
3.5. Studied Scenarios, Integration of Full Rated Converter
In the CIGRE Nordic32 system a capacity factor ratio of 2 is used, meaning that the rating of the NSG is twice the SG rating it is replacing. The capacity factor ratio that is used for the two-area four-machine system is 1.5.
3.5.1 Two-Area System, Integration of Full Rated Converter
Two different sets of scenarios are studied for the two-area four-machine system. In the first set, NSG is distributed evenly throughout the system, in Area 1 and Area 2. In the uniform scenarios, the NSG penetration is increased from 0% to 80%, in 10% increments, according to Table 1. In the second set of scenarios, a non-uniform and aggregated distribution of NSG is studied, where the NSG is only incorporated at Area 1 as described by Table 2. Only the generator ratings and power of generators 1 and 2 are reduced and the rating and power outputs remain the same in generators 3 and 4, in Area 2. For the aggregated scenarios, the total NSG penetration is increased up until 40%, because the NSG is solely concentrated in Area 1. A 40% total NSG penetration, therefore means that 80% of the generation in that area is coming from non-synchronous sources. It is important to note that a key feature of the two-area system is that the generation between Area 1 and Area 2 is spread uniformly throughout the system. The objective of studying two sets of scenarios was to analyze how the inter-area mode frequency was impacted by the distribution of inertia.
3.5.2 Nordic System, Integration of Full Rated Converter
For the CIGRE Nordic Test system, uniform and aggregated scenarios are also analyzed. For the uniform distribution cases, the penetration is increased from 0% to 80% in steps of 10%, as in the two-area cases. In the aggregated cases, the NSG is concentrated in the Southwest/Central area. Within the aggregated scenarios, the penetration is increased from 0% to 30%, in steps of 10%. It is important to note, that unlike the two-area system, the generation is not balanced between the aggregated regions of the CIGRE Nordic32 system. There is significantly more generation in the North/External regions than in the Southwest/Central regions. So, a total NSG penetration of 30%, when NSG is aggregated in the Southwest/Central regions, means that 85% of the generation in this area comes from NSG sources.
| Case (%) | SG1/G2 (MVA) | SG3/G4 (MVA) | SNSG1/NSG2 (MVA) | SNSG3/NSG4 (MVA) |
|---|---|---|---|---|
| 0 | 900 | 900 | 0 | 0 |
| 10 | 810 | 810 | 135 | 135 |
| 20 | 720 | 720 | 270 | 270 |
| 30 | 630 | 630 | 405 | 405 |
| 40 | 540 | 540 | 540 | 540 |
| 50 | 450 | 450 | 675 | 675 |
| 60 | 360 | 360 | 810 | 810 |
| 70 | 270 | 270 | 945 | 945 |
| 80 | 180 | 180 | 1080 | 1080 |
| Case (%) | SG1/G2 (MVA) | SG3/G4 (MVA) | SNSG1/NSG2 (MVA) | SNSG3/NSG4 (MVA) |
|---|---|---|---|---|
| 0 | 900 | 900 | 0 | 0 |
| 10 | 720 | 900 | 270 | 0 |
| 20 | 540 | 900 | 540 | 0 |
| 30 | 360 | 900 | 810 | 0 |
| 35 | 270 | 900 | 945 | 0 |
| 40 | 180 | 900 | 1080 | 0 |
3.6. Studied Scenarios, Two-Area System Integration of Virtual Synchronous Machine
Two different sets of scenarios were studied for the integration of VSMs into the two-area system. In both sets of scenarios, the NSG was distributed uniformly and increased from 0-80% in 10% increments. In the first set, the rotational energy (12) of Area 1 and Area 2 was constant meaning that the capacity factor was 1. Therefore, the rotational energy of the two areas was constant as NSG penetration increased. In the second set of scenarios studied, the capacity factor ratio was set to 1.5, according to Table 1. Meaning that the rotational energy of Area 1 and Area 2 was increasing as NSG penetration increased.
4. Results
4.1. System Level Eigen-value Analysis of the Two-Area System
An eigen-value analysis of the two-area four-machine system was performed for the uniform NSG distribution scenarios that are defined in Table 1. In each studied case, there is an inter-area mode between Area 1 and 2, which has different characteristics and can be seen in Fig. 6. The damping ratio of the mode is shown on the x-axis and the frequency of the mode is shown on the y-axis. Overall, the inter-area modes are well damped with a damping ratio between 26% and 30%. Initially, the damping improves with increasing NSG penetration but this trajectory stops after transitioning to a majority share at 50% penetration. The damping ratio then decreases and is worse than the original base case at 80%. The frequency of the inter-area mode increases with the penetration level. Additionally, above the NSG penetration of 60%, the frequency of the inter-area mode begins increasing more rapidly. Generally, for electro-mechanical oscillations the inter-area mode frequency range is between 0.1 to 1 Hz. However, as the generation of the system shifts to predominately power electronics based, this may no longer be relevant. As inertia decreases and the faster control of power electronic devices begin to govern the system behavior, the general frequency range of inter-area modes and local modes may as a whole increase. The inter-area mode frequency range for the uniform two-area cases spans between 0.8-1.7 Hz.
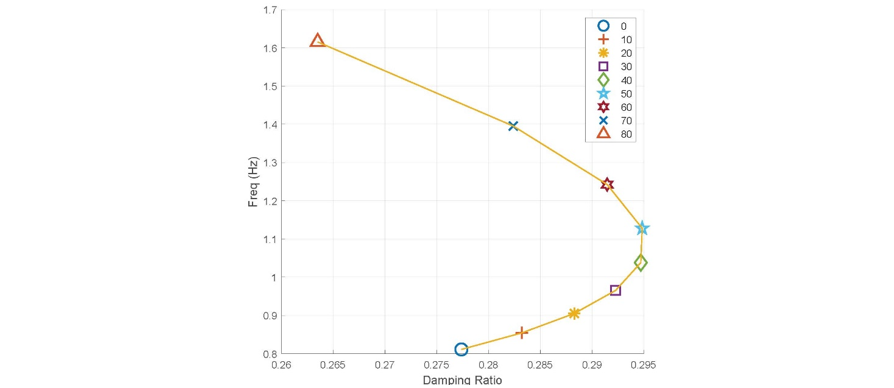
Figure 6 - Frequency and Damping of the Inter-Area Modes at Uniform NSG Penetration Levels of Two-Area System
The inter-area mode of the aggregated scenarios can be seen in Fig. 7. In the aggregated scenarios, the NSG is aggregated in Area 1 according to Table 2. Again, the modes are well damped. However, here the damping decreases with increasing penetration. The mode trajectory is different in the aggregated distribution scenarios than the uniform scenarios. The distinction between the sets of scenarios is how the NSG is distributed within the system, not the total system level penetration. It is consistent that the frequency of the inter-area modes also increases with greater penetration. At penetration levels greater than 20%, the inter-area mode frequency is greater than 1 Hz.
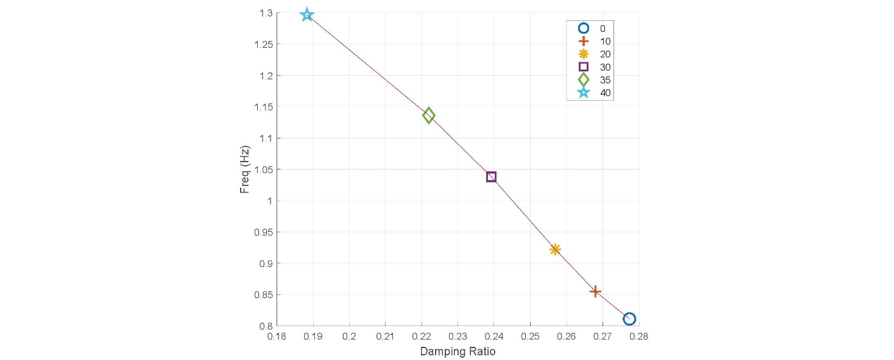
Figure 7 - Frequency and Damping of the Inter-Area Modes at Aggregated NSG Penetration Levels of Two-Area System
4.2. System Level Eigen-value Analysis of the Nordic System
The critical inter-area mode of the uniform distribution cases at different NSG penetration levels for the CIGRE Nordic system are shown in Fig. 8. The inter-area mode is less well damped than in the respective two-area system, with a damping ratio between 3.5%-7%. The damping becomes worse with increasing penetration up until 60%. The damping trajectory slightly improves at the 70% and 80% cases, however the overall damping of the modes remains less than in the base case scenario. Again, the frequency increases with penetration level.
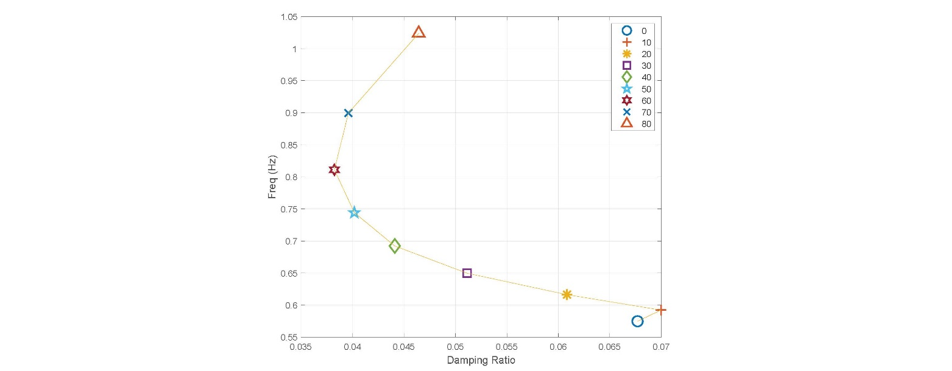
Figure 8 - Frequency and Damping of the Critical Inter-Area Modes at Uniform NSG Penetration Levels of CIGRE Nordic System
The critical inter-area mode of the aggregated SW/Central scenarios of the CIGRE Nordic system are shown in Fig. 9. The damping improves with the increasing NSG penetration up until 20%. From 20% to 30%, the damping ratio decreases by roughly 3%. However, the damping ratio is higher than the original base case scenario. The movement of modes differs from the uniform scenarios, where the modes initially became less stable with increasing penetration. The frequency of the critical inter-area modes increases with higher penetration, especially from 20% to 30%. This can most likely be attributed to the high degree of NSG penetration and correspondingly low inertia in the SW/Central region at 30% total NSG penetration, which corresponds to 85% in the SW/Central region.
Summarizing the observed results up until this point, between both the small and large test-systems the frequency of the inter-area modes increases with penetration. However, no clear relationship between the damping of the inter-area modes and the NSG penetration can be established. The damping of the inter-area modes can increase or decrease, as penetration increases and is dependent on the specific scenario. Furthermore, the observed results are not consistent between the small and large test-systems, in terms of the damping characteristics. For example, the damping decreases for higher NSG penetration in the aggregated two-area system. However, for the CIGRE Nordic system the damping generally improves when the NSG is aggregated in the SW/Central area.
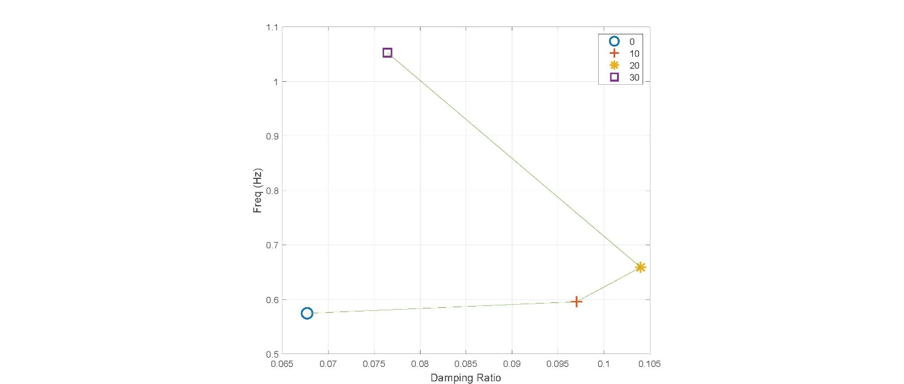
Figure 9 - Frequency and Damping of the Critical Inter-Area Modes at Aggregated NSG Penetration Levels of CIGRE Nordic System
4.3. Validation of Inter-Area Mode Identification, Full Rated Converter
In Fig. 10, the identified critical inter-area modes of the linearized two-area system model are shown in red and blue for the distributed and aggregated scenarios respectively. The inter-area mode frequency is plotted versus the equivalent inertia (Heq) for each scenario. Based on (20), (24) and (26) the fitting constant k can be calculated analytically using knowledge of system configuration. A simpler and more direct approach, however is to calculate the fitting constant k based on the known inter-area frequency and the rotational energy in the two distinct areas according to the penetration level. After determining k at one penetration level, it can be used as the fitting constant for the remaining scenarios. Considering that the general inter-area frequency and rotational energy in distinct areas are relatively known values, this is a straightforward approach to calculate the fitting constant. The analytical expression can then be used to predict how the inter-area frequency will change when the NSG and Heq varies for that system. The fitting constant was calculated at two different penetration levels at the base scenario when there is 0% penetration and at 50% for the uniform scenario, corresponding to k1=8.41 and k2=8.27 respectively. This was done to illustrate that the fitting constant k can be calculated at different NSG penetration levels and show the difference in the predicted inter-area mode frequencies. Here, it can be observed that the formulation developed gives a good prediction for the inter-area mode frequency of the system as the balance of SG and NSG changes for different distributions of system inertia. The inter-area mode frequency of the distributed scenario at 70% is roughly 1.4 Hz. At 40%, for the aggregated scenario, the frequency is approximately 1.3 Hz. For these two cases, the difference in penetration level is quite significant, however the inter-area mode frequencies are very similar. Further, their equivalent inertia values are quite close as well. This provides an indication, that it is not necessarily the total NSG penetration of the system that is governing the inter-area mode frequency behavior. Rather, it is the distribution of inertia throughout the system, which is highlighted by the derived equation (26), which determines the frequency.
This analysis was repeated for the CIGRE Nordic system. This was done to observe if the inter-area mode identification adequately predicted the frequency for a more realistic, large test system as well as systems of different sizes. In this case, the fitting constant was found in the same procedure as described for the two-area system. Using the known-inter area frequency at 0% and 50% penetration and the rotational energy in the grid-areas the calculated k constants were k1=4.57 and k2=4.18 respectively. From the results, the theoretically derived inter-area modes predicted the experimentally found inter-area mode frequencies well. Based on this study, it can be concluded that the theoretically derived inter-area mode frequency from (26) has been experimentally validated to determine the inter-area mode frequency for different distributions of NSG. Looking at two specific scenarios, for the large test system, at the 80% distributed scenario the inter-area mode frequency is very close to the frequency of the 30% aggregated scenario. Both inter-area mode frequencies are around 1.05 Hz and their equivalent inertia values are roughly 0.4 s. So, for this more realistic test system the observation also holds that it is the equivalent inertia, which drives the inter-area mode frequency. For the large and small test system, the obtained theoretical expression accurately predicts the inter-area mode frequency when compared to the inter-area mode frequency found from the eigen-values of the linearized system. The accuracy of the results justifies the use of the simplified analytical model. A main benefit of this approach is the gained understanding of the system dynamics. Further, the inter-area mode frequency can be found through the use of a very simple expression rather than time-consuming detailed studies.
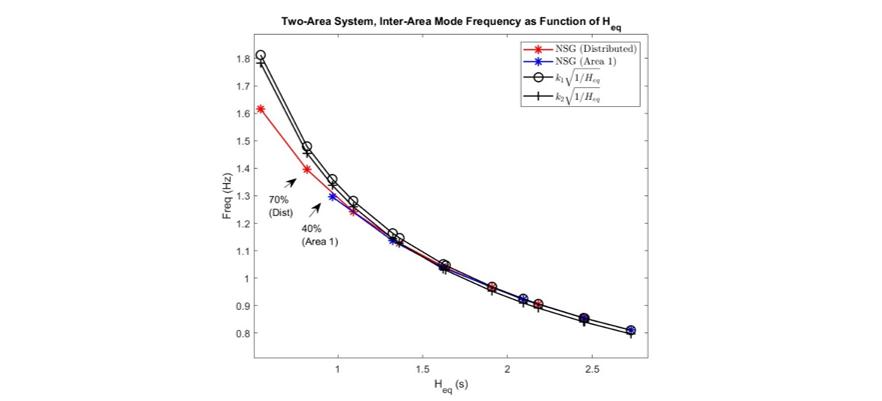
Figure 10 - Comparison of Inter-Area Mode Frequency from Eigen-value and Theoretical Analysis of Two-Area System
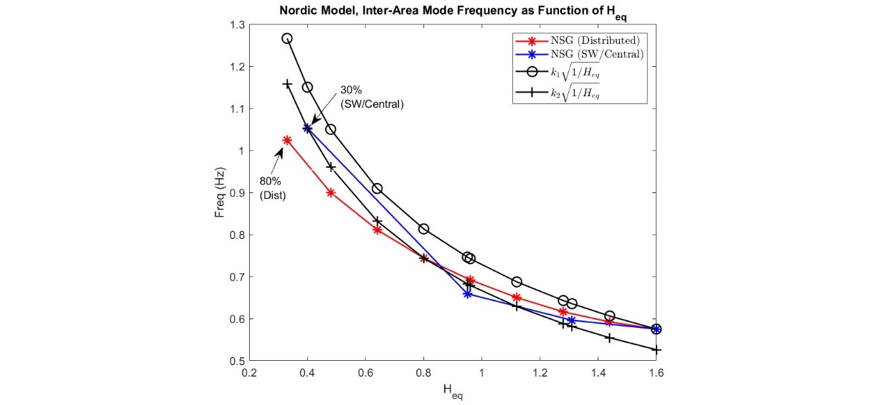
Figure 11 - Comparison of the Critical Inter-Area Mode Frequency from Eigen-value and Theoretical Analysis of CIGRE Nordic System
4.4. Time Domain Simulations
RMS based time domain simulations were performed, to validate the small-signal stability results. For the two-area four-machine system, a 30% load step was applied to L7 for 100 ms in order to simulate a small disturbance and verify the eigen-value results. The rotor angle deviation of generator 1 is shown for the base case, 50% NSG and 80% NSG case in Fig. 12. G1 participates the most in the inter-area mode. Based on the response, all of the generators are stable. The frequency of the oscillatory response is compared to the frequency from the inter-area mode eigen-value in Table 3 and are very similar. The responses of the generators are similarly damped as well, which matches the damping ratios found from the obtained eigen-value results.
A three-phase short-circuit solid fault was applied at the middle of the bottom line of the parallel 100 km transmission lines from Bus 7 to Bus 8, in the two-area system. This was done to simulate a larger disturbance to the system and analyze the response. For the application of the small disturbance, the damping of the rotor angles had similar damping characteristics between the studied scenarios, which aligned well with the eigenvalue results.
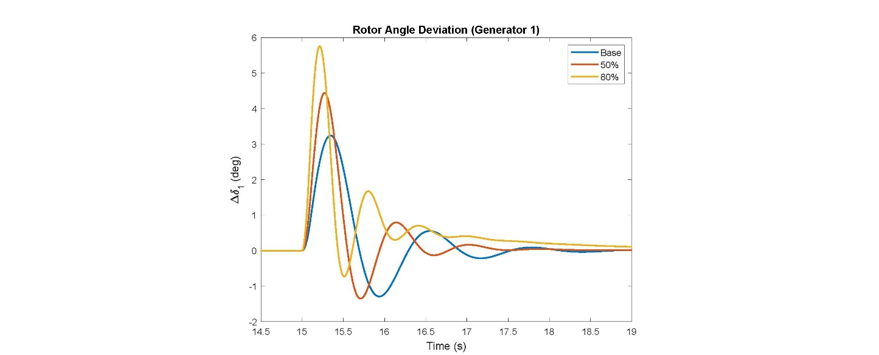
Figure 12 - Time Domain Simulation of Two-Area System, Different NSG Penetration Levels, Small Disturbance
| Scenario (%) | ƒ( (Hz) | ƒ (Ld Step) (Hz) | Damping Ratio ( (%) |
|---|---|---|---|
| 0% | 0.81 | 0.83 | 27.7 |
| 50% | 1.13 | 1.17 | 29.5 |
| 80% | 1.62 | 1.67 | 26.3 |
However, looking at the rotor angle deviation of generator 1, when the fault is applied as shown in Fig. 13 this is clearly not the case. The deviation of the rotor angle for the 80% scenario is much larger and poorly damped, in comparison to the other scenarios. It is important to note that for the 80% scenario, the simulation yielded a non-convergence for a short time period from 16.01 to 16.08 secs. This poor response can be anticipated, due to the significantly low level of inertia in the case, causing a larger rate of change of frequency (ROCOF) and change in the generator angle. However, all of the generators return to synchronism after the initial disturbance. Additionally, the rotor angle response at 50% was better than at the base case scenario. It was found that the response of the generator PSSs was significantly better at 50%. Small signal stability analysis is a valid method to analyze the system under small disturbances and can provide valuable insights into the system characteristics. However, it cannot encompass the manner in which all aspects of the system dynamics will change especially during large disturbances.
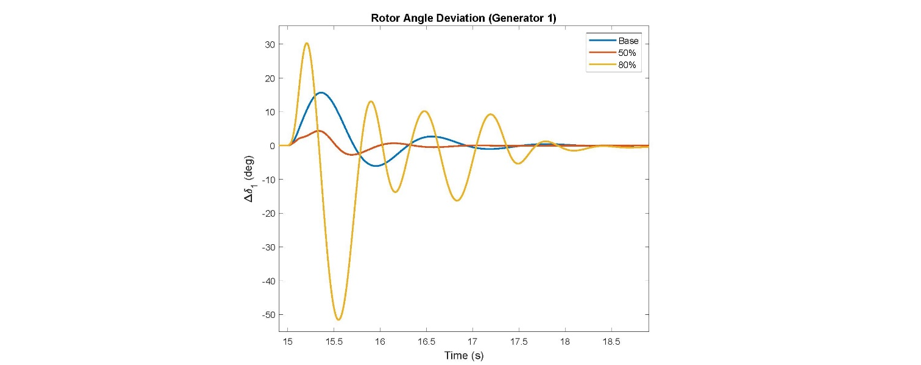
Figure 13 - Time Domain Simulation of Two-Area System, Different NSG Penetration Levels, Large Disturbance

4.5. Validation of Inter-Area Mode Identification, Virtual Synchronous Machine
The studies performed up until this point have analyzed the inter-area mode frequency as the NSG penetration increases for a full rated NSG converter that does not provide inertia to the system. The proposed theory that predicted the behavior of the inter-area mode frequency was validated for both a small and large test system for grid-following converters. In this section, it will be studied if the proposed theory holds for grid-forming converters with inertia. The two-area system was used when the VSM penetration increased from 0-80% and was distributed uniformly. In the first set of scenarios, the capacity factor was set to 1. Meaning, that the rotational energy in the two grid areas remained constant as shown in Table 4. Because the rotational energy remains constant, so does the equivalent inertia. The constant k=8.41 was found based on the known inter-area mode frequency of 0.81 Hz at 0% NSG and the known equivalent inertia. Using the applied theory, because the equivalent inertia is constant as the VSM penetration rises it predicts that the inter-area frequency should remain constant at 0.81 Hz.
| Case (%) | EA (MVA·s) | EB (MVA·s) | Heq (s) | ƒ Modal Analysis (Hz) | ƒ |
|---|---|---|---|---|---|
| 0 | 5400 | 4500 | 2.73 | 0.81 | 0.81 |
| 10 | 5100 | 4500 | 2.73 | 0.81 | 0.81 |
| 20 | 5100 | 4500 | 2.73 | 0.81 | 0.81 |
| 30 | 5100 | 4500 | 2.73 | 0.81 | 0.81 |
| 40 | 5100 | 4500 | 2.73 | 0.83 | 0.81 |
| 50 | 5100 | 4500 | 2.73 | 0.88 | 0.81 |
| 60 | 5100 | 4500 | 2.73 | 0.90 | 0.81 |
| 70 | 5100 | 4500 | 2.73 | 0.87 | 0.81 |
| 80 | 5100 | 4500 | 2.73 | 0.82 | 0.81 |
Performing the modal analysis for the VSM scenarios, the inter-area mode frequency largely followed the theoretical prediction. As seen in Table 4, the inter-area mode frequency remained roughly constant around 0.81 Hz. It can be seen in the results however that when the VSM penetration is around 50-70% the inter-area mode frequency deviates from the predicted results and is significantly higher than the other inter-area mode frequencies. Analyzing further, it was found that the generator voltage control interacted significantly from 50-70%. However, when the VSM penetration at 80% was responsible for the bulk of the generation mix the participation from the generator voltage control decreased notably in the inter-area mode frequency. In the developed theory, it was assumed that the generator voltages were constant and that therefore the classical synchronous generator model could be utilized. Therefore, it makes sense that when the generator voltages begin to significantly contribute within the inter-area mode frequency that the results become less accurate.
| Case (%) | EA (MVA·s) | EB (MVA·s) | Heq (s) | ƒ Modal Analysis (Hz) | ƒ |
|---|---|---|---|---|---|
| 0 | 5400 | 4500 | 2.73 | 0.81 | 0.81 |
| 10 | 5535 | 4725 | 2.83 | 0.79 | 0.80 |
| 20 | 5670 | 4950 | 2.94 | 0.77 | 0.78 |
| 30 | 5805 | 5175 | 3.04 | 0.76 | 0.77 |
| 40 | 5940 | 5400 | 3.14 | 0.77 | 0.76 |
| 50 | 6075 | 5625 | 3.25 | 0.77 | 0.74 |
| 60 | 6210 | 5850 | 3.35 | 0.75 | 0.73 |
| 70 | 6345 | 6075 | 3.45 | 0.70 | 0.72 |
| 80 | 6480 | 6300 | 3.55 | 0.64 | 0.71 |
The second set of scenarios studied was for the two-area system with a capacity factor ratio of 1.5. This means that there will be 1.5 times the amount of rated wind-generation with a VSM converter that is replacing the respective synchronous generation. When the NSG was a full-rated converter this meant that the equivalent inertia decreased significantly as the NSG increased. The VSMs have an inertial constant that is equal to that of the synchronous generator, they are replacing. So therefore, because the capacity factor ratio is set to 1.5, the equivalent inertia will increase as the NSG with VSM increases up to 80% as can be seen in Table 5. The same constant k=8.41 was used to predict the inter-area frequency in the column on the right. The modal analysis can be compared to the results from the theoretical approach. It can be seen, that the proposed theory predicts the inter-area mode frequency quite well.
4.6. Multi-Area Mode Identification, Nordic System
The proposed theory was designed primarily to predict the inter-area frequencies of systems with two distinct grid-areas that are separated by long transmission lines so there is one distinct inter-area mode. In Section 4.2, it was assumed that the reduced Nordic system could be simplified as a two-area system because the North and External areas are separated by the South-West and Central areas by long distance transmission lines. However, in practice such distinct grid areas are not always clear for large systems with complex topologies and multi-area modes can be observed. Multi-area modes are frequency modes where multiple grid areas oscillate against another grid area. The reduced Nordic system with full rated grid-following converters was used to test if the proposed theory could also be applied to multi-area frequency modes. A multi-area mode was observed between the North/External and Central areas. Meaning that according to (24) and (26) Area 1 is the North/External areas and Area 2 is the Central area and the respective equivalent inertia between the two grid areas is calculated. The multi-grid area mode was observed between 0-50% NSG and beyond 50%, the mode is no longer observed. The constant k1=6.78 was calculated based on the base scenario at 0% as seen in Table 6. The constant k2=6.26 was found in the same manner at 40% NSG. Using the calculated constants, the frequency of the multi-grid areas is predicted. The results are shown in Table 6 and Fig. 14 and it can be seen that the frequencies of the multi-area modes is predicted quite accurately from the presented theory.
| Case (%) | Heq (s) | ƒ Modal Analysis (Hz) | ƒ | ƒ (Hz) |
|---|---|---|---|---|
| 0 | 1.25 | 0.97 | 0.97 | 0.89 |
| 10 | 1.12 | 1.00 | 1.02 | 0.94 |
| 20 | 1.00 | 1.04 | 1.08 | 1.00 |
| 30 | 0.87 | 1.09 | 1.16 | 1.07 |
| 40 | 0.75 | 1.15 | 1.25 | 1.15 |
| 50 | 0.63 | 1.21 | 1.37 | 1.26 |
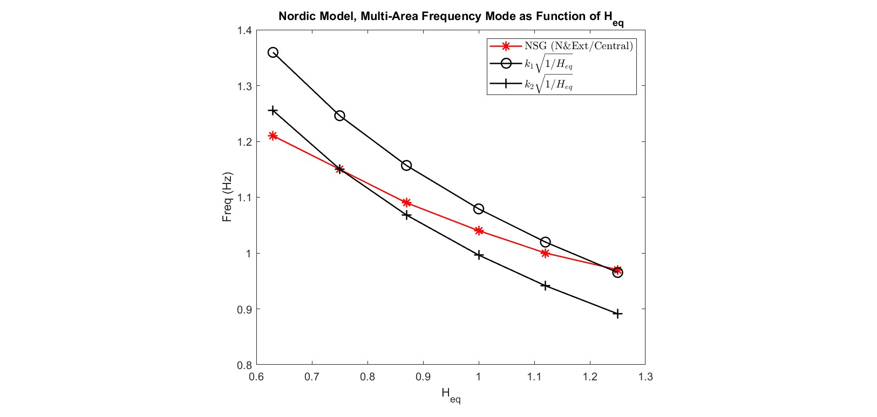
Figure 14 - Comparison of Multi-Area Mode Frequency and Theoretical
5. Conclusion
In this work, a small signal stability analysis of a small and large test system was conducted. It can be concluded that the inter-area mode frequency increases with decreasing inertia, which is in line with the existing expectations. However, the eigen-value results demonstrate that the inter-area mode behavior is highly dependent on the system and that the distribution of inertia mainly determines the frequency, rather than the overall inertia level. The proposed theory for predicting the inter-area mode frequency was validated against the eigenvalue results. A benefit of the proposed formulation is that limited system knowledge is required. Existing knowledge of one inter-area frequency mode and the rotational energy of the participating grid areas yields the fitting constant “k”, which can predict the modes at other penetration levels. It was shown that the derived relationship holds up for predicting the oscillation frequency of grid areas with virtual inertia as well. Additionally, the method was able to predict the multi-area oscillation frequency for a large, realistic test system.
Acknowledgment
This work was funded through SweGRIDS, by the Swedish Energy Agency, Hitachi Energy, Svenska kraftnät and Vattenfall.
References
- IEA, “Renewables 2020,” IEA, Paris, 2020. Accessed on: Nov., 2021. [Online].
- CIGRE/CIRED Joint Working Group, “Modeling of Inverter-Based Generation for Power System Dynamic Studies,” CIGRE/CIRED, May, 2018. Accessed on Jan, 2020. [Online].
- B. Kroposki, B. Johnson, Y. Zhang, V. Gevorgian, P. Denholm, B. Hodge, B.Hannegan, “Achieving a 100% Renewable Grid: Operating Electric Power Systems with Extremely High Levels of Variable Renewable Energy” IEEE Power and Energy Magazine, vol. 15, no. 2, pp. 61-73, March-April 2017.
- L. Bird, D. Lew, M. Milligan, E. Carlini, A. Estanqueiro, D. Flynn, E. Gomez-Lazaro, H. Holttinen, N. Menemenlis, A. Orths, P. Erikensen, J. Smith, L. Soder, P. Sorenson, A. Altiparmakis, Y. Yasuda, J. Miller, “Wind and solar curtailment: a review of international experiences,” Renewable and Sustainable Energy Reviews, vol. 65, pp.577-586, Nov, 2016.
- AEMO, “Black System South Australia 28 September 2016- Final Report,” AEMO, Melbourne, Australia, 2017.
- G. Tsourakis, B. M. Nomikos and C. D. Vournas, “Contribution of Doubly Fed Wind Generators to Oscillation Damping,” IEEE Trans. Energy Convers., vol. 24, no. 3, pp. 783-791, Sept. 2009.
- G. Tsourakis, B. M. Nomikos, and C. D. Vournas, “Effect of wind parks with doubly fed asynchronous generators on small-signal stability,” Electr. Power Syst. Res., vol. 79, pp. 190–200, 2009.
- L. Fan, Z. Miao and D. Osborn, “Impact of doubly fed wind turbine generation on inter-area oscillation damping,” in 2008 IEEE Power and Energy Society General Meeting-Conversion and Delivery of Electrical Energy in the 21st Century, 2008, pp. 1-8.
- Y. Lin, B. Johnson, V. Gevorgian, V. Purba and S. Dhople, “Stability assessment of a system comprising a single machine and inverter with scalable ratings,” in 2017 North American Power Symposium (NAPS), 2017, pp. 1-6.
- S. Eftekharnejad, V. Vittal, G. T. Heydt, B. Keel and J. Loehr, “Small Signal Stability Assessment of Power Systems With Increased Penetration of Photovoltaic Generation: A Case Study,” IEEE Trans. Sustain. Energy, vol. 4, no. 4, pp. 960-967, Oct. 2013.
- J. Quintero, V. Vittal, G. T. Heydt and H. Zhang, “The Impact of Increased Penetration of Converter Control-Based Generators on Power System Modes of Oscillation,” IEEE Trans. Power Syst., vol. 29, no. 5, pp. 2248-2256, Sept. 2014.
- R. Elliott, R. Byrne, A. Ellis and L. Grant, “Impact of increased photovoltaic generation on inter-area oscillations in the Western North American power system,” in 2014 IEEE PES General Meeting, 2014, pp. 1-5.
- D. Gautam, V. Vittal and T. Harbour, “Impact of Increased Penetration of DFIG-Based Wind Turbine Generators on Transient and Small Signal Stability of Power Systems,” IEEE Transactions on Power Systems, vol. 24, no. 3, pp. 1426-1434, Aug. 2009.
- D. J. Vowles, C. Samarasinghe, M. J. Gibbard and G. Ancell, “Effect of wind generation on small-signal stability — A New Zealand Example,” in 2008 IEEE Power and Energy Society General Meeting - Conversion and Delivery of Electrical Energy in the 21st Century, 2008, pp. 1-8.
- E. Hagstrøm, I. Norheim, and K. Uhlen, “Large-scale Wind Power Integration in Norway and Impact on Damping in the Nordic Grid,” Wind Energy, vol. 8, no. 3, pp. 375–384, Jul.–Sep. 2005.
- H. Liu, L. Jin, D. Le and A. A. Chowdhury, “Impact of high penetration of solar photovoltaic generation on power system small signal stability,” in 2010 International Conference on Power System Technology, 2010, pp. 1-7.
- U. Markovic, O. Stanojev, P. Aristidou, E. Vrettos, D. Callaway and G. Hug, “Understanding Small-Signal Stability of Low-Inertia Systems,” IEEE Trans. on Power Syst., vol. 36, no. 5, pp. 3997-4017, Sept. 2021.
- N. Hatziargyriou, J. Milanovic, C. Rahmann, V. Ajjarapu, C. Canizares, I. Erlich, D. Hill, I. Hiskens, I. Kamwa, B. Pal, P. Pourbeik, J. Sanchez-Gasca, A. Stankovic, T. Van Cutsem, V. Vital and C. Vournas, “Definition and Classification of Power System Stability – Revisited Extended,” IEEE Trans. Power Syst., vol. 36, no. 4, pp. 3271-3281, July 2021.
- P. Kundur, Power System Stability and Control. USA: McGrawHill, 1993.
- S. D’Arco and J. Suul, “Equivalence of Virtual Synchronous Machines and Frequency-Droops for Converter-Based MicroGrids,” IEEE Trans. Smart Grids, vol. 5, no. 1, pp. 394-395, Jan. 2014
- Working Group Prime Mover and Energy Supply, “Hydraulic turbine and turbine control models for system dynamic studies,” IEEE Trans. on Power Syst., vol. 7, no. 1, pp. 167-179, Feb. 1992.
- Study Committee, “Long Term Dynamics Phase II CIGRE Task Force,” March, 1995.
- National Grid, “Guidance Notes – Power Park Modules,” Issue 3, United Kingdom, September, 2012.
- A. Clark, P. Mitra, N. Johansson and M. Ghandhari, “Development of a Base Model in RMS and EMT Environment to Study Low Inertia System,” in 2021 IEEE Power Energy Soc. General Meeting, 2021, pp. 1-5.