An online probing frequency injection method for Grid-Forming IBRs inertia measurement
Authors
T. LIN, A.M. GOLE - University of Manitoba
M.K. DAS, G.D. IRWIN, A.L. ISAACS, D.A. WOODFORD - Electranix Corporation

With the high penetration of inverter-based resources (IBRs), mechanical rotational energy stored in the synchronous machines is no longer the dominant contributor to system inertia. As Grid-Forming (GFM) type IBRs mimic the characteristics of synchronous machines, they can offer an apparent inertia, and thereby improve the IBRs system frequency stability. However, measuring the inertia contribution from IBRs can be challenging. This paper proposes a new inertia measurement method for GFM IBRs based on probing frequency injection. Since the injected signal is small, the inertia of a “black boxed” GFM IBR can be conveniently measured during steady-state operation with minimal perturbation. The performance of the proposed method is investigated on a GFM IBR using Electromagnetic transient (EMT) simulation. The paper shows that injecting a probing signal containing two different frequencies can further improve measurement accuracy, when the system has high damping.
Keywords
Inverter-based Resources (IBRs), Grid-Forming (GFM), inertia measurement, Electromagnetic transient (EMT) simulation1. Introduction
System inertia refers to the property of a power system that opposes changes in the rate of change of its rotational kinetic energy caused by a mismatch between the generation and consumption of active power.
Inertia in a synchronous machine is related to the kinetic energy stored in the rotating mass. This stored energy can be used to help maintain the stability and frequency of the power system in the event of disturbances such as sudden changes in power generation or consumption. The higher the synchronous machine inertia, the more energy is stored in the rotating masses and the better the system can resist changes in power generation or consumption. In [1], the inertia constant H is defined by
(1)
In some cases, the mechanical structure and the kinetic energy stored in a synchronous machine are not always known. However, the inertia constant H of a synchronous machine can also be measured from the system dynamics. The conventional method of inertia measurement in traditional networks is to apply a step change in power generation or consumption to create a frequency disturbance and observe the rate change of frequency (ROCOF). During generation and load power imbalance, the power mismatch observed during the inertial response stage is primarily due to deviations in electrical power. This occurs because the response time of the generator’s governor is much longer compared to the inertial response. As a result, the mechanical power tends to remain stable or undergo minimal changes during the inertial process. According to the swing equation, the system electrical power change ∆Pe in per-unit follows
(2)
Here, d∆ω/dt is the system Rate of Change of Frequency (ROCOF) in pu/s. The inertia constant H can be calculated by
(3)
Usually, in a synchronous machine, the damping coefficient D is small and D∆ω≈0, so the synchronous machine inertia constant H can be estimated by
(4)
This large disturbance based-inertia measurement has been reported in [2][3]. However, the precise ROCOF estimation requires signal processing methods [4][5] to eliminate the noise from the onsite frequency measurement. Furthermore, the accuracy of the estimation can be influenced by the primary response (i.e., governor response or power-frequency droop response) occurring after the initial inertial response. To mitigate this, in [6], a sliding window of 500 ms is used to sample measurements within a 1-second time interval following the disturbance to avoid the effects of the primary response and improves the reliability of ROCOF estimation.
Modern power systems increasingly include inverter-based resources (IBRs) such as wind and solar photovoltaic (PV) farms, battery energy storage systems (BESS) and HVdc converters. In some power systems, the highest hourly penetration of renewable inverter-based resources (IBRs) can be as high as 95-100%. These IBRs can improve frequency stability by providing artificial inertia. Of course, the energy required for this purpose is not drawn from a rotating mass as with a synchronous machine. Instead, it is obtained from battery energy storage or a remote sending end as is the case with an HVdc transmission system. Accurately measuring the inertia of Inverter-Based Resources (IBRs) using Rate of Change of Frequency (ROCOF) can be challenging due to the rapid transients and the activation of power-frequency droop control in IBRs.
Another approach of inertia measurement uses a probe signal and gets response data from normal operating conditions and can be categorized as ambient data based inertia estimation [7][8][9]. However, these methods generally require long observation periods and well-designed probing signals. In a power electronics converter-dominated power system, the traditional mechanical rotational inertia of generators may not be the sole source of system inertia. Grid-Forming (GFM) controlled Inverter-Based Resources (IBRs)[10][11][12] have been proposed to imitate the characteristics of synchronous machines and provide an equivalent level of inertia similar to synchronous machines. Different GFM control strategies have been proposed such as Droop-Based GFM, Virtual synchronous machine (VSM) etc. The inertia constant in such cases cannot be easily determined. Furthermore, manufacturers sometimes “black box” the simulation models of their GFMs making it even more difficult to determine equivalent inertia. Thus, online measurement or simulation-based estimation of the equivalent inertia is of great interest today. Moreover, the inertia of a synchronous machine is an intrinsic physical property determined by its rotating mass and cannot be changed once the machine is connected to the power system. In contrast, the GFM IBR has the ability of dynamically adjusting its virtual inertia during operation. Therefore, an inertia estimation method that can accurately measure and track the inertia change is required for the IBR systems.
In this paper, a novel measurement method is introduced for Grid-Forming Mode (GFM) Inverter-Based Resources (IBRs) using probing frequency signal injection. The method involves injecting a simple small voltage or current probing signal at the Point of Common Coupling (PCC) bus, which is distinct from the system frequency. By analyzing the measured frequency content on the active power and the virtual synchronous speed, the inertia of the GFM IBRs can be estimated. Since the injected signal is small, the inertia of the GFM IBR can be conveniently measured during steady-state operation. It will be shown that the inertia estimation is achieved with an on-line Discrete Fourier Transform measurement and does not require long measurement times as would be required for the more conventional ROCOF observation method. Also, ROCOF measurement requires a load or generation change to initiate the change in frequency, which is avoided with the proposed approach. The proposed method is first tested to measure synchronous machine inertia. Then, it is further used on a virtual synchronous machine (VSM) typed GFM IBR. The details of the method will be shown in the following sections below.
2. Proposed Probing Frequency Injection Inertia Measurement
In a synchronous machine, the transfer function between electrical power deviation ∆P(s) and speed variation ∆Ω(s) is
(5)
In the frequency domain, can be rewritten as
(6)
Here, is the frequency deviation from the fundamental frequency
. The damping coefficient D for a synchronous machine is usually very small and so
. Thus, can be used to estimate the inertia constant H. A small probing voltage signal Vh or current signal Ih at frequency
is injected at the terminal of the synchronous machine as shown in Fig. 1. This results in the power deviation
and a speed deviation
at frequency
and is then used to estimate the inertia constant H by
(7)
Since the purpose of the probing frequency injection is to get the power and system at a frequency , either current or voltage injection can fulfil this task.
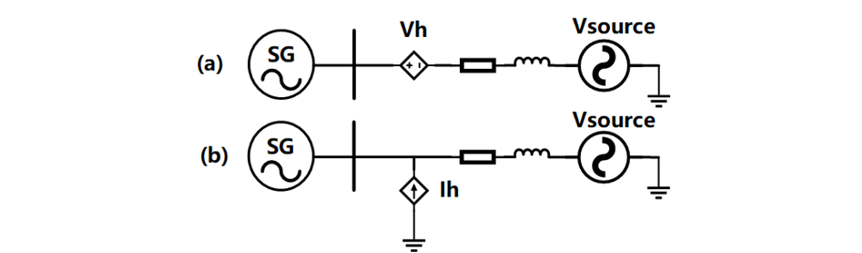
Figure 1 - Probing frequency injection (a) Voltage injection (b) Current injection
3. Synchronous Machine inertia Measurement by Proposed Method
To test this probing frequency injection method, a 100MVA synchronous machine with inertia constant H=3s connecting to a 10kV voltage source at a nominal frequency of is simulated in PSCAD/EMTDC. A small probing voltage signal tuned at fh=10Hz and 10% of the voltage source magnitude is injected as shown in Fig. 1(a). Fig. 2 shows the measured synchronous machine active power output P and rotating speed
. After performing a Discrete Fourier Transform (DFT) on the measured power and frequency signals, frequency content of f0 - fh = 50Hz is observed, with
and
as shown in Fig. 3. According to equation , the inertia constant H can be calculated by
(8)
This measurement completely agrees with the inertia H of 3s of the machine, thereby validating the approach. A small current probing signal injection shown in Fig. 1(b) also gives the same inertia constant of 3 s (not shown).
Compared with large disturbance based-inertia measurement using RoCoF, the advantage of using this probing frequency injection method to measure inertia is that no load or generation change is required to check system RoCoF. The system inertia can be measured online at steady-state operation. Moreover, this probing frequency injection-based method of inertia measurement does not necessitate a lengthy observation time window or complex computations that are typically required by the existing ambient data-based methods.
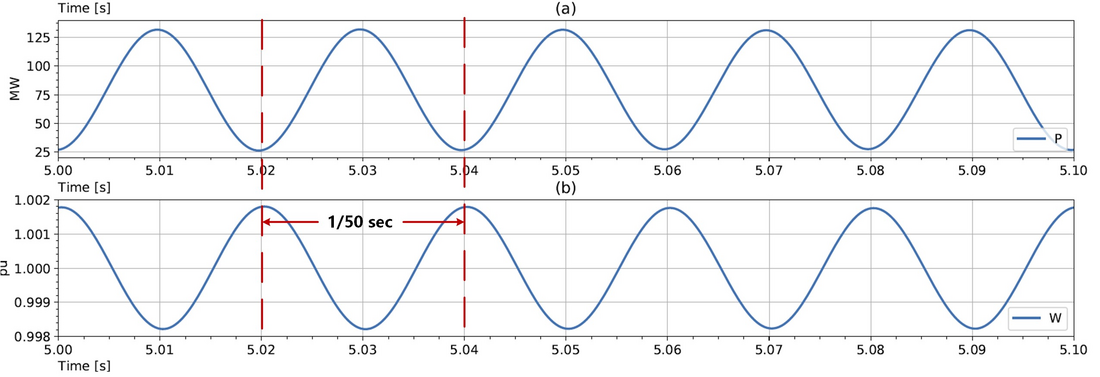
Figure 2 - Measured (a) the synchronous machine active power output (b) synchronous machine rotating speed
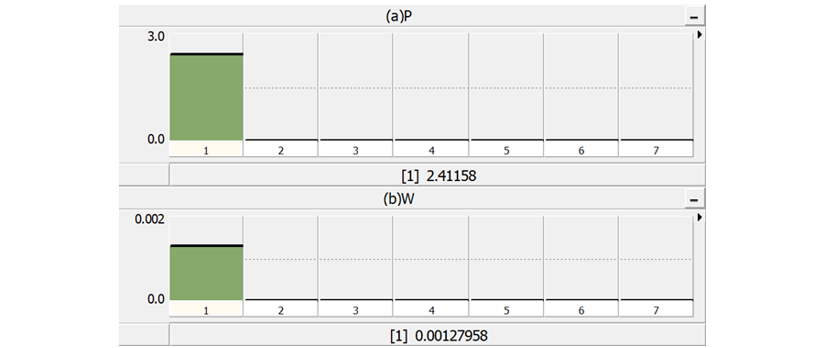
Figure 3 - DFT on (a) active power output of synchronous machine (b) synchronous machine rotating speed, the fundamental frequency at 50 Hz
4. Inertia Measurement of GFM Inverter-based Resources
In this section, the proposed probing frequency injection method is further used to measure the inertia from a GFM type IBR. There are different types of GFM control approaches as reviewed in [10][12][13]. The example in this paper will focus on the VSM type GFM IBR, although the method has the capability to measure the inertia from other control types of GFM IBRs.
4.1. VSM control
The control structure of a VSM is shown in Fig. 4. The power synchronization loop above the dotted line emulates the swing equation of a synchronous machine. H is the virtual inertia constant, and D is the damping coefficient. Like a synchronous machine, the power synchronization control of a VSM uses the swing equation to generate the ac voltage synchronization angle θ at the Point of Common Coupling (PCC).
An ac voltage control loop is included for regulating ac voltage. The VSM’s voltage is to be synchronized with the d component of ac voltage, so the q-axis voltage reference Vqref of the ac voltage control loop is set to zero, while the d-axis voltage reference Vdref is selected to be the reference voltage Vref for the grid. To limit overcurrent, an inner decoupled current control loop is present. The voltage control loop generates the necessary d and q axis current references Idref and Iqref . Overcurrent is limited by adding limits to Idref and Iqref . The inner current control loops generate the voltage magnitude reference vcd and vcq for modulation.
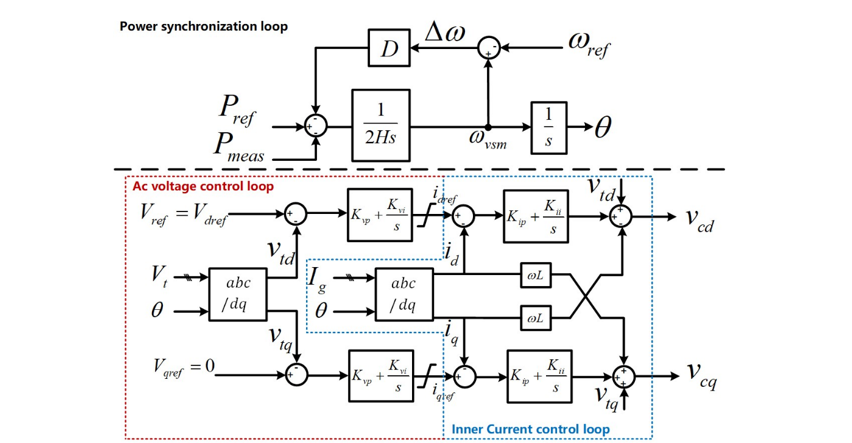
Figure 4 - VSM control structure
It is important to note that the selection of inertia constant and damping coefficient of a Virtual Synchronous Machine (VSM) is not limited to the physical ranges applicable to a real machine. The inertia response of a Grid-Forming Mode (GFM) can be adjusted dynamically. However, caution should be exercised to avoid setting an excessively large inertia constant for a GFM IBR, as it may compromise its stability and dynamic performance. Furthermore, the damping coefficient D for a VSM is often selected to be larger than that of a synchronous machine [1] to give improved stability [14]. For VSM inertia estimation, the impact of large D should be considered in equation . This phenomenon will be explained in the following subsection.
4.2. VSM inertia measurement using proposed probing frequency injection method
A test system shown in Fig. 5 is developed on the PSCAD/EMTDC platform to demonstrate the inertia measurement of a VSM. In the test system, a symmetrical monopole MMC-HVdc system is modelled with the specifications shown in TABLE I. The rectifier side of the MMC-HVdc link is connected to a strong ac grid and operated in dc voltage control mode so that the dc link voltage can be assumed to be constant. The inverter side of the MMC-HVdc is connected to a weak ac grid and operated in VSM control shown in Fig. 4 to regulate the active power. The ac grid is represented by a Thevenin equivalent voltage source behind resistor Rs and inductor Xs. Any desired ac system strength, i.e., short circuit ratio (SCR) can be represented by selecting appropriate values for Rs and Xs. For this test case, the SCR of the ac grid at the inverter side is 1 and the impedance angle is arctan (Xs/Rs) = 80o. The VSM’s virtual inertia constant H is set at 0.5 s. A probing current signal Ih with a magnitude equal to 5% of rated current is injected at the PCC as shown in Fig. 5.
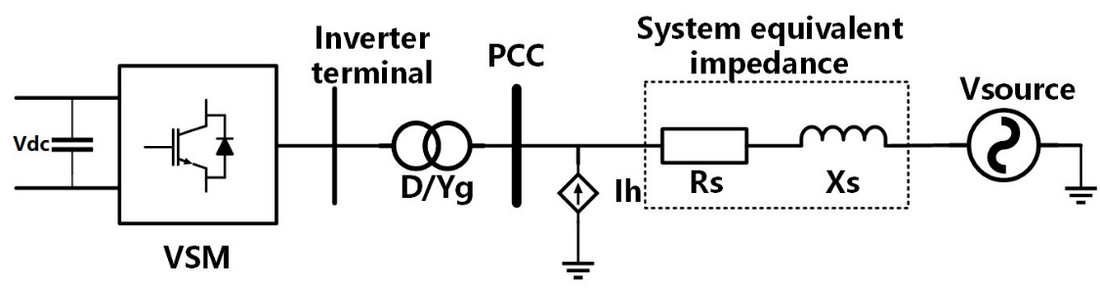
Figure 5 - VSM inertia test case using probing frequency injection method
MMC-HVDC pole configuration | symmetrical monopole |
DC link voltage | +/- 120 kV |
Rated power | 200 MVA |
Submodule number in each arm | 200 |
Converter transformer winding voltage | 116.7kV/230 kV |
Converter transformer reactance | 0.18 pu |
Arm inductor | 0.055 pu |
Transformer windings configuration | Yg (ac side)/Delta (inverter side) |
Rated ac system voltage | 230 kV, 60Hz |
As the damping coefficient D for a VSM is significantly larger than that of a synchronous machine, the impact of D on the result should be considered for inertia estimation. Fig. 6 shows the theoretical calculation result of with nominal frequency f0, injection probing current frequency fh ranging from 1 Hz to 50 Hz, giving a value of
ranging from 59 Hz to 10 Hz. As can be seen, when D=1, which is close to that of a real synchronous machine,
at any
range in the figure. However, when D is large such as D=20 or 50, which can be the case for VSM, the larger the D, the larger error between H and the value of
.
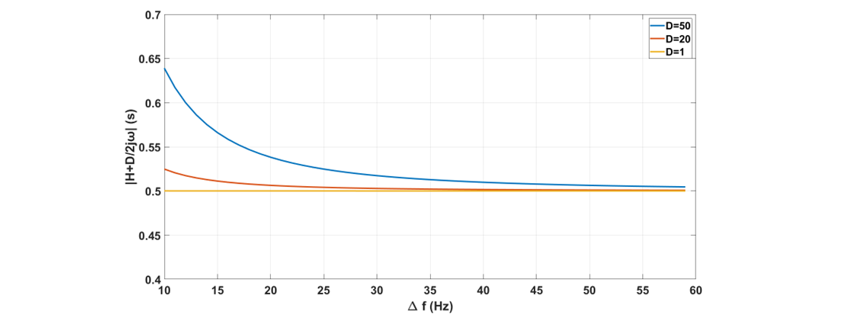
Figure 6 - Theoretical calculation of |H+D/2jω| for VSM
The impact of D on the VSM inertia estimation is further investigated by EMT simulation. Fig. 7 shows the EMT simulation results for the case of D=20 and D=50. Overlaid on the measurement is the theoretical expectations from Fig. 6, and the two match up well. In the simulation, the VSM inertia is measured at = 10, 20, 30, 40, 50 and 59 Hz. From the graphs its is noticed that if the injected frequency fh can be kept small, e.g., fh < 10 Hz, (i.e.,
> 50 Hz),
can be kept small, the measured virtual inertia constant is much closer to the actual virtual inertia constant of H=0.5 s.
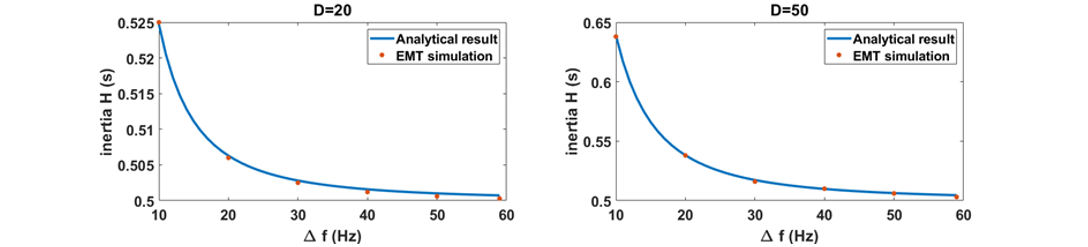
Figure 7 - Comparisons of the inertia measurement by EMT simulation and theoretically calculated |H+D/2jω|
Another way to avoid the error caused by large D on VSM inertia measurement is to inject a second probing frequency on the same VSM at another different . If the inertia measurement is Hm1 with
, and the inertia measurement is Hm2 with
. Then the actual VSM inertia H can be calculated by
(9)
Thus, the error of large damping coefficient D on VSM inertia measurement is eliminated. Consider the case with D=50 in Fig. 7, ,
,
,
, then according to equation the actual VSM inertia H is
(10)
which is the same as the actual virtual inertia set in the controls.
4.3. Dynamically tracking the virtual inertia of VSM
As mentioned earlier in the introduction section, VSM parameters do not have the physical constraints of a real synchronous machine. This can offer extra control flexibility, including the possibility of adaptively changing the virtual inertia during operation. It is interesting to check whether the proposed probing frequency injection-based inertia measurement can be used to track the change in apparent inertia.
For the above test system in Fig. 5, in this simulation, the virtual inertia constant of the VSM is initially set to 2 s, then changes to 3 s at 6 s. The probing frequency injection inertia measurement starts at 4.5 s. Fig. 8 shows the measured inertia for VSM, the measurement tracks VSM’s inertia well. When the virtual inertia changes, there is about a 0.5 s settling time for the final reading to stabilize.
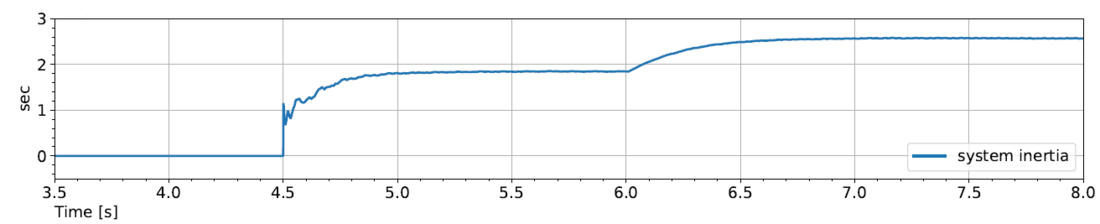
Figure 8 - Tracking the virtual inertia change of a VS
At present, the method has been only applied in simulation. Even, in this form, it is of significant value as it provides a means to assess the equivalent inertia at the planning and operation stages. Applying it in an actual system will require voltage or current injection source of suitable rating.
5. Conclusions
This paper proposes a new inertia measurement method for synchronous machines and GFM IBRs based on probing frequency injection. This is particularly useful if the mechanical structure and the kinetic energy stored in a synchronous machine are not known, or the GFM IBR control system is “black boxed”, so that theoretical calculation of inertia is not possible.
The proposed method is first validated on a single synchronous machine and then on a VSM. It shows accurate measurement results for the synchronous machine case. However, for VSMs, which can have large virtual damping coefficients, the measurement can have errors. Nevertheless, this error can be made negligibly small if the frequency of the injected component is kept small (10Hz or less). Alternatively, it can be eliminated by two injected signals at different probing frequencies. Finally, the proposed method is applied to a VSM with dynamically changing virtual inertia. The simulation result validates that the probing frequency injection inertia measurement method can accurately track and capture the dynamic changes in VSM inertia. At present, the technique has been applied only in simulation, where it is also useful. In the future, injection mechanisms for use in real systems can be investigated.
6. References
- Kundur P. Power system stability and control [M]. New York: McGraw-hill, 1994.
- D. Zografos, M. Ghandhari, “Power system inertia estimation by approaching load power change after a disturbance,” in 2017 IEEE Power & Energy Society General Meeting, Chicago, IL, USA, 2017, pp. 1-5.
- J. Zhao, Y. Tang and V. Terzija, "Robust Online Estimation of Power System Center of Inertia Frequency," in IEEE Transactions on Power Systems, vol. 34, no. 1, pp. 821-825, Jan. 2019.
- T. Inoue, H. Taniguchi, Y. Ikeguchi, et al., “Estimation of power system inertia constant and capacity of spinning-reserve support generators using measured frequency transients,” IEEE Trans. Power Syst., vol. 12, no. 1, pp. 136-143, Feb. 1997.
- A. Riepnieks and H. Kirkham, “Rate of change of frequency measurement,” in 2016 57th International Scientific Conference on Power and Electrical Engineering of Riga Technical University (RTUCON), Riga, Latvia, 2016, pp. 1-5.
- P. M. Ashton, G. A. Taylor, A. M. Carter, et al., “Application of phasor measurement units to estimate power system inertial frequency response,” in 2013 IEEE Power & Energy Society General Meeting, Vancouver, BC, Canada, 2013, pp. 1-5.
- B. Tan, J. Zhao, M. Netto, V. Krishnan, V. Terzija, and Y. Zhang, “Power system inertia estimation: Review of methods and the impacts of converter-interfaced generations,” Int. J. Electr. Power Energy Syst., vol. 134, 2022.
- F. Zeng, J. Zhang, G. Chen, Z. Wu, S. Huang, and Y. Liang, “Online estimation of power system inertia constant under normal operating conditions,” IEEE Access, vol. 8, pp. 101 426–101 436, 2020.
- S.C. Dimoulias, E. Kontis, and G. K. Papagiannis, “On-Line Tracking of Inertia Constants Using Ambient Measurements.” IPST 2023, 065-03591.
- Energy Systems Integration Group (ESIG) report, “Grid-Forming Technology in Energy Systems Integration,” ESIG, 2022
- NERC Inverter-Based Resource Performance Working Group (IRPWG) report, “Grid Forming Technology: Bulk Power System Reliability Consideration”. NERC, Dec. 2021.
- Lin Yashen, Joseph H. Eto, Brian B. Johnson, Jack D. Flicker, Robert H. Lasseter, Hugo N. Villegas Pico, Gab-Su Seo, Brian J. Pierre, and Abraham Ellis. 2020. “Research Roadmap on Grid-Forming Inverters,” Golden, CO: National Renewable nergy aboratory. REL/TP-5D00-73476.
- Unruh, P., Nuschke, M., Strauß, P., Welck, F, “Overview on Grid-Forming Inverter Control Methods,” Energies 2020, 13, 2589.
- T. Lin, M. Das, A. Gole, A. Isaacs. “Adaptive fault ride through control of VSM Grid-Forming Converters”, Electric Power Systems Research, Volume 223, 2023,109606, ISSN 0378-7796.
Biographies
Ting Lin received a B.Sc. degree from the Harbin Engineering University in 2013 and his M.Sc. degree from the Technical University of Denmark in 2015, both in electrical engineering. In 2017, He started pursuing his Ph.D. degree in Electrical engineering at the University of Manitoba. From 2021 to 2023, He was awarded a Mitacs Accelerate Fellowship in collaboration with Electranix Corporation, Winnipeg. His research investigated disturbance ride through capability, small signal stability analysis and equivalent Inertia measurement of Grid Forming (GFM) inverter-based resources. He received a PhD degree from the University of Manitoba in early 2024.
Aniruddha M. Gole received the B.Tech. degree in electrical engineering from the Indian Institute of Technology, Bombay, Mumbai, India, in 1978, and the Ph.D. degree from the University of Manitoba, Winnipeg, MB, Canada, in 1982. He has had a longtime involvement with developing EMT simulation tools for power systems with embedded power electronics and was an early collaborator of Dennis Woodford on the simulation program now called PSCAD. He is currently a University Distinguished Professor at the University of Manitoba. He is a Registered Professional Engineer in the Province of Manitoba. In 2007, he was the recipient of the IEEE Power Engineering Society Nari Hingorani FACTS Award. He is a Fellow of the Canadian Academy of Engineering and of the IEEE.
Mukesh D. Das received a Master’s degree from the IIT, Roorkee, India, in 2010 and a Ph.D. degree from the IIT, Bombay, India, in 2016. He worked as PostDoctoral Fellow at the University of Manitoba. During his Ph.D. and PostDoc, he did extensive research on Frequency Scanning Technique and its use to analyze power electronic systems and grid adverse interactions, such as SSCI (Sub-Synchronous Controller Interaction). He joined Electranix in 2020 and has been involved in different SSCI studies.
Garth D. Irwin joined the Manitoba HVDC Research Centre after graduating from the University of Manitoba, Canada in 1987. At the Centre, he undertook studies and projects including insulation coordination of HVDC transmission substations, subsynchronous resonance, and digital controls development. As leader of the PSCAD/EMTDC development team, he was responsible for the improvements to the EMTDC solution algorithm and the precision modelling of transmission lines and cables. He serves as one of the founding members of Electranix and presently holds the position of president.
Andrew L. Isaacs has been with Electranix since 2003. He currently specializes in renewable interconnections, weak grid and SSR/SSCI issues, as well as large scale EMT system modelling. Additional current efforts include specification and support for FACTs, training for utility planners, study team leadership, and expert witness support. Andrew obtained his M.Sc.(EE) from the University of Manitoba, Canada. He has been an active participant in NERC working groups, Cigre, and the IEEE.
Dennis A. Woodford joined the English Electric Company in 1966 and worked on variable speed drives and HVDC transmission in the UK until 1970. He completed a BE (Hons) from the University of Melbourne in Australia in 1966 and an M.Sc.(E.E.) at the University of Manitoba, Canada and joined Manitoba Hydro in 1972. There he worked in transmission planning of ac and dc EHV transmission and wrote the EMTDC algorithm. In 1986 he was appointed Executive Director of the fledgling Manitoba HVDC Research Centre. He started Electranix with Garth Irwin in 2001, and served as an adjunct professor at the University of Manitoba. Dennis received the Uno Lamm HVDC award by the IEEE Power and Energy Society. He is a Life Fellow of the IEEE and an international member of the National Academy of Engineering.