Understanding and mitigating the effects of climate change on overhead transmission lines: recent developments in Italy
Authors
M. DE NIGRIS, A. ABBATE, R. BONANNO, E. COLLINO, P. FAGGIAN, S. SPERATI, F. VITERBO - RSE SpA, Italy

Summary
The paper addresses the research ongoing in Italy in the field of resilience of power lines to characterize the threats, as well as to study components and systems vulnerabilities, to manage critical situations by allowing adequate reaction time for operations and maintenance or identifying potential mitigation measures to limit the impact of climate change. Special attention is devoted to the major threats affecting the overhead line performances related to extreme weather conditions: wet snow, extreme winds, heavy precipitations, and floods. The first step in the procedure is the characterization and quantification of the current threats, based on extended meteorological reanalysis: a specific dataset named MEteorological Reanalysis Italian DAtaset (MERIDA) has been developed and configured to describe the typical weather conditions of Italy in the present climate. Projections into future scenarios are inferred at the light of climate modelling, considering different greenhouse gases emissions scenarios to evaluate extreme events expected by the end of the Century. The estimation of the climate evolution in the next decades is carried out by computing a multi-model ensemble based on a set of climate models developed in the framework of EU Euro-CORDEX Project, after verifying the performances of each model against MERIDA results in describing the climate in the last decades. Addressing, respectively, the timescales of meteorology and climate, the procedures enable the computation of the statistical return time of specific critical events, essential in the evaluation of resilience of power lines at short and long term. The vulnerability of different configurations of power lines and their components (e.g., type of conductors, ground wires, insulators, etc.) is evaluated both under laboratory conditions and in service conditions, through in-service monitoring systems specifically developed for the purpose. Each of the evaluation steps are used to feed a resilience approach tool which implements the risk-based resilience assessment and enhancement analysis.
Keywords
Resilience, Wet-snow, Extreme-wind, Heavy-rainfall, Climate-change1. Introduction
Overhead transmission lines are the backbone of the electricity system in most countries around the world. Cheaper and often less impactful than underground cables, they are, however, exposed to outdoors environmental conditions that may impact their performances or even threaten their structural integrity. Weather events are getting more and more extreme in intensity, frequency, and duration and are expected to exacerbate in the future, because of the climate change. Italy, in the middle of the transition zone between the arid climate of North Africa and the temperate and rainy climate of Europe, is in a position susceptible to weather instabilities that can deeply affect its energy system. Weather-related events have struck the Italian transmission network in recent years: heavy wet snowfalls have caused short circuits and structural failures; strong winds have torn apart towers and uprooted trees; heavy rain, floods and landslides have led to collapse line foundations. Transmission system operators (TSOs) are strongly motivated by the national regulators to evaluate the impact of multiple dependent outages of components and to deploy preventive or corrective countermeasures aimed at absorbing the effects of such disruptive events and quick recovery, i.e., to increase system resilience, implementing adequate measures to limit the extent, severity, and duration of system degradation as a consequence of an extreme event. Such management has been carried on through a set of key actionable measures to be taken before, during and after extreme events (i.e., anticipation, preparation, absorption, adaptation, rapid recovery and sustainment of critical system operation). A resilience analysis of the power system deepens the connections between threats (e.g., extreme weather events), component vulnerabilities (i.e., their susceptibility to the threats), and power system contingencies (i.e., the failures) potentially leading to extended service degradation and blackouts. An explanatory picture to describe the approach to resilience developed and adopted by the Italian TSO with the approval of the national regulation authority is the “bow tie” model represented in Figure 1 [1]: on the left side threats are listed considering natural and man-related events; faults are shown next with barriers able to reduce their number and extent (i.e screens and protections); contingencies represent the impact of multiple, combined and related faults generating system transients and unbalances, potentially leading to cascading faults and final blackouts or degraded quality of service. The method is based on advanced probabilistic approach to risk. It can be used to address short term operational decisions as well as long term planning and network reinforcement measures.
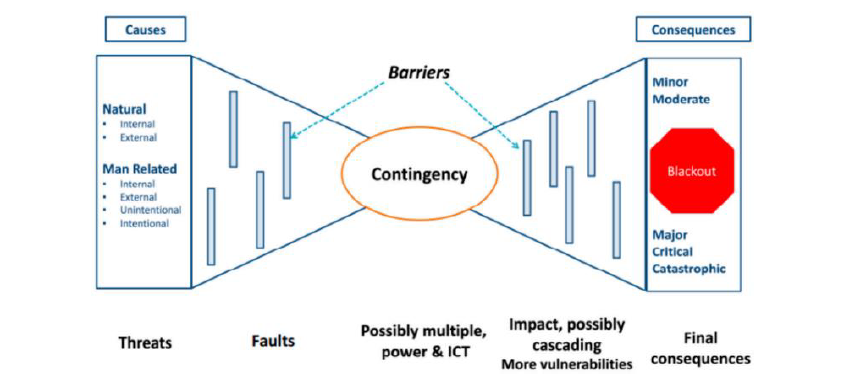
Figure 1 - The bow tie model used to represent the relationship between threats to the transmission system and the potential consequences to the quality of energy supply to final users (Source [1])
The present paper focuses on the left part of the bow tie model and deepens more specifically threats and some of the barriers to faults. The information gathered from the analysis of threats conducted in this paper are used to formulate, validate, adapt, and use the models to derive single and multiple contingencies of power systems in general and more specifically on their overhead lines.
2. Impact of extreme events on overhead lines
Italy is widely affected by weather-related threats: the report of the Italian Institute for Environmental Protection and Research (ISPRA) [2] states 1.3 million people (about 2.2% of the total Italian population) is exposed to landslide risk and 6.8 million exposed to flood risk (about 11.3% of the total Italian population). Data from TERNA, the Italian TSO, confirms this dramatic trend. Recent widespread electrical system disruptions linked with extreme events are depicted in Figure 2. In terms of permanent impact to the infrastructure, nearly 58% of the total damages recorded during landslides and flood events affected supports and 17% the conductors.
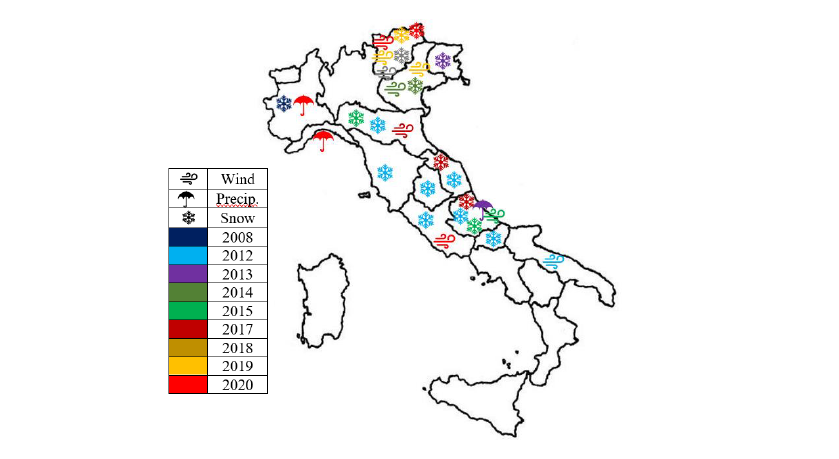
Figure 2 - Recent large disruptions in the transmission system linked with extreme events of snow, wind and extreme precipitations. Different colors are used for the different years – RSE elaboration from TERNA [3]
3. Methods used in the evaluation of threats
The first step for the application of the “bow tie” method shown in Figure 1, requires to compute the severity, the extent and duration of the threats on the grid infrastructure, in terms of associated probability distributions; this requires the analysis of the influencing factors considering their spatial and temporal historical evolution to adequately model extreme meteorological phenomena over geographically spread infrastructures.
To analyse and evaluate the trends of several environmental hazards on wide and heterogeneous territories, atmospheric scientists have developed global gridded dataset, called reanalyses. They consist of physically based reconstructions of the past, obtained through numerical weather models, combining past observations. These datasets supply 3D fields of sub-daily atmospheric and land variables over an historical recent period of more than 30 years. The most used global reanalysis, developed by the European Centre for Medium-range Weather Forecasts (ECMWF) [4] is the ERA5 [5] dataset. It covers the globe with a spatial resolution of 30 km and an hourly temporal resolution, with 137 vertical levels from the surface up to a height of 80 km. Several threats, however, have the characteristic of being very localized in space and time, therefore the resolution of global reanalyses could be not enough to well describe local phenomena, especially in very complex orographic terrains.
For reproducing and understanding the past and present threats over Italy, an atmospheric reanalyses dataset, called MERIDA [6], has been developed. MERIDA consists of a dynamical downscaling of the ECMWF global reanalysis ERA5, using the Weather Research and Forecasting (WRF) model, which is configured to describe the typical weather conditions of Italy. The computational domain is defined using two grids with a spatial resolution of 21 km and 7 km respectively, with the internal grid centred over Italy as shown in Figure 3. The dataset has hourly temporal resolution and spans over 30 years, with 22 different meteorological variables computed at 40 different altitude levels and comprises 1.5*1012 records.
To support TSO in their resilience planning, climate future projections are required. They are inferred from climate models used to simulate past and future climate conditions, in different greenhouse emission pathways, the so-called Representative Concentration Pathways, to consider a range of possible climate scenarios depending on different socio-economic development assumptions. For Italy, long term climate-related projections, are carried out using an ensemble of 12 high-resolution (~12 km) Euro-CORDEX region models [7], adequately selected and validated [8]. In order to evaluate extreme events that can impact overhead transmission lines, future climate scenarios have been elaborated by considering model simulations realized under two configurations, the so-called Representative Concentration Pathway RCP8.5 and RCP4.5, describing a future emission pathways without and with moderate reductions of GHG emission, respectively [9].
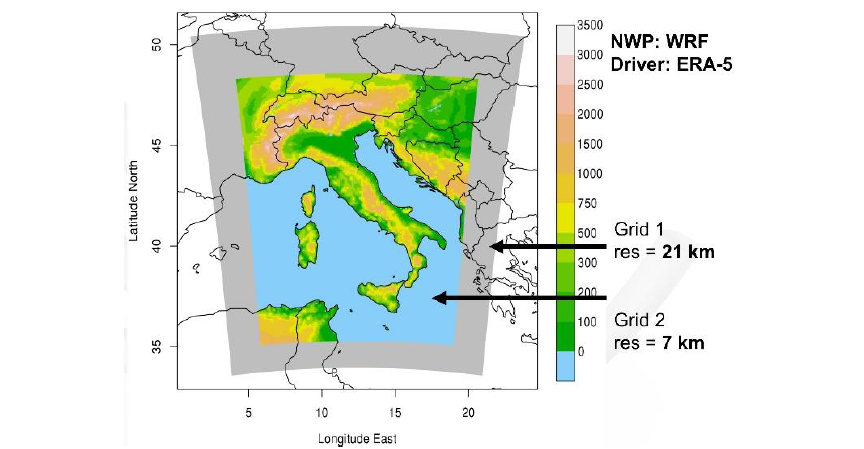
Figure 3 - Computational domain of WRF model over Italy. Driver model: ERA5
4. Wet snowfalls
Wet snowfalls in Italy are still one of the main causes of power failures for both transmission and distribution energy networks. Wet-snow precipitation generally occurs when the surface air temperature is close to freezing point. There is not an exact temperature range for wet-snow conditions, but the most well-known interval, verified by many observations in different countries, is within the range -1°C - 1.5°C. In this temperature range, the snowflakes can partially melt, and their typical Liquid Water Content (LWC) is within the range of 15%-40% of the total mass. Under these conditions, the snowflakes settle on the conductor and join together not only by the mechanism of collision, but also for the strong coalescence due to the presence of LWC in the snowflakes that promotes the growth of sleeve typically cylindrical in shape around the conductor, as shown in Figure 4a.
The typical duration of wet-snow events is 18-24 hours, producing snow sleeves till 15 cm in diameter and causing an extra load on conductors up to 8-10 kg/m. The snow accumulation can generate mechanical loads exceeding the tensile strength of the conductors and causing their mechanical strain, the combined effect with wind can worsen the situation involving and bending the lattice towers and/or jeopardising the dielectric distances between the conductors and ground. Moreover, an abrupt detachment of the sleeve can cause the violent rebound and kinking of conductors and ground wire, thus causing a permanent tripping of the line.
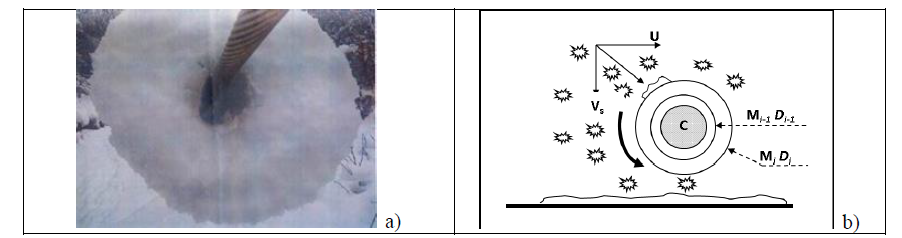
Figure 4 - Example of snow-sleeve on a HV conductor caused by wet snowfalls and schematic representation of the accretion process
The resilience plans of electrical operators must consider this extreme weather threat and find solutions to mitigate its effect through either the strengthening of the networks or by active/passive solutions. In this context, the resilience evaluation framework requires an estimation of the probability distribution of the mechanical load associated to wet snow sleeves. This estimate is linked with the availability of a solid set of historical data, such as that of MERIDA, and a proven physical model to estimate the additional weights generated over the conductors by the snow sleeves. The Makkonen model ISO12494:2017 [10] is used to compute the snow sleeve evolution (diameter/hour) as a function of wind intensity, vertical velocity of snowflakes, water equivalent of the snowfall intensity. The importance of the historical data requires continuous validity checks, for example by means of the reconstruction of the dynamics of significant past events to be interpreted at the light of measured quantities and observations.
An example of the reconstruction of the snow sleeve mass with MERIDA and Makkonen model is shown in Figure 5 for the extreme wet snowfall of 16-18 January 2017 occurred in Abruzzo region, causing serious problems for the safety and operation of the Italian electrical system. During the event, the Italian TSO reported the formation of a snow sleeve with a mass close to 15 kg/m in the areas where overhead lines design criteria at most did not exceed 5 kg/m. The snow sleeve model reconstructed the event through the hourly data coming from MERIDA. The reanalysis reconstruction of this event is reported in Figure 5 and shows a good reconstruction of the wet snow event with a good matching between the blackout areas (highlighted by the black crosses) and those with relevant snow sleeve load formation.
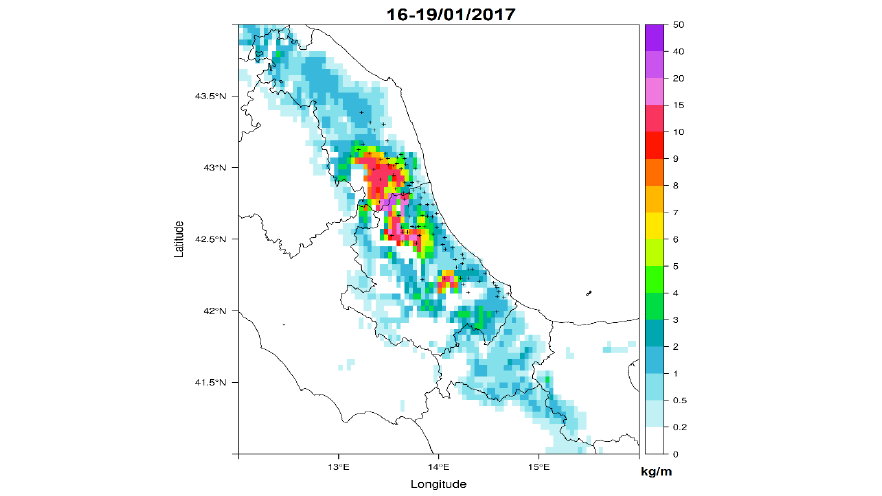
Figure 5 - Reanalysis reconstruction of sleeve mass (kg/m) on ACSR585mm2 conductor for the exceptional wet snowfall occurred in January 2017. The + symbols indicate the location of prolonged blackouts
Future climatic projections about the occurrences of wet-snow events and the related sleeve loads on overhead power lines have been elaborated until year 2100 with focus on Italy. MERIDA was used to implement CLIWAC model [11], a modified version of Makkonen model to handle daily model data to investigate future climate wet snow conditions. MERIDA was also used to elaborate historical scenario, as well as to bias-correct model temperatures before computing the ensemble mean wet snow scenarios, consisting in reference scenario (REF) and future projections. The 95th percentile values of the wet-snow loads inferred from the multi-model related to the period 2001-2020 are shown in Figure 6, where wet snow loads over the entire territory are represented on a yearly base (left) and further for the winter (DJF), spring (MAM) and fall (SON) seasons respectively.
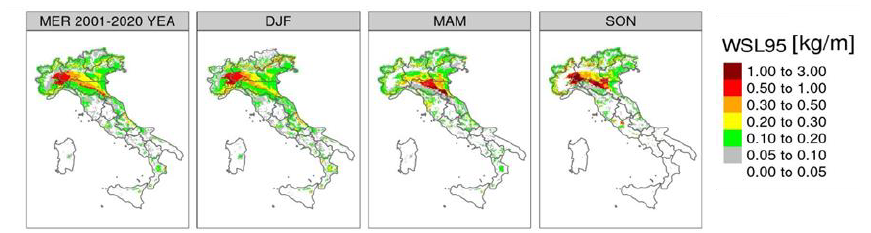
Figure 6 - Multi-model REF scenario of 95° percentile of wet-snow sleeve at annual and seasonal scale in RCP4.5 configuration in the reference period 2001-2020 [11]
Figure 7 shows, instead, future scenarios at short, medium and long-time perspective of expected snow sleeves considering the RCP4.5 configuration, expressed in terms of anomalies, i.e. differences between 95th percentile values between future and reference values. The results point out relatively complex patterns of climate change effects: wet-snow events will generally decrease in frequency and intensity at medium-low altitudes, as rainfalls will prevail over snowfalls due to global warming. But wet-snow events may intensify over elevated Apennine and Alpine regions so far spared because of their historical cold temperatures in RCP4.5, whereas sharply reductions are expected in RCP8.5 pathway, except for the highest Alpine mountains (not shown). Extreme Value Analysis scenarios confirm these trends.
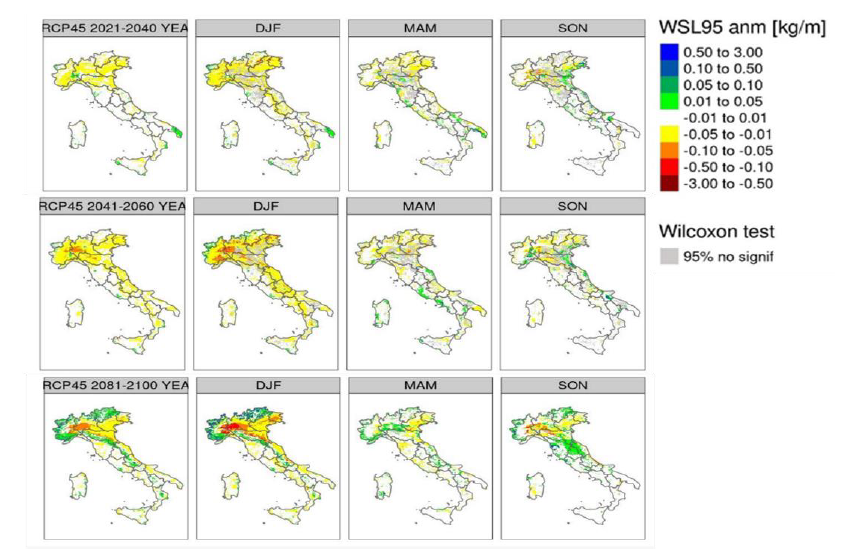
Figure 7 - Multi-model scenarios of 95th percentile of wet-snow sleeve at annual and seasonal scale in RCP4.5 configuration: future anomalies for 2021-2040, 2041-2060, and 2081-2100 from 1st to 3rd row
Monitoring wet snowfall and sleeve accretion at the Wild stations:
Wet-snow Ice Laboratory Detection (WILD) stations have been installed in different climatic areas of Italy where major electrical faults have occurred. The experimental spans, 75 m long, provide measurements of the snow sleeve load on different High Voltage (HV) and Medium Voltage (MV) diameter conductors, together with the main weather parameters involved during the snow accretion. WILD stations have been equipped with ice-free meteorological sensors, cameras on the towers, load cells, IoT on conductors and aerial cables for monitoring the sleeve load and the tilt of test span. In Figure 8, Vinadio site can be seen, one of the WILD stations located in the north-west Italian Alps. These monitoring sites are of paramount importance to study the singular phenomenon and to improve its modelling. The combination of weather and impacts on electrical lines measurements makes it possible to refine forecasting systems and to verify them. The most relevant events, in fact, could be otherwise validated only indirectly, by means of the failures data occurred on overhead power lines. For this reason, sleeve load measurements on the overhead lines in Italy are fundamental to evaluate the dynamics of the accretion over spans and compare these to the model simulations.
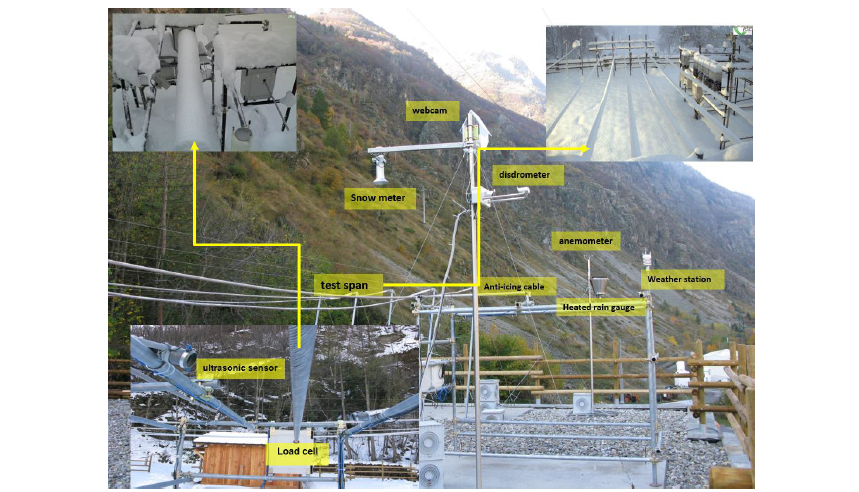
Figure 8 - Experimental field setup of Vinadio WILD stations. Load cells, weather instruments and web camera are used for snow sleeves monitoring during wet snow events
5. Strong winds
Strong wind phenomena constitute a meteorological threat which is gaining attention from the electric systems’ operators. In fact, recent years have been characterized by severe windstorms that affected the Italian territory. Among them the most significant is the “Vaia” storm that occurred at the end of October 2018 hitting Northeastern Italy. Specifically, very strong winds [100-200 km/h] hit the regions of Lombardy, Trentino-Alto Adige, Veneto and Friuli-Venezia Giulia with particular violence, knocking down over 42 million trees on an area of 41.000 hectares. This event caused numerous and prolonged interruptions in the electricity supply with failure and damage to the electric lines, due both to the direct effect of wind on the structures (with wind intensity exceeding 200 km/h) and to the indirect effects of the fall of trees on the overhead power transmission and distribution lines [12], [13].
The analysis of such extreme events in a complex geo-morphological situation, requires a higher spatial resolution higher than MERIDA’s 7 km. For this reason, a detailed analysis was carried out with a recently developed advanced high-resolution tool developed initially for energy planning purposes: the new Italian Wind Atlas – Atlante EOLico ItaliANo (AEOLIAN[1]) [14]. AEOLIAN consists of 30 years (1990-2019), 1 km resolution, hourly timestep wind data over Italy, both onshore and offshore, at different heights from the ground. To emphasize the advantage of using a higher-resolution dataset to reconstruct the wind field in complex terrain, Figure 9 depicts the comparison between measured 10m wind speed registered during the “Vaia” event at the Monte Cesen meteorological station (located in Veneto Region at about 1500 m at sea level), and previous reanalysis data (i.e MERIDA and MERIDA HRES, the latter being a new version of MERIDA with 4-km horizontal resolution).
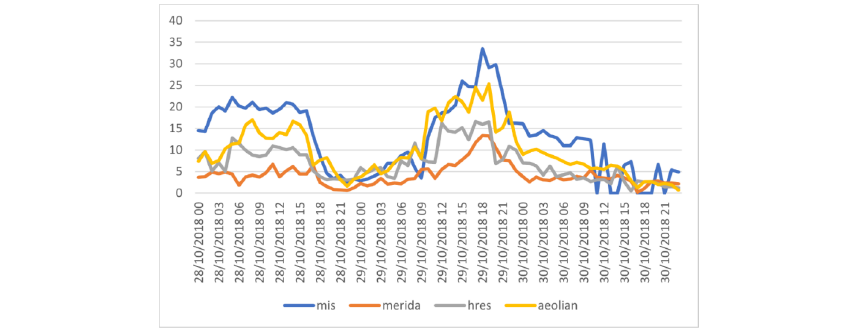
Figure 9 - Vaia case study, Monte Cesen station. Comparison between 10m measured wind data (blue), MERIDA (orange). MERIDA HRES (grey) and AEOLIAN (yellow)
AEOLIAN resulted more adherent to the measured series, while the coarser resolution datasets showed more significant deviations on some timesteps, indicating that their modeling configuration and resolution may be not adequate to reconstruct the wind field in complex orography. In addition, the peculiarity of a phenomenon such as “Vaia” must be outlined, with their devastating impact strongly depending on the orientation of the slopes and the morphology of the territory. In fact, in the range of few hundred meters only, areas affected by considerable damage are side by side with areas with almost no effect from the storm.
Figure 10 depicts another station in complex terrain (Monte Verena). In this case, it can be seen that the different datasets show a similar behavior, with AEOLIAN not showing a clear upper-hand in following the measured trend.
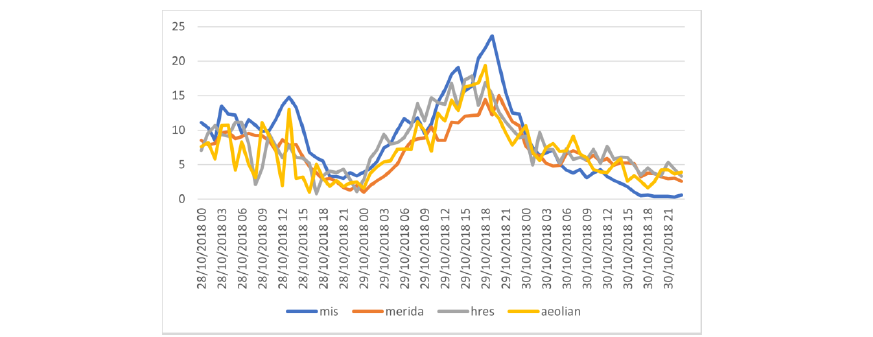
Figure 10 - Vaia case study, Monte Verena station. Comparison between 10m measured wind data (blue), MERIDA (orange). MERIDA HRES (grey) and AEOLIAN (yellow)
Overall, from this case study it can be deduced that extreme phenomena with such localized ramifications are particularly difficult to reconstruct, and even a high-resolution dataset can only try its best in reproducing the wind field.
From a longer-term climatic perspective, by using modeling data of average and maximum daily wind intensity, future scenarios were developed for the periods 2021-2050, 2041-2070, 2071-2100 characterizing both average and extremes of wind intensity and are shown in Figure 11. Because of the width of the spread among the models considered in the “ensemble” approach (standard deviation fields are generally greater than the change projected) [15], it is difficult to infer a clear signal, and the projections indicate a substantial stationary behavior of the anemological regime and, in particular, no significant changes in the occurrences of extreme winds, in accordance with previous studies [16].
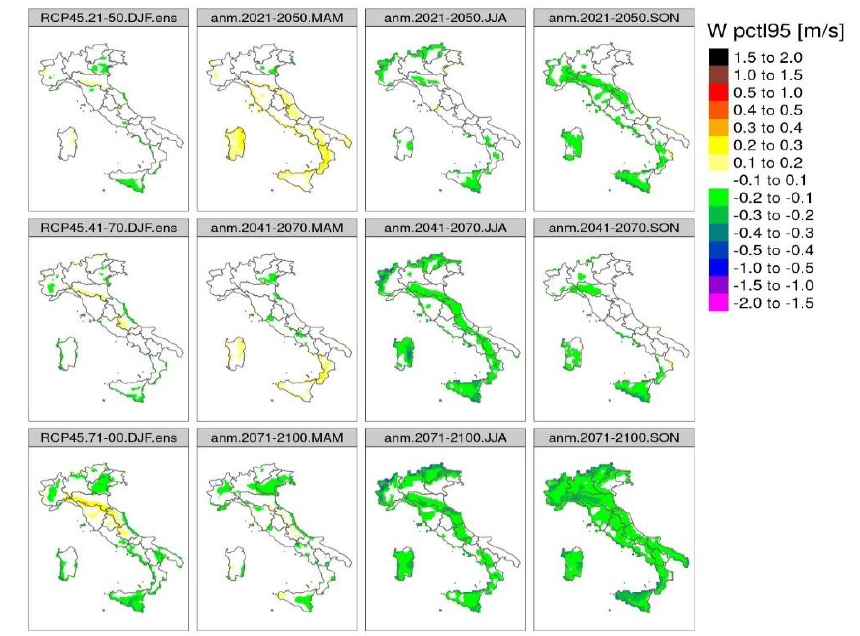
Figure 11 - Multi-model scenarios of 95th percentile of wind intensity at seasonal scale in RCP4.5 configuration: anomalies (against the base-line period 1971-2000) for 2021-2040, 2041-2060, 2081-2100 from 1st to 3rd row
6. Extreme precipitations
The general impact of total precipitation (snow and rain) on overhead transmission lines is linked with water infiltration excess in the terrain that creates runoff which can lead to urban floods in highly paved areas and to inundations when the river discharge exceeds channel-banks. Moreover, water infiltration and the consequent saturation of soil capacity, decreases soil coalescence and triggers landslides. In this framework, the use of the MERIDA and MERIDA HRES reanalysis tools [6] allows to describe both synoptic phenomena, (mainly originated from frontal systems) that are characterized by long-lasting and insisting precipitation over a widespread area that can cause landslides and extended river flooding (es. Piedmont Flood 1994); and the convective phenomena that trigger very intense and localized storms, possibly leading to devastating flash-floodings, urban floodings and debris-flow phenomena. Figure 12 and Figure 13 provide an example of the capability of the historical datasets to represent the total precipitation of each of the extreme events above mentioned: the Piedmont flood in 1994 that caused 70 deaths and economic losses corresponding to around 1.2% of the 1994 Italian GDP [17] and the 2011 urban flooding in Rome that totaled 120 mm in 2 hours in Rome (comparable to the monthly rainfall from climatology in that area) and that caused several damages to the urban infrastructure and to the electric substations in the area [6]. In both cases, the MERIDA reanalysis products were able to reproduce the extreme phenomena, with precipitation patterns and rainfall amounts that are comparable with the observations recorded by the Italian rain gauge network. Figure 12, shows the accumulated precipitation for the Piedmont Flood 1994 (from November 4th to November 6th, 1994, comparing MERIDA and interpolated station observations from the Italian station observations network: in this case MERIDA was able to depict the main precipitation peak and amount, according to the station observations. Figure 13) shows the accumulated precipitation map for the Rome urban flooding event of the 20th of October 2011 comparing MERIDA reanalysis with the accumulated precipitation at Baccano and at Roma EUR locations, as observed by the local rain gauges from the Italian station observations network. MERIDA was able to reproduce the intense and localized storms that happened in Baccano and Roma (panel a) and the precipitation peaks, as measured in Baccano (panel b) and ROMA EUR rain gauge stations (panel c).
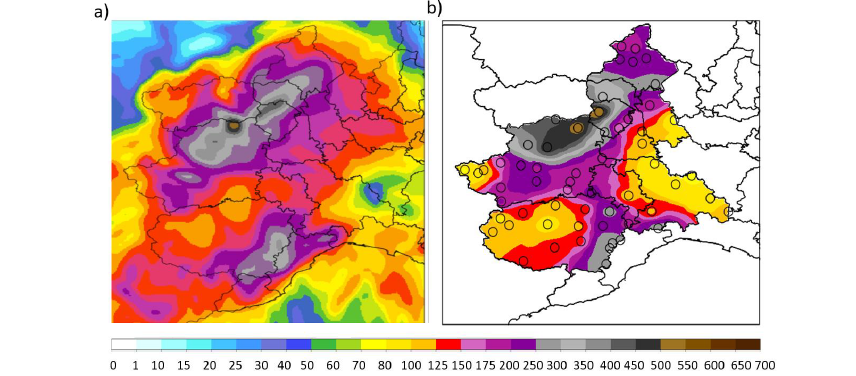
Figure 12 - Accumulated precipitation for the Piedmont Flood 1994. MERIDA (panel a); interpolated station observations from the Italian station observations network (panel b). The circles in panel b represent the positions of the rain gauges
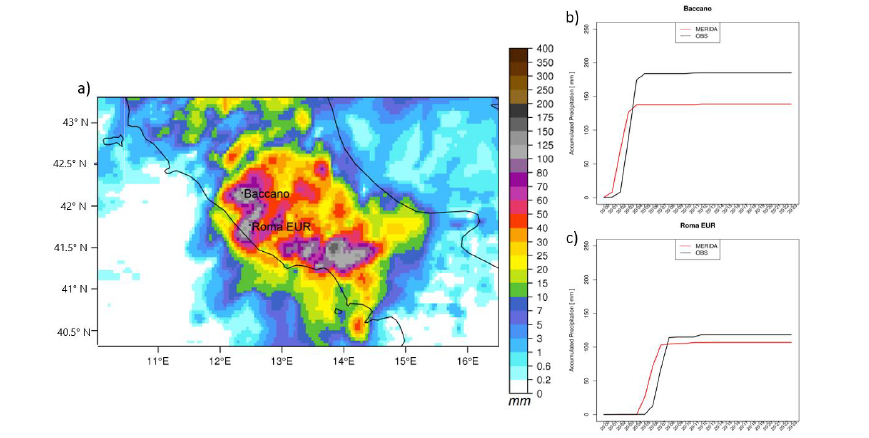
Figure 13 - Accumulated precipitation map for the Rome urban flooding event of the 20th of October 2011 from MERIDA reanalysis (panel a). Panel b and panel c show the accumulated precipitation at Baccano and at Roma EUR locations, as depicted by MERIDA reanalysis (red line) and as observed by the local rain gauges from the Italian station observations network (black line)
The availability of more than 20 years of data from the MERIDA reanalysis, also allowed to apply the Generalized Extreme Value [18] method to calculate the statistical return times and, consequently, the probability of occurrence of extreme precipitation events both for long-lasting synoptic events and for short and intense convective storms. The results shown in Figure 14 highlight the areas of the Italian peninsula that are most likely affected by extreme precipitation phenomena for different rainfall durations. Panel a), representing the probability of events with more than 50 mm in 3 hours, highlights the areas that have the highest probability of being affected by intense and localized storms. Such areas affect especially the Ligurian region, the Tyrrhenian coast and the Ionic regions of Italy, where intense storms form low-pressure systems over the western Mediterranean region, charging humidity from the sea and triggering intense and localized storms when they hit the coastal orography. Panel b), shows the probability of occurrence of events that exceed 100 mm precipitation in 24 hours: the area with the highest probabilities of occurrence reflects the areas in which most of the intense rainfall is caused by winter frontal systems that interact with the orography of the Alps and of the Apennines producing long-lasting and abundant rainfall over the North of Italy, the Ligurian region and the southern regions of Calabria and Sicily.
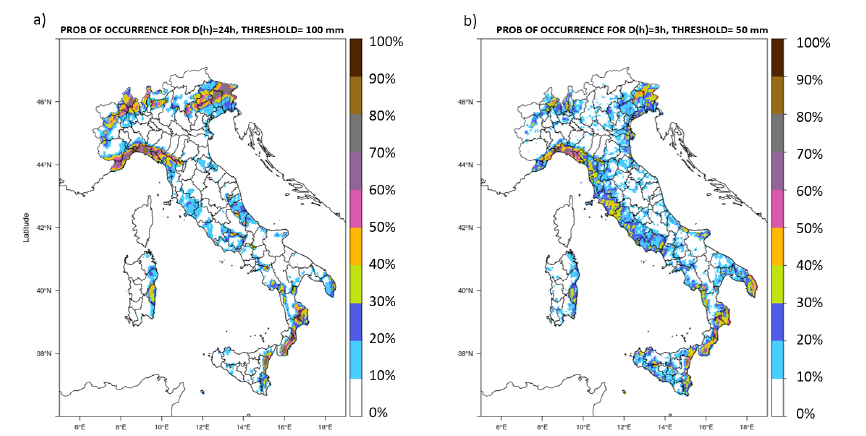
Figure 14 - Probability of occurrence maps for rainfall durations of 24h and rainfall thresholds of 100mm, that can be considered representative of extreme synoptic events (panel a) and rainfall durations of 3h and rainfall threshold of 50 mm, that can be considered more representative of convective events
To investigate the extreme precipitations expected over Italy using a climate approach, the WMO ETCCDI climate extreme index R99PTOT was used [19]. The index is specifically designed to describe climate extremes since it considers extremely wet days (i.e. when the precipitation rate exceeds the 99th percentile of the reference period). A clear trend toward exacerbation of the weather conditions is evident during the century, locally, over northern regions and the coastal areas with different intensities depending on RCP2.6, RCP4.5 and RCP8.5 hypotheses [20], as shown in Figure 15.
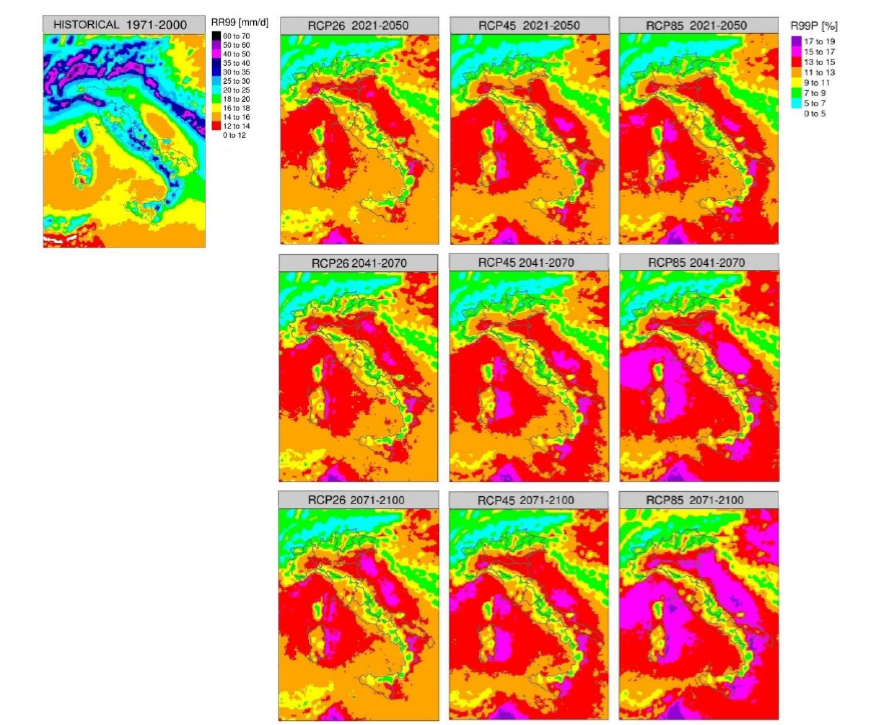
Figure 15 - a) Maps of the 99th percentile (RR99) in the reference period 1971-2000); b) Seasonal R99PTOT anomalies (unit = number of days), expressed as difference between the number of events (number of days) projected at short, medium and long term (from left to right) and those in the reference period 1971–2000 under RCP2.6 (left), RCP 4.5 (center), and RCP8.5 (right) configurations
7. Geo-Hydrological hazards [21]
In Italy, geo-hydrological hazards such as floods and landslides represent a serious threat to electrical infrastructure [22] [23] [24] [25]. Severe floods may affect the operativity of hydropower plants which have a crucial role in balancing extreme hydrological conditions and protecting downstream areas. On the other hand, powerlines may be hit by landslides causing a local failure that may propagate through the whole electrical network.
To evaluate and quantify these threats a new physical-based model called CRHyME (Climatic Rainfall Hydrogeological Modelling Experiment) has been built [26]. CRHyME is a spatially distributed model that can operate at basin scale simulating the occurrence of some geo-hydrological hazards strongly related to rainfalls such as shallow landslides and debris flow, quantifying their magnitude. CRHyME’s engine is based on PCRaster libraries [23] which is a collection of open-source software targeted at the development and deployment of spatio-temporal environmental models. The most innovative part of the code includes the physical relations that describe how the hydrological assessment can influence and potentially trigger the geo-hydrological hazards occurring at the basin scale. Since we are interested in modelling rainfall-induced landslides that may hit powerline networks, the slope stability processes are investigated. Geo-hydrological threats triggered by heavy rainfalls are generally distinguished between shallow landslide (SL) and debris flow (DF) phenomena [27]. Both can happen on terrain slopes or within water impluvium and are generated by a collapse of the superficial layer of the terrain. However, debris flows have higher water components, can move faster and further than shallow landslides and increase sensibly its volume due to erosion entrainment. Both processes have been investigated with CRHyME including the equation that predicts their possible triggering [22]. For further details about the whole structure of the CRHyME model see [23], [26].
CRHyME model is currently under development and here we show two possible applications of the model, one describing the back-analysis of past geo-hydrological episodes and one showing the future geo-hydrological hazard projections for high-voltage powerlines settled across two Italian catchments in the Emilia region. For the back-analysis case studies the outcomes of MERIDA reanalysis [6], [12] were considered as inputs while three different climatic models from the EURO-CORDEX [20] program gave us the future projections. The Emilia area experienced critical geo-hydrological episodes in October 2014 and September 2015 [28], [29] where several shallow landslide movements were triggered that have evolved in many cases to debris flow and flash floods. Three watersheds were particularly affected: the event of October 2014 hit the Parma catchment while the event of September 2015 hit the Trebbia and Nure catchments (Figure 16). The area is relatively important for the Italian electro-energetic network since several powerlines cross the two basins. According to the literature [1], [30], pylons represent the most vulnerable structure of electro-energetic networks since they may collapse with a high probability if they are hit by fast dynamic landslides. On some occasions, a single collapse is coped with by the network but for high voltage powerlines redundancy may be not always assured so more attention should be paid to planning purposes. The occurrence of geo-hydrological threats in terms of shallow landslide and debris flow failures was evaluated against the high-voltage powerlines settled in the catchments (Figure 16).
For the Emilia case study, CRHyME simulations were carried out considering 5 years from 01/09/2011 up to 01/09/2016 where the investigated geo-hydrological events of 13/10/2014 and 14/09/2015 have been recorded in the area. MERIDA reanalysis data in terms of daily rainfall and temperature were considered to carry out the simulations.
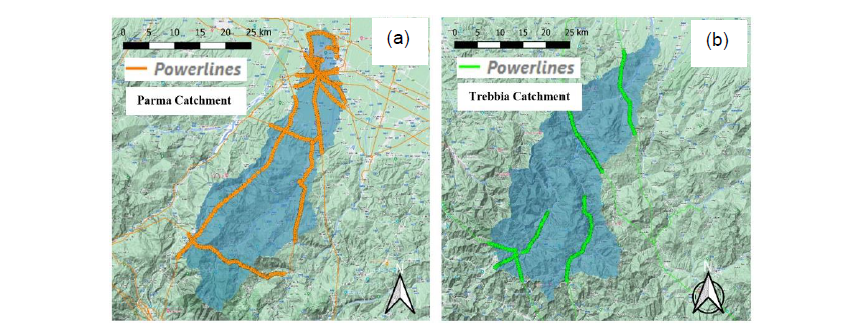
Figure 16 - A) and B) detail of Parma and Trebbia catchment's position with respect to the national powerline network (Base layer from © Google Maps 2023)
The performance of CRHyME in detecting the triggered debris flow during the events of October 2014 and September 2015 (Figure 17) was assessed again through ROC (Receiver Operating Characteristic) curves 31]. In most cases the model has outperformed the random classifier, showing a sensitivity comprised between 0.1- 0.2 and a higher value of specificity depending on the chosen slope stability parameters. In our simulations, debris flow failure has been effectively detected across a small valley impluvium, confirming the onsite observations: the highest scores were obtained for the Nure catchment, intermediate rank for the Parma basin and poor description of instabilities for the Trebbia watershed.
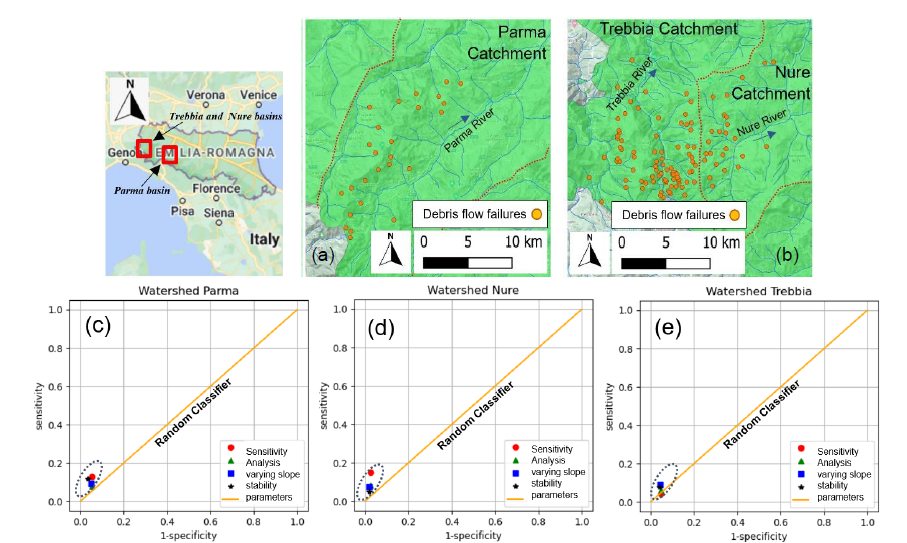
Figure 17 - A) Debris flows triggered in the Parma basin during the event of October 2014 and B) debris flows in Trebbia and Nure basins during the event of September 2015. Orange points are the mass wasting starting points reported after the event. Representation of ROC curves for Parma C), Nure D) and Trebbia E) watersheds for the events of October 2014 and September 2015. Base layer from © Google Maps 2023
Since these types of events are likely to re-occur in the future, the CRHyME model was driven under three different climate change scenarios to investigate the possible future geo-hydrological hazards. Climate models come from the EURO-CORDEX project [7], [32], and a climate scenario of RCP 8.5 was considered (Table 1). For the EURO-CORDEX models analysed (e.g., mod2, mod3 and mod4), CRHyME was run for the future projection, from 01-01-2006 to 01-01-2075.
| Id | Name | EURO-CORDEX Climatic Model |
|---|---|---|
2 | mod2 | CLMcom_EC-EARTH_CCLM |
3 | mod3 | CLMcom_MPI-ESM-LR_CCLM |
4 | mod4 | CLMcom_CNRM-CM5_CCLM |
Long-term simulations were conducted to estimate the probability of landslide occurrence at a particular location. There, a shallow landslide frequency (SLfrequency) and a debris flow frequency DFfrequency) have been calculated as a ratio of the number of failures and the length of the simulation period (Eq. 1). Strictly speaking, landslide failure is not a periodic process because after that local geomorphological changes may modify the slope stability behaviour [2], [33]. Nevertheless, since these features cannot be modelled explicitly, the frequency is considered an index of the most conditionally unstable areas where to pay attention to.
(1)
In Figure 18 and Figure 19, the frequencies of shallow landslide failure and debris flow with respect to the future climate change scenario from the mod2 simulation are reported. Similar maps were obtained with mod3 and mod4 (not reported). Since this frequency is computed considering failures recorded each day, it is possible to approximate with the probability P, comprised between 0-1. In this sense, the most unstable areas have been highlighted in red while the stable areas are in white in both catchments. The powerlines tracked in the areas have been superimposed, obtaining a visual interpretation of the most hazardous sectors exposed to shallow landslide and debris flow threats.
The main result of our analysis is represented by the maps produced in Figure 18 and Figure 19 where a probability of SL and DF has been assessed at the catchment scale and then superimposed to the existing power network. From a risk assessment viewpoint, we have highlighted two important facts: the location of the most vulnerable pylons and an estimation of the temporal recurrence of possible failure, as the reciprocal of the frequency computed. Considering the total simulation period of 70 years (from 2005-2075), the most vulnerable pylons have a probability of failure P > 0.2-0.3 up to 0.5 which corresponds to a theoretical failure return period (RP = 1/P) of between 5-2 years or less. Again, this measure should be intended as an index propaedeutic for further investigations that are needed to address the specific vulnerability of each pylon. As a result, we suggest that for the Trebbia basin, the most vulnerable powerline sector is located near Salsominore town while for the Parma basin near the Berceto town. Curiously, the pylon that will experience the highest DF failure probability is located near the areas that experienced serious geo-hydrological issues during the episodes of September 2015 and October 2014, confirming the high landslide susceptibility of those places. For these sectors is likely that in the future geo-hydrological hazards may cause some problems so mitigation measures (Figure 20) or pylon relocations are recommended for preventing powerline failure and possible blackouts.
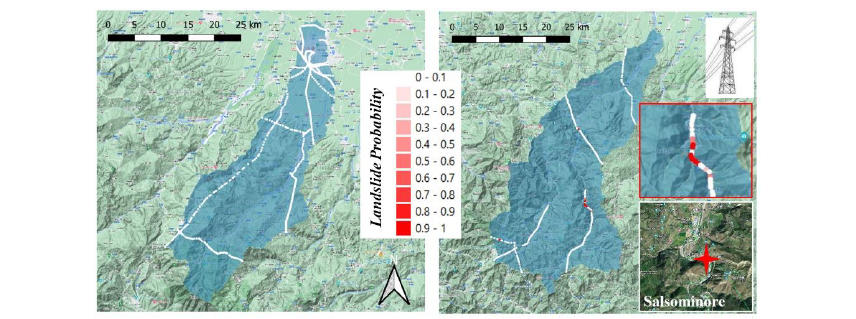
Figure 18 - Probability of failure for SL for high-voltage powerlines across Parma and Trebbia catchments (Base layer from © Google Maps 2023)
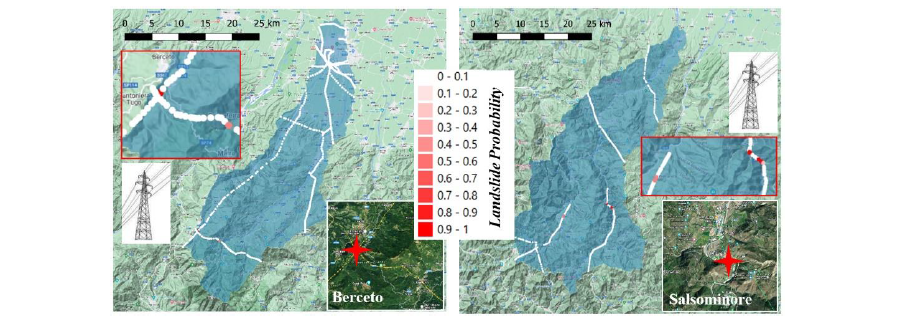
Figure 19 - Probability of failure for DF for high-voltage powerlines across Parma and Trebbia catchments (Base layer from © Google Maps 2023)
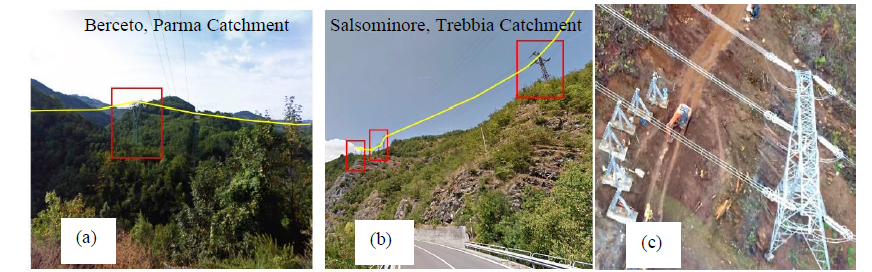
Figure 20 - A) and B) location of the most vulnerable pylons across Parma (near Berceto town) and Trebbia (near Salsominore town) catchments; C) possible interventions to protect the pylons against SL and DF (Vancouver, USA) (Photos from © Google Maps 2023)
8. Conclusions
Overhead lines are exposed to intense weather events that may impact their performances or even threaten their structural integrity. Transmission system operators are required to implement adequate measures to increase the resilience of power networks. Short term operational decisions to increase the resilience of power lines and long-term planning and network reinforcement measures can be carried out using advanced probabilistic approach to risk. The methods set up in Italy require to compute the severity, the extent and duration of the threats, in terms of associated probability distributions, knowing the evolution of meteorological phenomena over geographically spread infrastructures.
To assess the evolution of the threats during the recent past and the current period, an atmospheric reanalyses dataset, called MERIDA, has been developed and validated for wet snow, strong winds and extreme precipitations. The dataset can be used as an input for models able to evaluate the potential impact of different meteorological threats and assess the efficiency of resilience measures. The model chain has proven its validity in reconstructing some outstanding events including wet-snow (2017), strong winds (2018), extreme precipitations (1994 and 2011) and in highlighting the areas of the Italian peninsula that are historically more exposed to each of these threats.
Long term climate-related projections are carried out using an ensemble of high-resolution regional models, adequately selected, and validated, to elaborate future climate scenarios under different greenhouse gases emissions pathways (namely, RCP8.5 and RCP4.5). Climate projections show wet-snow events generally decrease in frequency and intensity at medium-low altitudes while intensifying over elevated Apennine and Alpine regions. In addition to that, extreme precipitations result to increase locally, mainly over northern regions and over the coastal areas, while no significant changes in the occurrences of extreme winds was detected in the analyses.
The geo-hydrological hazards are very frequent and related to meteorological and climate forcing but their magnitude is difficult to quantify properly. Nonetheless, the former is necessary for carrying out a proper risk assessment and defining strategies for increasing electrical infrastructure resilience. This is particularly true under the projected future climate change scenario where extreme events intensification is expected with high confidence. The new model CRHyME represents a novelty in the panorama of the classical spatially distributed hydrological model, trying to couple together slope failure models with the hydrological part and including extreme events reanalysis and climate change scenarios in the simulation.
The methodology described in this paper allowed to assess the occurrence of extreme weather threats on overhead lines and to successfully use this information in the evaluation of resilience measures to be adopted by the transmission system operator. Resilience plans based on the application of the described method are adopted with the approval of the national regulation Authority.
References
- E. Ciapessoni, D. Cirio, A. Pitto, P. Marcacci, M. Lacavalla, S. Massucco, F. Silvestro and M. Sforna, “A Risk-based methodology and tool combining threat analysis and power system security assessment,” Energies, vol. 11, no. 83, 2018.
- A., Trigila; C., Iadanza; B., Lastoria; M., Bussettini; A., Barbano, “Dissesto idrogeologico in Italia: pericolosità e indicatori di rischio - Edizione 2021,” ISPRA, Roma, 2021.
- TERNA, “Informativa di Terna sul Cambiamento Climatico,” 2023. [Online].
- W. Skamarock, J. Klemp and J. Dudhia, “A Description of the Advanced Research WRF Version 3,” Tech. Note NCAR/TN-475+STR, 2008.
- H. Hersbach, B. Bell, P. Berrisford and al., “The ERA5 global reanalysis,” Q J R Meteorol Soc, vol. 146, no. 730, pp. 1999-2049, 2020.
- R. Bonanno, M. Lacavalla and S. Sperati, “A new high‐resolution Meteorological Reanalysis Italian Dataset: MERIDA,” Quarterly Journal of the Royal Meteorological Society, vol. 145, no. 721, pp. 1756-1779, 2019.
- F. Giorgi and W. Gutowski, “Regional dynamical downscaling and the CORDEX initiative,” Annu. Rev. Environ. Resour., vol. 40, pp. 467-490, 2015.
- P., Faggian; R., Bonanno; M., Lacavalla; P., Marcacci; G., Pirovano, “Research and operational activities to cope with wet snow impacts on overhead power lines in current and future climate over Italy,” in Proceedings of the CIGRE’-SEERC 2nd South East Regional CIGRE Conference, Kyiv - Ukraine, 2018.
- D. Van Vuuren, J. Edmonds, M. Kainuma, K. Riahi, A. Thomson, K. Hibbard, G. Hurtt, T. Kram, V. Krey and J.-F. e. a. Lamarque, “The representative concentration pathways: An overview.,” Climate Change, vol. 109, p. 5–31, 2011.
- ISO, “ISO 12494:2017, Atmospheric Icing of Structures,” 2017.
- P., Faggian; A., Trevisiol; G. ,Decimi, “Future projections of wet snow frequency and wet snow load on overhead high voltage conductors over Italy,” Cold Regions Science and Technology, no. https://doi.org/10.1016/j.coldregions.2023.103980, 2024.
- F., Viterbo; M. Lacavalla, R., Bonanno; S., Sperati, A. Ceppi, “La rianalisi meteorologica e idrologica a supporto del sistema elettrico nazionale per l’individuazione delle minacce atmosferiche e al suolo,” Ricerca di Sistema, Milano, 2022.
- M., Lacavalla; R., Bonanno; S., Sperati, “Dataset MERIDA per il calcolo dei tempi di ritorno delle principali minacce meteorologiche per l'alimentazione dei modelli di vulnerabilità della rete,” Ricerca di Sistema, Milano, 2020.
- S., Sperati; S., Alessandrini, “La nuova banca dati anemologica italiana,” Ricerca di Sistema (RdS), Milano, 2021.
- B. Rockel; K. Woth, Extremes of Near-Surface Wind Speed over Europe and Their Future Changes as Estimated from an Ensemble of RCM, 2007.
- P. Faggian, “Climate Change Projections for Mediterranean Region with Focus over Alpine Region and Italy,” Journal of Environmental Science and Engineering B, vol. 4 (2015), no. doi:10.17265/2162-5263/2015.09.004, pp. 482-500, 2015.
- Consiglio Nazionale delle Ricerche, Istituto di Ricerca per la Protezione Idrogeologica (CNR-IRPI), “Evento alluvionale in Piemonte. 02-06 Novembre 1994,” Popolazione a Rischio da Frana e da Inondazione in Italia (POLARIS), [Online] [Accessed 21 04 2023].
- S. Kotz.; S. Nadarajah, Extreme value distributions: theory and applications, World Scientific, 2000.
- WMO, “Guidelines on Analysis of Extremes in a Changing Climate in Support. of Informed Decisions for Adaptation,” Technical Report WCDMP. No. 72, WMO/TD-No. 1500, Geneva, Switzerland, 2009, 2009.
- P. Faggian, “Future Precipitation Scenarios over Italy,” Water 2021, 13, 1335, vol. 13, no., p. 1335, 2021 [online]
- A. Abbate; L. Mancusi; F. Apadula; M. de Nigris, “CRHyME (Climatic Rainfall Hydrogeological Model Experiment): a model for geo-hydrological hazards quantification to electrical infrastructures,” in CIGRE 2023 Sendai Colloquium, Japan, 3-7 October 2023, Sendai - Japan, 2023.
- L. Mancusi and A. Abbate, “Manuale del modello CRHyME (Climate Rainfall Hydrogeological Modelling Experiment), RSE Report RdS 21012462,” RSE, Milano, 2021.
- L. Mancusi and A. Abbate, “Strumenti per la mappatura delle minacce idrogeologiche per il sistema energetico e incidenza dei cambiamenti climatici RSE Report RdS 21010317,” RSE, Milano, 2021.
- N. Bernardo, L. Vadacca and A. Abbate, “Valutazione integrata delle pericolosità geologiche per il sistema elettro-energetico italiano: individuazione di un caso pilota strategico,” Ricerca di Sistema 2022 n. 22014047, Milano, 2022.
- A. TRigila; C. Iadanza; B. Lastoria; M. Bussettini; A. Barbano, “Dissesto idrogeologico in Italia: pericolosità e indicatori di rischio - Rapporto 233/2015,” ISPRA , Roma, 2015.
- A. Abbate, Hydrogeological hazards evaluation under climate change scenarios : an application of the CRHyME model (Climatic Rainfall Hydrogeological Modelling Experiment), Milano: Politecnico di Milano, 2022.
- D. Varnes, “Slope movement types and processes,” Special Report, vol. 176, pp. 11-33, 1978.
- G. Ciccarese, M. Mulas, P. P. Alberoni, G. Truffelli and A. Corsini, ““Debris flows rainfall thresholds in the Apennines of Emilia-Romagna (Italy) derived by the analysis of recent severe rainstorms events and regional meteorological data”,” Geomorphology, no. doi: 10.1016/j.geomorph.2020.107097, p. p. 107097, Jun. 2020.
- G. Ciccarese; M. Mulas; A. Corsini, “Combining spatial modelling and regionalisation of rainfall thresholds for debris flowhazrds mapping in the Emilia-Romagna Apennines (Italy),” Landslides, vol. 18, pp. 3513-3529, 2021.
- Y. Ge et al., “A comparison of five methods in landslides susceptibility assessment: a case study from the 330kV transmission line in Gansu Region, China,” Environmental Earth Science, vol. 77, no. 19, p. 662, 218.
- V. Vakhshoori and M. Zare, “Is the ROC curve a reliable tool to compare the validity of landslide susceptibility maps?,” Geomatics, Natural Hazards and Risk, vol. 9, p. 249–266, January 2018.
- D. Jacob, “EURO-CORDEX: new high-resolution climate change projections for European impact research,” Regional Environmental Change, vol. 14, no. 2, pp. 563-578, 2014.
- J. Corominas; J. Moya, “A review of assessing landslide frequency for hazard zoning purposes,” Enginnering Geology, vol. 102, no. 3, pp. 193-213, 2008.
- R. Bonanno, M. Lacavalla and S. Sperati, “A new high-resolution Meteorological Reanalysis Italian Dataset: MERIDA,” Quarterly Journal of the Royal Meteorological Society, vol. 145, no. 721, pp. 1756-1779, 2019.
Acknowledgment
This work has been financed by the Research Fund for the Italian Electrical System under the Three-Year Research Plan 2022-2024 (DM MITE n. 337, 15.09.2022), in compliance with the Decree of April 16th, 2018.