Development of Evaluation Process for Demand-Side Resilience against Power Outage
N. SAKAI, T. TOBO, R. TAKAHASHI - Toshiba Energy Systems and Solutions Corporation, Japan
Y. IINO, K. YABE, Y. HAYASHI - WASEDA University, Japan

Summary
Power outage caused by natural disasters such as earthquakes and typhoons is likely to take a few days to restore service and has been one of the issues for social infrastructure. As climate change could make weather events severer and more frequent, it is getting more important to reinforce resilience against the malfunction of power system. Distributed Energy Resources (DERs), represented by integrated systems of photovoltaic power (PV) and batteries, are supposed to be effective to improve reliability of power supply as a part of Business Continuity Plans (BCPs) for consumers whose business needs continuous energy. However, clarifying the benefit of DERs in case of power outage is not easy due to variety of causes and uncertainty of occurrence. The objective of this study is to develop a process of evaluating the ‘resilience value’ of DERs. This process is expected to help reduce costs to reinforce overhead power lines against natural disasters by boosting DER installation on the demand-side.
The evaluation process mainly consists of five steps: evaluation condition setup, probabilistic risk assessment, resilience curve analysis, risk curve construction, and resilience value calculation. For the evaluation condition setup, specifications of power supply equipment including DERs and daily load patterns of consumers changing with weather are collected to set evaluation conditions. Probabilistic risk assessment identifies likely combinations of component states in the demand-side energy system exposed to hazards by event tree analyses. In the resilience curve analysis, transient balance between consumer load and available DER supply during power outage is calculated for each combination of component states by optimizing objective functions to minimize costs considering the penalty for lost load which is divided according to three importance levels. Risk curves are drawn with lost load associated with each combination of component states and cumulative probabilities for its occurrence, providing expected values of lost load caused by the hazards. Eventually, ‘resilience value’ is acquired as the difference between values of lost load (VoLL) with DERs and without any demand-side countermeasures.
As a case-study, the resilience values of a single five-storied building in case of an earthquake were evaluated. The building had been originally equipped with an emergency diesel generator (EDG) for its critical load demand and was assumed to add PV power system with batteries at the roof floor in the evaluation. For the risk analysis, fragility values of six system components by an earthquake leading to seven-day power outage were determined, and occurrence probabilities for combinations of component states were acquired. Resilience values were calculated from the difference in the area formed by the risk curves. The results showed that resilience values for the total service life of the equipment would increase if the renewable DERs were added to the building. The application of the evaluation process will be extended to complex facilities with multiple buildings and DERs connected with each other.
Keywords
Distributed Energy Resources (DERs), Power Outage, Probabilistic Risk Assessment(PRA), Resilience, Risk Curve, Value of Lost Load1. Introduction
Natural disasters such as earthquakes and typhoons are one of the causes of commercial power outage. For instance, a big earthquake damaged several thermal power plant units near the epicenter in Hokkaido, the northernmost part of Japan in September 2018, resulting in the blackout all over the region for the first time[1]. Typhoon Faxai hit the Kanto region near Tokyo in September 2019, leaving about 930,000 homes/buildings without power supply[2]. In this event, it took approximately two weeks to fully restore the service due to limited staffing and difficulty in clearing fallen trees to access the damaged power lines and utility poles. Since climate change could make weather events severer and more frequent, it is getting more important to address these damages to power transmission/distribution system and consequent power supply malfunction.
At the demand-side, on the other hand, some of consumers are installing Distributed Energy Resources (DERs), represented by integrated systems of photovoltaic(PV) power and batteries. As DERs are primarily equipped with in view of expanding renewable energy system, they are also effective to improve resilience of power supply as a part of Business Continuity Plans (BCPs), especially for consumers whose business needs continuous energy. Spread of DERs at the demand-side could be helpful to the supply-side by saving necessary resource to address system troubles including power outage.
Approaches of measuring resilience have been studied mainly in the field of civil and construction engineering. Bruneau[3] proposed a concept of evaluating resilience as shown in Fig. 1, which represents temporal changes of function or quality R(t) in system of interest. The value of R(t) is normally 1.0, fulfilling the demand of the system. Once a trouble in the system or a disaster occurs at the time t0, R(t) decreases in a certain level according to the damage, and gradually returns to the normal operation at the time t1 as the system is restored. Eventually, the change in R(t) forms a ‘hollow’ that resembles a triangle, called ‘resilience triangle’. Enhancing resilience corresponds to minimize the area of the resilience triangle, as shown in Eq(1):
(1)
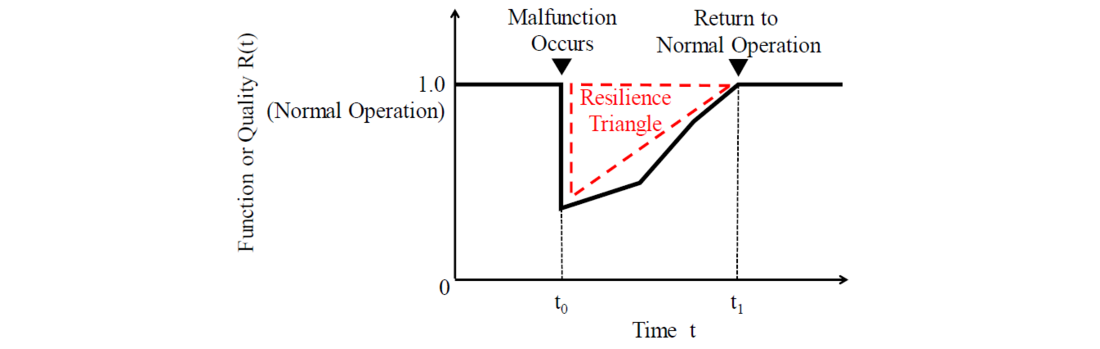
Figure 1 - Concept of Resilience Triangle
However, the advantage of DERs in terms of resilience improvement is not usually considered in the installation of power supply system in consumer’s facility. One of the reasons is that it is difficult to quantify values of resilience improvement. There are various causes leading to power outage, such as natural disasters, terrorism, failure in system components including degradation, human errors in system management, and imbalances beyond design basis of power system. Due to uncertainties in when and how these events occurs, it is necessary to assume some conditions for severity of events and impacts on the power system, in evaluating return on investment in DERs as countermeasures against power outage. Deterministic methods, in which certain conditions are given to analyze whether system can control harmful effects, are likely to obtain conservative results by postulating certain occurrence of accidents and troubles. In these methods, it is difficult to assess appropriateness of investment scale to achieve the target system quality, because responses and fluctuations of power supply and demand cannot be considered in a realistic manner. Probabilistic methods have the potential of contributing to the construction of more reasonable countermeasures by considering probabilistically uncertainties in the evaluation conditions including the possibility of events leading to power outage.
The objective of this study is to develop the process of evaluating the ‘resilience value’ of DERs in case of power outage by the resilience area calculation, combined with probabilistic methods that consider uncertainties in occurrences of adverse events to the demand-side power supply system. The evaluation process is expected to help reinforce power supply resilience on the demand-side, as well as boost installation of renewable energy system. In the following sections, details of the process to calculate the resilience value for DERs are explained, Evaluation results of the application to a single building as a simple case study are also presented.
2. Evalutation process
Fig. 2 shows an overview of the process to evaluate resilience value for DERs installed in consumer’s facility. The process is basically divided into five steps: evaluation condition setup, probabilistic risk assessment, resilience curve analysis, risk curve construction, and resilience value calculation. Each step is described as follows:
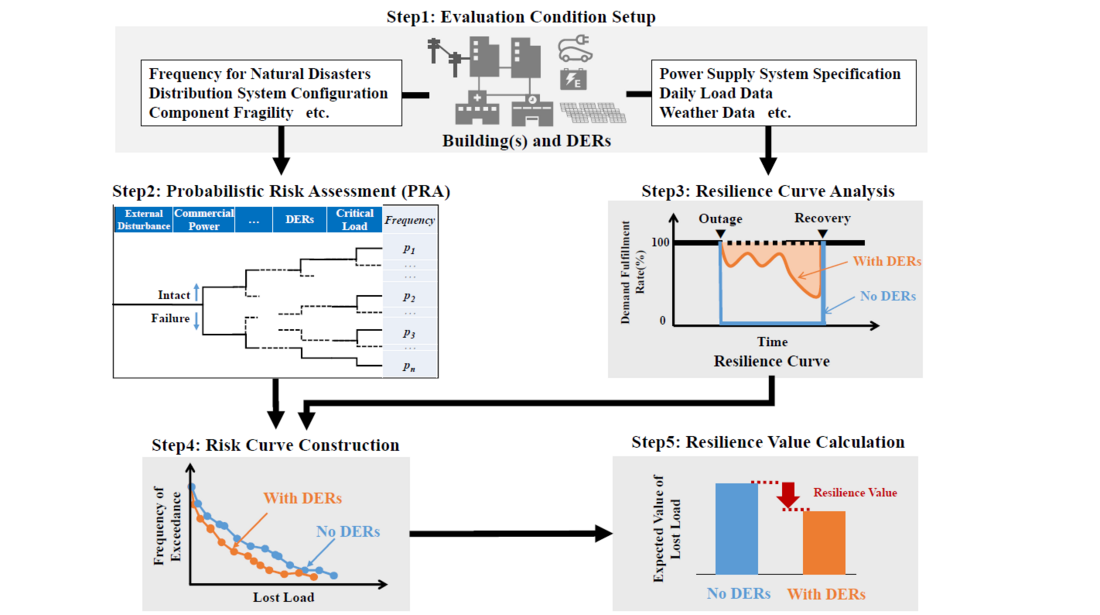
Figure 2 - Overview of Resilience Value Evaluation Process
2.1. Evaluation condition setup
The first step is to organize input data used for resilience evaluation conditions, such as specifications of buildings and DERs as power supply system for the facility, configuration of power distribution system, and daily load patterns along with weather data. It is also necessary to collect information related to risk assessment: frequency of disasters at the facility location area and fragility of each component against hazards leading to power outage.
2.2. Probabilistic risk assessment
This step calculates the probability of occurrence for each consequence of system malfunction caused by an initiating event, in which components are intact or damaged according to their fragilities. Probabilistic Risk Assessment (PRA), which has been adopted in nuclear and aircraft industries, is a methodology to assess the safety level for large and complex technological system including the effects of its measures against postulated hazards. In this study, we applied event tree analyses as a particular method. An event tree is a tree diagram that systematically shows how an extraordinary event could influence on system integrity with some branches based on its configuration, as shown at Step 2 in Fig. 2. The probability for each end-state is derived by tracking the branches that determine the availability of each system component in a hazardous event.
2.3. Resilience Curve Analysis
In this step, objective functions are formulated under the constraint conditions such as the availabilities of each component identified as end-states in the event tree and performance of DER influenced by the weather and the amount of fuel. Load of the facility is classified into three importance levels (critical, semi-critical and others) by analyzing annual load patterns as well as comparing day/night or weekdays/weekends demands. The objective function aims at minimizing cost for lost load (and fuel costs for emergency generators, if any) at each level during the period of power outage, represented by
(2)
Cg : Fuel cost for emergency generator
𝐺𝑒𝑛(𝑡) : Output from emergency generator at time t
𝐶𝑛: Penalty cost of demand importance level n
𝐷𝑅𝑛(𝑡): Restrained demand for important level n at time t
Optimizing Eq.(2) gives 𝐷𝑅𝑛(𝑡) during power outage. Resilience R(t) for the power system of the facility is calculated from Eq.(3), using 𝐷𝑛(𝑡), the demand for each level n:
(3)
The resilience curve in each end-state is drawn from the transient balance between consumer load and DERs supply available with the most efficient operation in the event of power outage.
2.4. Risk Curve Construction
Since R(t) derived from Eq.(3) corresponds to demand fulfillment rates, relative lost load is calculated with Eq. (1). A risk curve is drawn by plotting the relative lost load in order from the largest one for the horizontal axis, and frequencies of exceedance in the vertical axis. The frequency of exceedance is defined as a frequency at which the relative lost load exceeds a certain amount at least once for a designated period (usually one year), as it is acquired by accumulating the probability of occurrence for each end-state. The summary of constructing a risk curve is shown in Fig. 3.
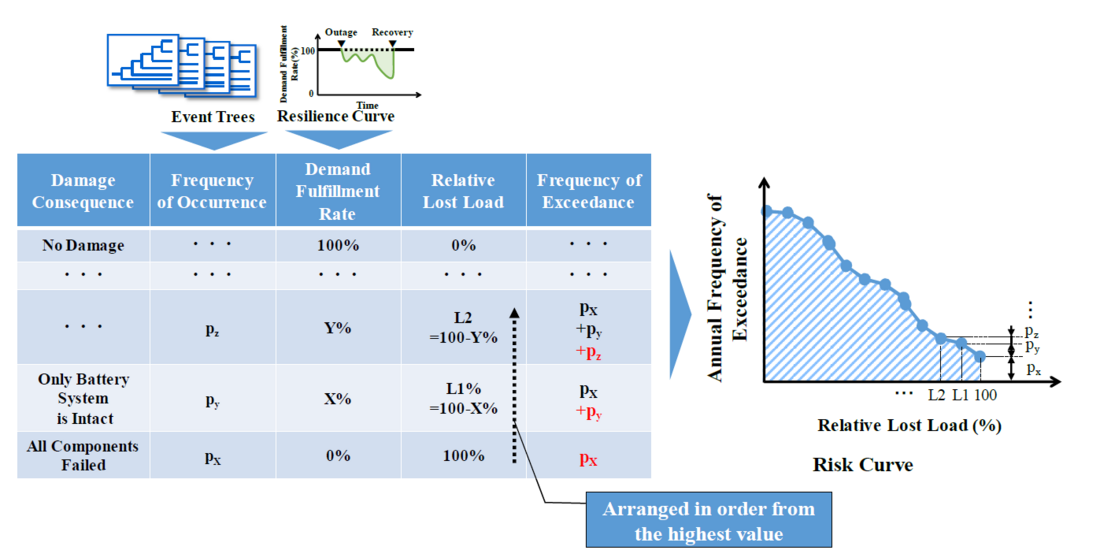
Figure 3 - Process for Risk Curve Construction
2.5. Resilience Value Calculation
The area formed by the resilience curve as shown in Fig.3 and the two axes represents the expected value of relative lost load (VoLL). VoLL is determined by the estimated monetary damage and the amount of electricity not served in the event of power outage. A resilience value is thus calculated from the difference between the VoLL with DERs and that without any countermeasures. This value can be regarded as part of the benefits of the DER installation including risk of adverse events.
3. Case Study
3.1 Analysis Condition
As a simple case-study, resilience values of a single five-storied building in case of an earthquake were evaluated. Table. 1 presents the specification of the building and DERs. It is located at the Kanto region, near Tokyo, and used for offices with some servers. An emergency diesel generator is originally equipped with for the critical load demand of the building. In this study, PV system with batteries was assumed to be added at the roof floor to estimate the effect on resilience improvement in case of power outage. Annual electricity consumption data of the building in 2019 were analyzed to classify the demand into three importance levels (380kW for critical load, 430kW for semi-critical load, and 500kW others) by the Non-Intrusive Load Monitoring.
| Location | Kanto region, near Tokyo |
|---|---|
| Number of floor | 5, No basement floor |
| Total Floor Space | Approximately 23,000 m2 |
| User | Office, Data center |
| DERs | Existing resource: 380 kW Emergency diesel generator (EDG) with fuel for 3-day BCP Assumed for case study: - 390 kW PV system (covering 40 % of the roof area) Power conditioner efficiency: 95% - 360 kW Battery (720 kWh) Charge/Discharge efficiency: 95 % |
For the risk analysis, the power supply system of the building was divided into six components: commercial power supply, power distribution panels, EDG, PV system, battery, and appliances used for the critical demand. Based on these components, branches were arranged in an event tree as shown in Fig. 4.
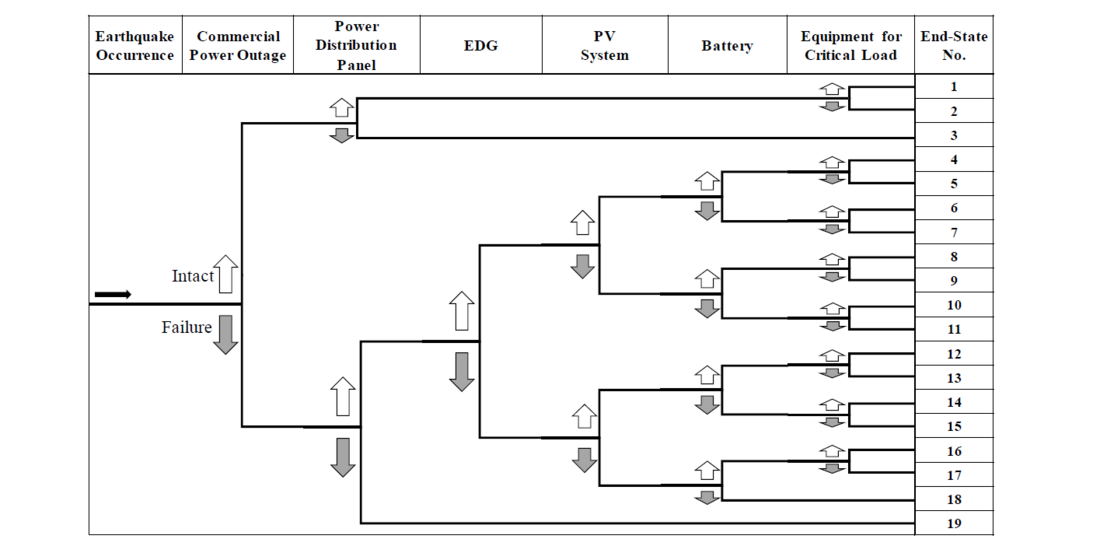
Figure 4 - Event Tree
The directions at each branch represented the state of the component at its heading, upward for intact and downward for failure. Branches are not located when the state of the component does not influence on the analysis condition. For instance, as the building is unable to supply power through the failed power distribution panel, the states of the following components are not necessary to be judged as shown in the end-state No.3 and 19 in Fig. 4.
The occurrence frequencies of six earthquakes with different peak ground acceleration (PGA) were acquired from the hazard curve at the building location[4]. Fragility curves of the components to determine the direction at each branch were constructed on the basis of the references[5,6]. Both curves are presented in Fig. 5. Once an earthquake occurred, recovering from power outage was assumed to take seven days.
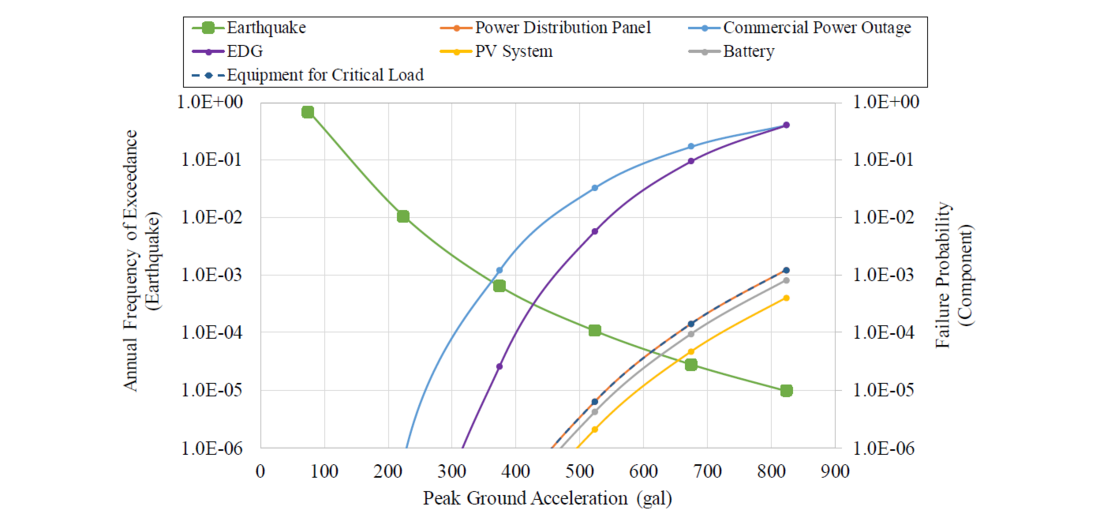
Figure 5 - Hazard Curve for Earthquake and Fragility Curves of Components
3.2. Results and Discussions
Fig. 6 shows two representative resilience curves for power outage; Only EDG is available for one case, and PV and batteries are added for the other. Both curves were calculated as annual average data.
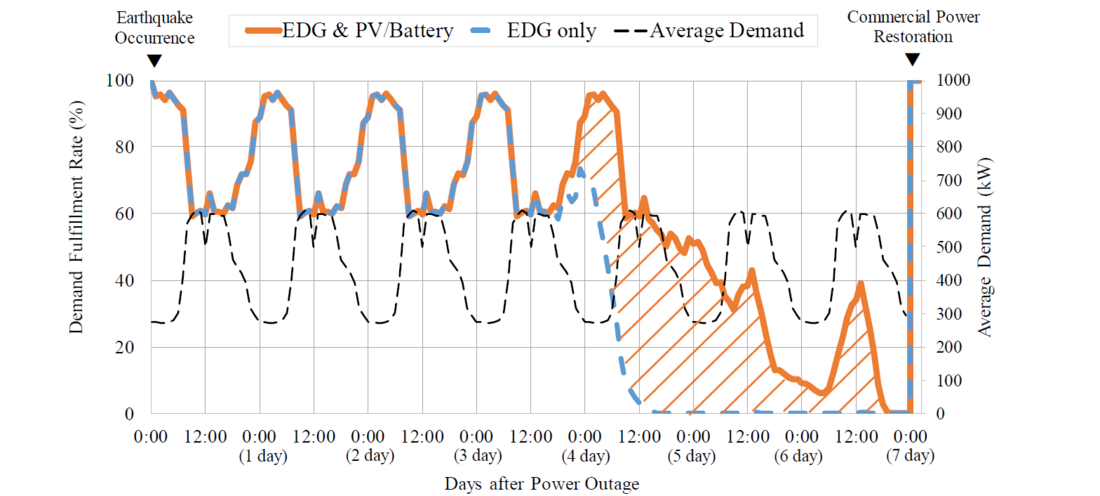
Figure 6 - Resilience Curve against 7-day Power Outage
Two curves coincided for about four days after the earthquake occurrence (initiation of power outage), indicating that loads of lower importance (e.g. loads for general air conditioning and appliances in the daytime) were limited for both cases in optimizing the objective function to save fuel for EDG and supply the critical load. Thus, the demand fulfillment rates were lowered in the daytime with the higher demand and rose at night with the critical load dominant.
The effect of PV and batteries is presented as the slashed area in Fig. 6. In this period, the case only using the EDG was unable to supply any loads, running out of fuel. The demand fulfillment rate for the case equipped with the PV/batteries, though decreasing, was higher than the EDG-only case by saving more fuel. The peaks in the daytime of this period were derived from output from the PV system. As a result, the overall trends of the resilience curves in Fig. 6 are different from the ‘resilience triangle’ shown in Fig. 1, where the system quality falls immediately after the system malfunction and recovers gradually due to restoration.
Taking uncertainty in availability of the components and resources into consideration, risk curves for the two cases previously described were drawn in Fig. 7 to clarify the effect of the PV/batteries on the resilience. While the event tree in Fig. 4 has 19 end-states, some of them that give the same relative lost load are summed up before calculating the annual frequency of exceedance and not plotted in the curves individually. It is found that the annual frequencies of exceedance especially at high relative lost loads are lower with EDG and PV/batteries than with EDG only, indicating that the PV/batteries would help reduce the risk of power outage.
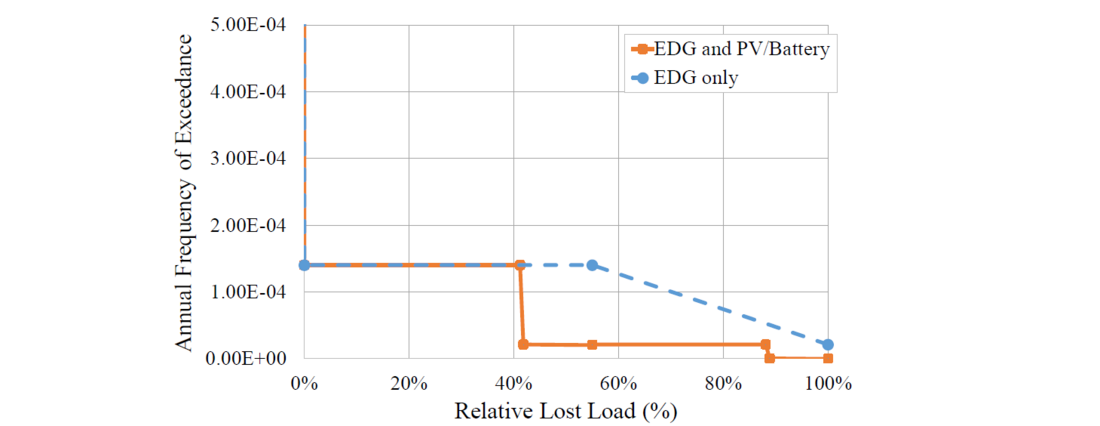
Figure 7 - Risk Curve of Relative Lost Load
Multiplying areas formed by the risk curves by the unit cost of power outage gives expected VoLL in case of earthquakes in a year. In this study, the amount of VoLL was assumed to be ¥ 85,000/kWh, which is derived as the average cost by business use without any alarms before power outage from the survey by Electric Power System Council of Japan conducted in 2013[7]. Table. 2 presents comparison of VoLLs by different DERs, which are converted to the total values for service life of the equipment assumed to be 15 years with the discount rate of 3%, as calculated by Eq. (4)[8].
(4)
𝑉𝑜𝐿𝐿𝑡𝑜𝑡𝑎𝑙: Value of lost load for total service life of equipment (assumed to be 15 years)
𝑉𝑜𝐿𝐿𝑎: Annual value of lost load
𝑟: Discount rate
| Equipment condition | One Year | 15 Years (Equipment Service Life) |
|---|---|---|
| VoLL for No Countermeasures | ¥3,014 k | ¥36.8 million |
| VoLL with EDG | ¥708 k | ¥8.6 million |
| Resilience Value for EDG | ¥2,306 k | ¥28.2 million |
| VoLL with EDG and PV/Batteries | ¥426 k | ¥5.2 million |
| Resilience Value for PV/Batteries | ¥281 k | ¥3.4 million |
While the resilience value, corresponding to the difference in the VoLLs, is lower for PV/batteries than EDG, it would contribute to the total return on investment in the additional DER installation in combination with daily use. Additionally, this low resilience value is based on the low frequency of occurrence for an earthquake, the contribution of resilience values to the total return is expected to increase by including other events that could lead to power outage, such as typhoons, flooding, lightning, heavy snow, traffic accidents and so on. It also highlights the need to determine the variation of VoLLs according to the time, seasonal regional and consumer type to improve accuracy of the results.
4. Conclusions
In this study, the process to evaluate resilience values of DERs was constructed, including five sub-steps. Due to uncertainty in occurrence of power outage, optimization of load restraint was combined with probabilistic risk assessment to determine expected values of lost load by the risk curve. The resilience value in case of earthquakes for a five-story building was evaluated as a simple case study. The results showed that resilience values for the total service life of the equipment would be higher if PV/batteries were installed in addition to the current emergency diesel generator, indicating that the evaluation process calculated the resilience value of DERs properly. The application of the evaluation process will be extended to other events leading to power outage as well as to complex facilities with multiple buildings and DERs connected with each other.
References
- Final Report of the Verification Committee on the Large-Scale Power Outage Caused by the Earthquake in Eastern-Iburi, Hokkaido 2018, Organizaion for Cross-regional Coodination of Transmission Operators, 2018. (in Japanese)
- Final Report of the Verification Committee on the Response to the 15th Typhoon in 2019, Tokyo Electric Power Company Holdings, 2019. (in Japanese)
- Bruneau et al., A Framework to Quantitatively Assess and Enhance the Seismic Resilience of Communities, Earthquake Spectra, 2003.
- AIJ Recommendations for Loads on Buildings, Architectural Institute of Japan, 2015.
- Yoshida et al., Study on seismic risk of telecommunication facilities, AIJ J. Technol. Des., No. 12, pp.65-68, 2001. (in Japanese)
- Characteristics of Accidents at Solar Power Generation Facilities in This Summer, Ministry of Economy, Trade and Industries, 2018. (in Japanese)
- Technical Scrutiny of Power Outage Costs, the 4th Subcommittee for Power System Resilience, Organizaion for Cross-regional Coodination of Transmission Operators, 2019. (in Japanese)
- Nagao et al., Proposal of an Optimization Method for Installing Co-Generation Equipment Considering Business Continuity Planning Under Disaster Cases, J. Japan Society of Energy and Resources, Vol. 38, No.4, pp.10-23, 2017. (in Japanese)