Short term forecasting peak load hours of regional power systems using machine learning methods
Authors
V. VORONIN - T.F. Gorbachev Kuzbass State Technical University, Russia
F. NEPSHA - "RTSoft - Smart Grid" LLC, T.F. Gorbachev Kuzbass State Technical University, Russia
M. KRASILNIKOV - "RTSoft - Smart Grid" LLC, Russia

Summary
The study aims to address the challenge of predicting peak load hours for regions in Russia that are part of the unified energy system and are subject to capacity charges in the retail electricity market. The significance of this topic is due to the increasing implementation of various mechanisms for demand-side management, and the need for accurate forecasting of future electricity costs for enterprises in the short term and medium-term forecasting horizons. The research in this paper involves analysis of the distribution of peak load hours by time of day over a period of 4.5 years, conducting a cluster analysis and examining the effect of the economic activity of the regions on peak load hours. A proposed approach for developing a forecasting model for peak hours is presented, which includes the selection of an optimal machine learning method and a set of relevant features. The accuracy of the forecast model is evaluated using data from 57 regions in Russia.
keywords
Peak Load Hours - Forecasting - Machine Learning - Russian Power System1. Introduction
The growing prevalence of distributed generation and battery energy storage systems (BESS) has made it possible to implement various demand-side management (DSM) mechanisms. As the cost of these systems continues to decrease, they are becoming more attractive investments for electricity consumers. According to IRENA [1] and NREL, the global weighted average levelized cost of electricity decreased by 13% (for new utility-scale solar PV projects) and by 9-13 % (for residential PV) in 2021 compared to 2020, which is driving the uptake of rooftop PV in private homes and office buildings. In EU countries, the share of solar generation from rooftop PV already exceeds 50% [2]. The cost of energy storage systems is also decreasing; by 2030, the cost of BESS is expected to decrease by 28-58% compared to 2020 [3].
As a result, BESS has become an attractive DSM tool, particularly in combination with distributed generation using renewable energy sources (RES) when peak generation does not align with peak consumption. The high flexibility and characteristics of BESS allows them to effectively reduce power consumption from the grid during peak hours. For example, in [4] it is shown that the use of BESS in conjunction with a PV system can reduce electricity costs by up to 41%. Other DSM strategies include redistributing load by time of day, using own generation, etc. In [5], it is demonstrated that shifting power consumption of an industrial enterprise from periods of peak load can reduce electricity payments by up to 42-63%. Estimates in [6] suggest that the average cost savings on electricity consumption with the use of DSM for industrial enterprises can be around 20%.
In an environment characterized by high volatility in energy prices, intelligent energy management can provide significant economic benefits for industrial enterprises. However, planning for such events is not a straightforward task and requires forecasting of both electricity consumption and costs.
2. Formulation of the problem
In the Russian Federation, participants in the wholesale market and participants in the retail electricity market with a capacity of power receiving installations greater than 670 kW pay separately for:
- Electricity at a two-part tariff (price category 3-6), which includes tariffs for electricity and capacity. The billable capacity is referred to as "generator" capacity and is defined as the average monthly maximum hourly consumption during peak load hours (PLH).
- Services for the transmission of electrical energy at a one-rate (3 and 5 price category) or two-rate tariff (4 and 6 price category). The billable capacity is referred to as "grid capacity" and is defined as the average monthly maximum hourly demand for planned peak load hours (PPLH). PPLH are determined by the system operator and represent 9 to 13 hour intervals of the day during which peak load is predicted.
The payment for generating capacity can be from 20 to 40% of the final cost of electricity and the period of time during which the amount of capacity payable is fixed and occurs during each working day and lasts only one hour - about 3% of the total time of the year (see Fig. 1). PLH is not related to the consumption mode of a particular facility and is determined by the total electricity consumption of the region of the Russian Federation in which the consumer is located. The specific time of the peak load hour is determined by the commercial operator of the wholesale market, Trading System Administrator, and is published 10 days after the end of the reporting month.
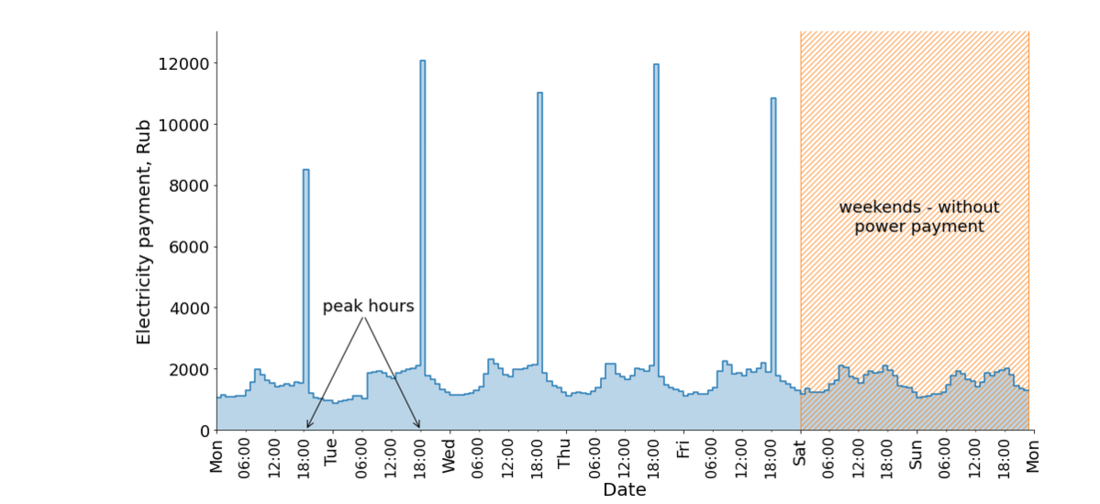
Figure 1 - Indicative weekly electricity price profile
Calculation of payment for "generator" power is carried out according to the formulas:
where is the capacity tariff (rubles/MW per month);
- the amount of power to be paid, MW.
where i is the working day of the settlement month; k - the number of working days of the billing month, calculated by the number of actual PLH values; – power consumption at peak load hour, MW.
Thus, the consumer of electrical energy, in the presence of a forecast of the onset of PLH with a subsequent coordinated reduction in electricity consumption, can significantly reduce the cost of purchasing electricity.
There are two main approaches to predict PLH:
- Forecasting with regression models. This approach involves forecasting the hourly power consumption profiles of the region and determining PLH as the hour of maximum daily consumption. To use this method, it is necessary to have access to regularly updated data on the daily load profiles of the regional power system, which will characterize with a high degree of accuracy the billable PLH.
- Forecasting with classifiers. This approach involves predicting the likelihood of a peak hour feature for a range of possible PLHs. This method is simpler than regression models because it works with much less data and does not require hourly power consumption profiles.
The authors of [7] considered PLH forecasting in the Yaroslavl region using an artificial neural network to build a regression forecast model, achieving a forecast accuracy of 50% when predicting one hour and 75% when predicting a two-hour interval. In [8], the PLH forecast was made using the Random Forest and the Gradient Boosting ML algorithms using the Duke Energy Progress system as an example, with a recall of up to 93.1%.
Forecasting peak hours is important for planning and managing the operating modes of the power system, as well as for tariff regulation, for example, to determine the cost of charging electric vehicles. In addition to the choice of approach and method of forecasting, it is important to determine relevant features. For example, in [7] calendar features such as the hour of the day, day of the month, and day of the week, as well as total power consumption of the region, were used. In [8], the most important features for forecasting PLH model included the rank of load forecast for the hour. In [9], important predictors of electricity tariffs included lagged electricity prices and load, different power station scheduled generation, and the index of the month. In [10], prices for main energy carriers such as gas, coal, and oil were also taken into account. Weather conditions are also often included as important predictors of electricity consumption. Research such as [11] and [12] indicate the relationship between power consumption forecast and air temperature, humidity and other meteorological parameters. Thus, when building a PLH forecasting model, it is advisable to consider calendar, meteorological, and power system features.
3. Analysis of the peak load hours
The current study analyzes peak loads of 57 regions of Russia using data from the website of ATS (Russian commercial operator) for electricity supply companies of the regions for the period from 01.01.2016 to 07.01.2020.
An analysis of the distribution of peak hours by time of day revealed that 48.90% of PLH occur in the evening, specifically in the interval from 4:00 PM to 11:00 PM local time (most often in the 21st - 13.9%, 19th - 13.7% and 20th hour - 10.9%). In the morning, in the interval from 7:00 AM to 11:00 AM, PLH occurred in 35.48% of cases (most commonly in the 10th hour - 17.3% and the 11th hour - 16.9%). PLH during daytime hours are observed relatively rarely (15.63% of cases).
The distribution of PLH is seasonal (as shown in Fig. 2), with morning and evening peaks (10th, 19th, 20th, 21st hours) prevailing in the winter and spring months, while in the summer months morning peaks (11th hour) are observed more frequently and the share of PLH also increases significantly during daytime hours (14th, 15th hour). In autumn, evening peaks (19th, 20th hour) prevail. The seasonality of the distribution of PLH by time of day can be associated with the operation of ventilation and air conditioning systems, which explains the presence of daytime peaks in summer during daytime hours when air temperatures are highest.
No dependence of PLH on the day of the week was found (it should be noted that PLH are only set on weekdays).
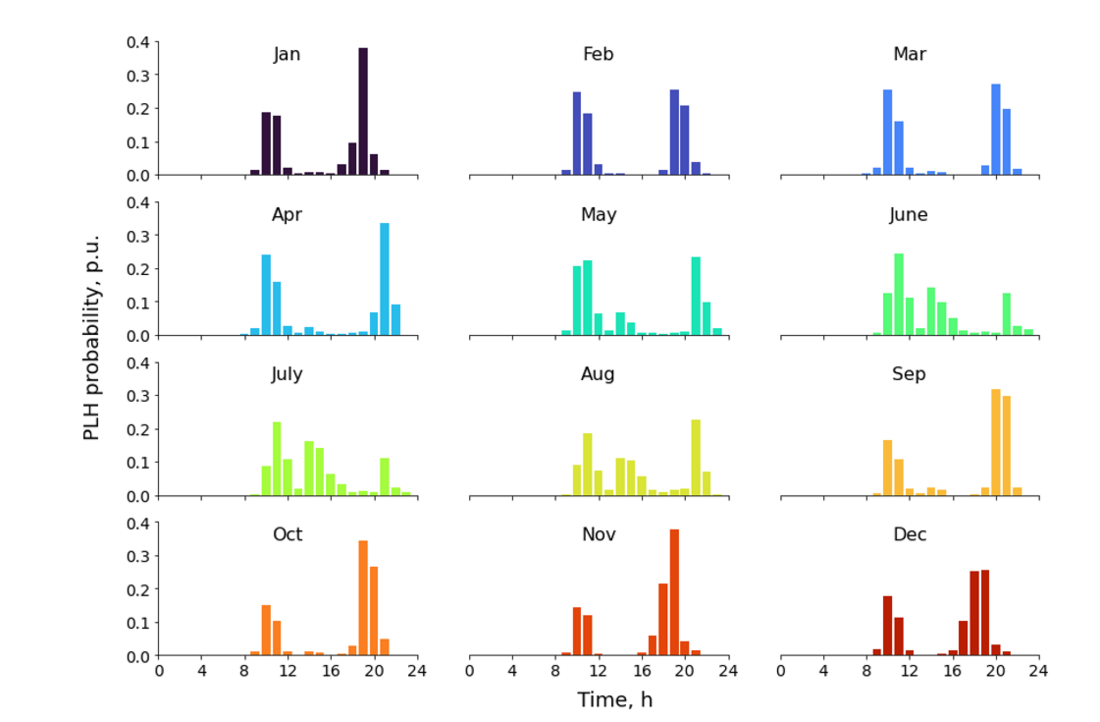
Figure 2 - Distribution of PLH by months of the year
The distribution of PLH by hours of the day varies significantly among different regions of the Russian Federation. Using clustering of the data array, 4 clusters were identified. On Fig. 3 shows a ridge plot for the regions under consideration. Each graph shows a histogram of PLH frequencies (the Y-axis represents the relative frequency of PLH observations for a given hour of the day, and the X-axis represents the hours of the day). Regions belonging to the same cluster are highlighted with the same label color. The clustering was done using the k-means method from the scikit-learn library. The following is a description of each cluster, indicating the percentage distribution of peaks by day in the morning/afternoon/evening format:
- cluster 1 - morning peak (10th, 11th hour): 78.73% / 12.18% / 9.09%;
- cluster 2 - predominantly morning peak (11th, 10th hour): 51.02% / 20.56% / 28.41%;
- cluster 3 - mainly evening peak (19th, 21st hour): 18.12% / 17.69% / 64.19%;
- cluster 4 – evening peak (21st, 19th hours): 1.07% / 6.27% / 92.65%.
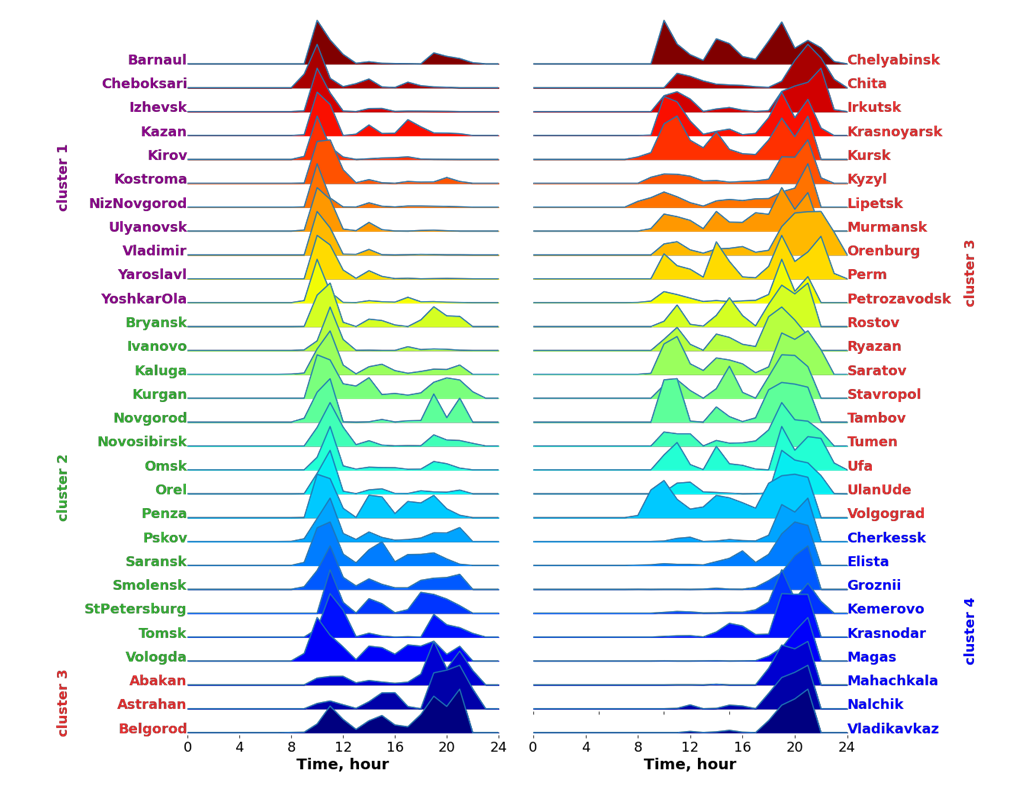
Figure 3 - Histograms of PLH frequencies of Russian regions by time of day
On Figure 4 shows the averaged normalized daily load profiles of the clusters. The size of the marker on the power consumption curves indicates the probability of observing PLH in a given hour. In general, the hourly load profiles of the regions correspond to the PLH frequency histograms shown in Fig. 3. Clusters 1 and 2 have similar load profiles with a predominance of morning maxima, but cluster 2 has a slightly lower load in the morning and a larger load in the evening. Clusters 3 and 4 also have similar load profiles with a predominance of the evening maximum, but cluster 3 is characterized by a significantly higher load in the morning hours than cluster 4.
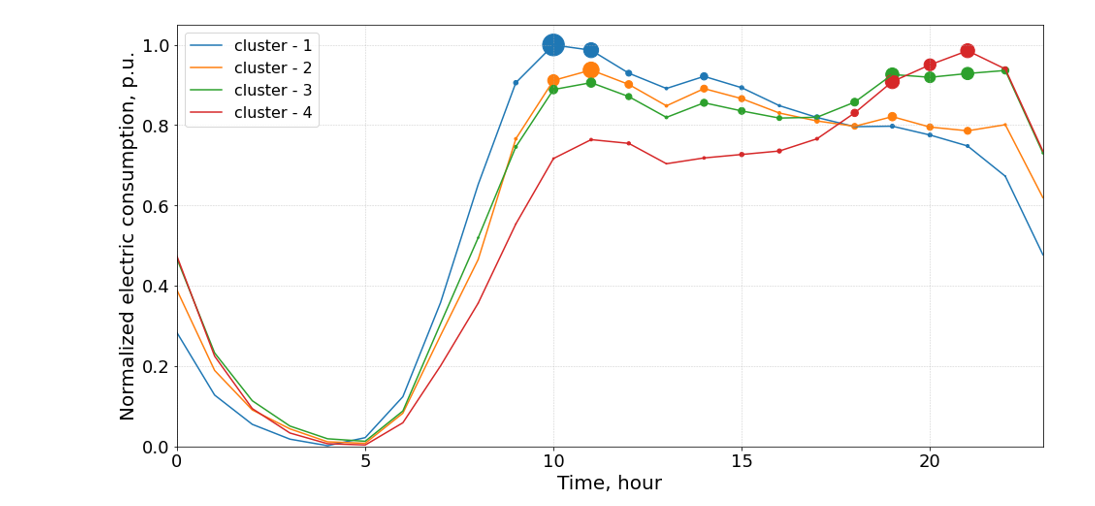
Figure 4 - Average daily load profiles of clusters
Using the data of state statistics on the annual electricity consumption of the regions of the Russian Federation by type of economic activity, it was found that clusters 1 and 2 are quite similar to each other with a predominance of household electricity consumption. Cluster 3 is characterized by a high share of electricity consumption by the industrial sector (mining, manufacturing), and cluster 4 also has a high share of household electricity consumption. The results of the analysis are shown in Fig. 5. However, the presented data is not enough to make an unambiguous conclusion about the impact of a particular sector of the economy on the nature of the distribution of PLH, because this analysis is made on physical consumption in a certain area of the grid and not on commercial transactions. ATS sets the PLH separately for the groups of supply points of distribution companies based on their power consumption profiles. However, large electricity consumers can work directly on the wholesale market, and then their load will not be taken into account in the corresponding groups of supply points and affect PLH.
Nevertheless, among all the regions considered, a correlation (R = 0.3…0.35) was revealed between the distribution of PLH by day zones and the share of domestic and industrial consumption in the region (an increase in the share of industrial consumption leads to a wider distribution of PLH by hours of the day, mainly by daylight hours).
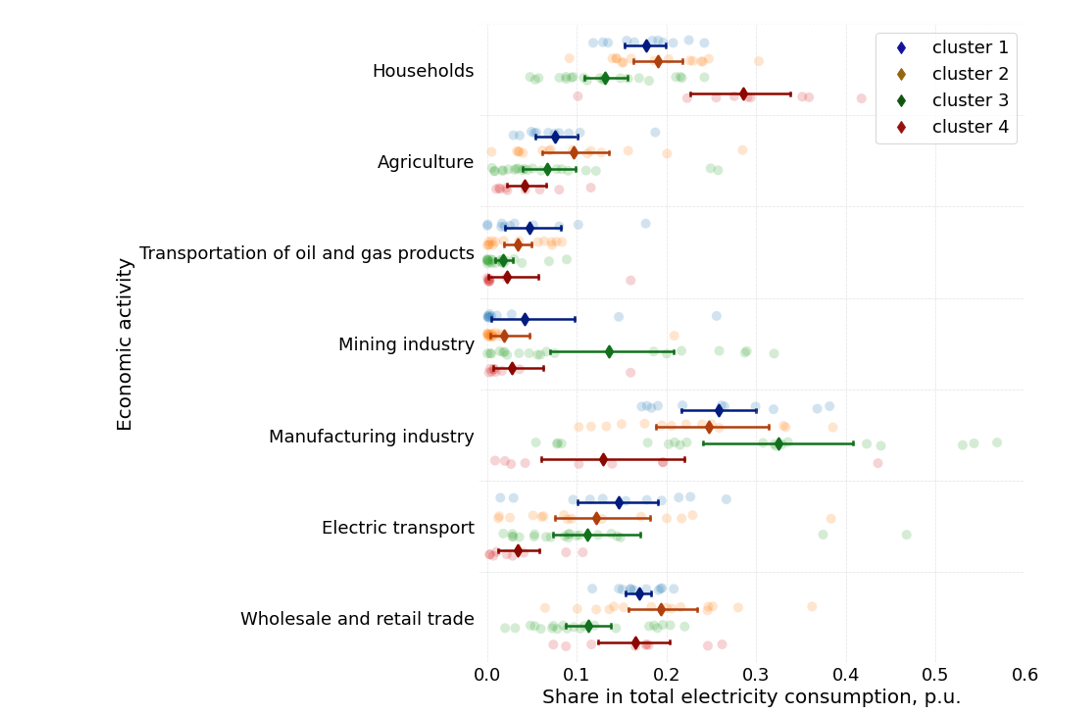
Figure 5 - Share of electricity consumption in regions by type of economic activity
The following information from open sources can be used to predict PLH (as shown in Fig. 6):
- the total actual consumption of electrical energy in the region of the Russian Federation (posted on the website of "ATS" every month);
- actual and planned power consumption by constituent entities of the Russian Federation (posted on the website of the balancing market (BR) in real time, the forecast is available for the coming day).
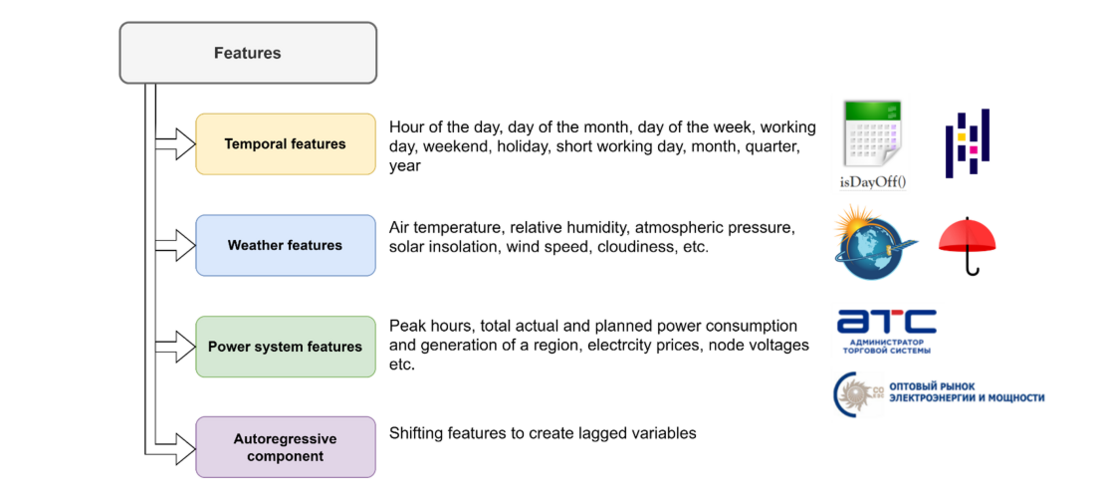
Figure 6 - Determination of predictors for the predictive model
It should be noted that peak load hours (PLH) are determined by ATS, not by the region of the Russian Federation. The best predictor of PLH would be planned power consumption by groups of supply points, but unfortunately this data is not publicly available. The actual consumption of the constituent entities of the Russian Federation, as reported by ATS, can provide a fairly accurate estimate of PLH for most regions, with an average accuracy of 84.4% and a range of 8.4% to 100%. The accuracy of this estimate is influenced by the number of groups of supply points in the region, as well as the share of consumers operating directly in the wholesale electricity market. However, these data are only published once a month, which limits the forecasting horizon to 720-744 hours and negatively impacts the accuracy of the forecast. The BR website provides real-time updates on hourly total electricity consumption for the constituent entities of the Russian Federation and a forecast for the coming day, but the data on this website does not match the data from ATS. The accuracy of determining PLH using the BR website is only 7% on average, and PLH is included in the three busiest hours with a probability of only 40.5%.

From the analysis of Figure 3, it can be inferred that for certain regions (clusters 1 and 4), PLH takes on a limited set of values, and therefore, a classifier based on simple rules can be used to predict PLH. Using a dummy classifier that always predicts the same set of most frequently observed hours as PLH, an average prediction accuracy of 32.7% to 67.4% can be obtained when predicting a three-hour interval. The accuracy of the dummy classifier is expected to vary across clusters, with the highest values observed in clusters 1 and 4, where morning and evening peaks are observed (86% and 83% accuracy for a three-hour interval, respectively), and the lowest values in clusters 2 and 3, where PLH are observed throughout the day (66% and 53% accuracy for a three-hour interval, respectively). Additionally, for some regions within clusters 1 and 4, the accuracy of a three-hour forecast can exceed 90%. The results of the distribution of accuracy for determining PLH using hourly profiles of electricity consumption in regions, according to the "ATS" and BR websites, as well as the dummy classifier, are displayed in Figure 7. Given that the planned power consumption of regions according to BR data poorly characterizes PLH, and the regional power consumption from ATS is only published monthly and does not always allow for sufficient accuracy in determining PLH, it is recommended to use classifiers for direct forecasting of PLH. The task then becomes to select the optimal method and set of features to achieve a prediction accuracy higher than that of the baseline solution based on the dummy classifier.
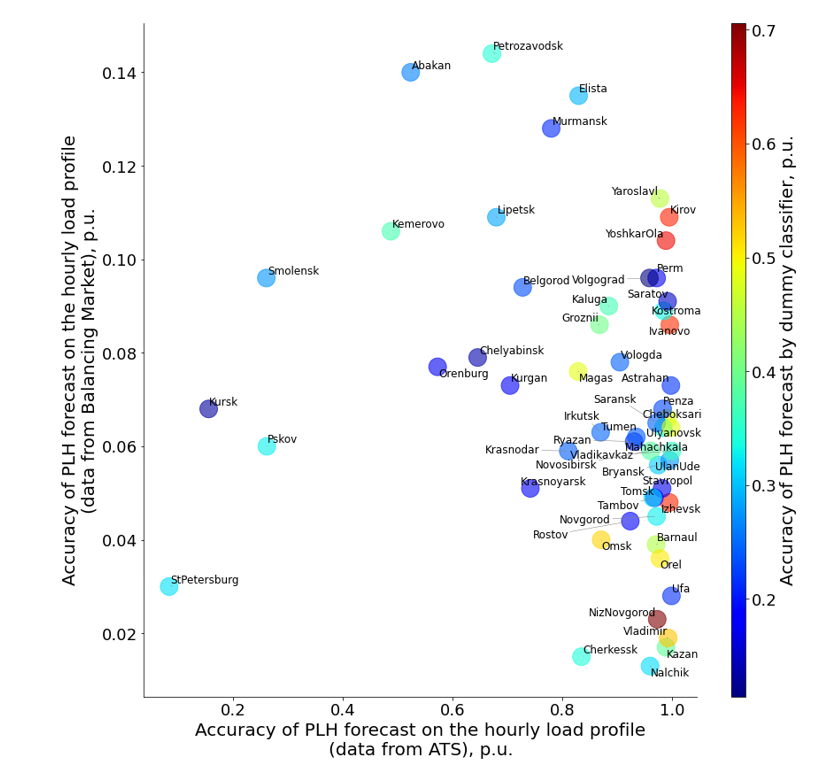
Figure 7 - Scatterplot of the accuracy of PLH estimation using regional power consumption profiles obtained from open sources
4. Methodology
The research paper includes building a predictive model using multiclass classification methods from the scikit-learn and xgboost libraries, including Random Forest Classifier (RFC), Decision Tree Classifier (DTC), KNeighbors Classifier (KNN), Extra Trees Classifier (ETC) and MLP Classifier (MLP). The predictable feature used is the PLH value obtained from the website of JSC ATS. Additional predictors, listed in Table I, were also used, including calendar features obtained using the isDayOff() library and meteorological data obtained using the NASA POWER API. The results of a correlation analysis of the features under consideration are shown in Figure 8.
| № | Features |
|---|---|
| Calendar features | |
Day of the year | |
| Month | |
| Quarter | |
| Day of the week | |
| Working day | |
| Non-working day | |
| Shortened working day | |
| Holiday | |
| Meteorological features | |
| Air temperature (maximum, average, minimum) | |
| Wind speed (maximum, average, minimum) | |
| Atmospheric pressure (maximum, average, minimum) | |
| Humidity (maximum, average, minimum) | |
| Cloudiness | |
| Cloudiness during the day | |
| Aerosol Optical Thickness | |
| Clear sky insolation clearness index | |
| Power system feature | |
| Hourly forecast of regional electricity consumption for the current day based on the data from the BR website | |
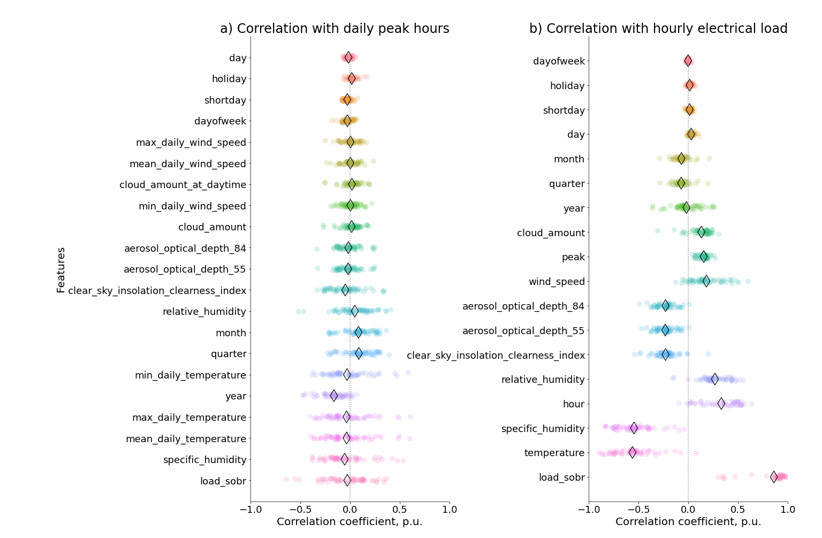
Figure 8 - Correlation of the main predictors with PLH (a) and with hourly power consumption profiles (b)
As shown in Figure 8, the correlation coefficients have a significant spread across regions. The average level of correlation between predictors and PLH is insignificant, however, in some regions, the month of the year, quarter, year, electrical load according to the BR data, as well as air temperature and humidity can have quite high values of both negative and positive correlation coefficients. Hourly power consumption profiles have a more pronounced correlation with external factors (Figure 8, b). The most significant predictors are the forecast of electricity consumption according to the BR website (load_sobr), temperature (temperature), humidity (specific_humidity, relative_humidity) and hour of the day (hour).
The pipeline of the forecast model development process is presented in Fig. 9. After loading the dataset, its pre-processing is performed, during which the completeness of the loaded data is evaluated, the timestamp formats are converted, a general dataset with a predicted value and a set of features is formed, a cyclic transformation is performed for a number of features. The generated dataset is divided into training, validation and test samples in the proportion: 0.22 / 0.22 / 0.55 (1 year / 1 year / 2.5 years). To select the optimal set of features, forward and backward sequential feature selection methods are used. Hyperparameter tuning is performed using the Random Search method. Model performance evaluation is performed on the basis of an assessment of the accuracy of the actual PLH hitting the predicted one-, two- and three-hour interval of the most probable PLHs. At the final stage, a comparative analysis of various forecasting methods is performed.
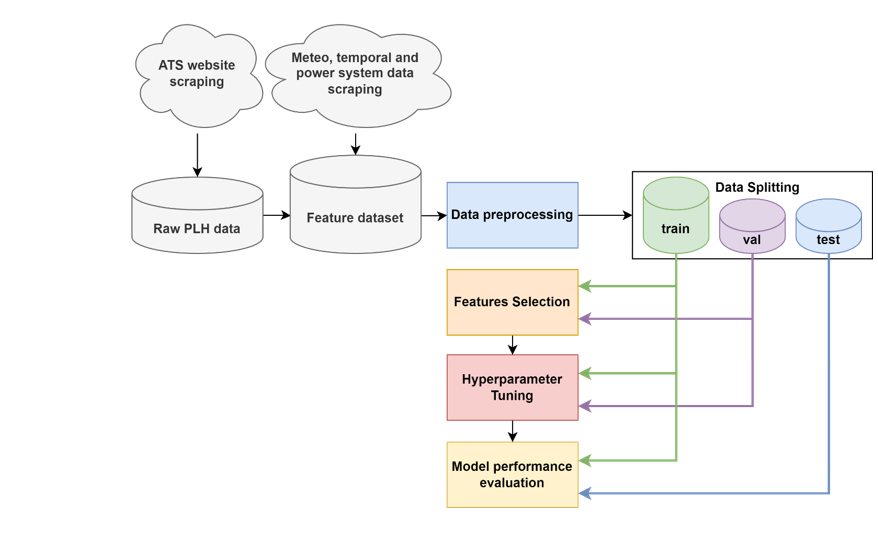
Figure 9 - PLH forecasting pipeline
5. Results
The probability density of the peak load hour (PLH) forecasting accuracy over a three-hour interval for all considered regions obtained using various forecasting methods is shown in Figure 10. The utilization of machine learning techniques improves the accuracy of PLH prediction by approximately 65% in comparison to a basic dummy model. The highest accuracy was achieved using the Extra Trees Classifier method. The overall average accuracy for a one-hour forecast was 54.1 ± 14.4%, and for a three-hour forecast it was 84.4 ± 10.3%. Other examined machine learning methods produced similar results. Figure 11 displays the results of applying the Extra Trees Classifier method to predict PLH for all regions.
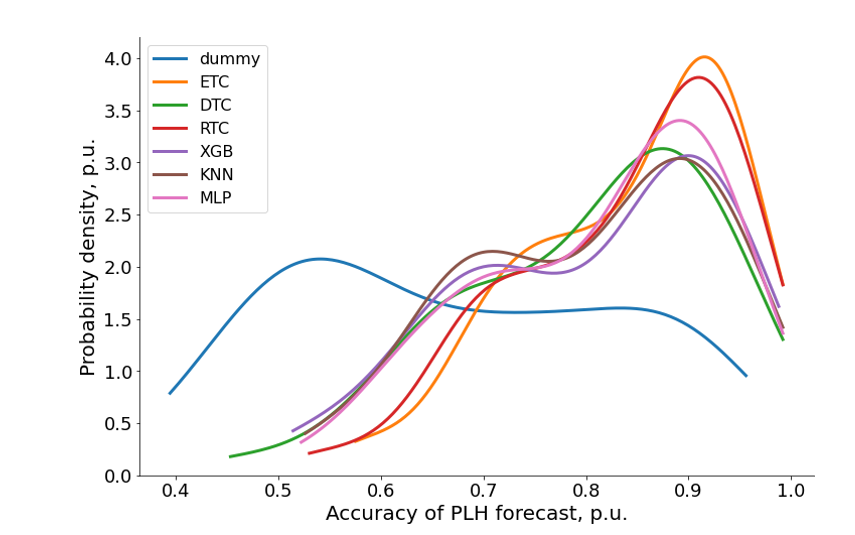
Figure 10 - Kde plot of three hour period PLH forecasting by different algorithms
The results obtained vary considerably by region. The regions in clusters 2 and 3, where PLH are observed in all zones of the day, have the poorest results. The best results were obtained for regions in clusters 1 and 4, where the accuracy of predicting a three-hour interval exceeds 90%.
For the majority of regions, according to the results of Feature Selection, the following features were selected: day, month, shortday. However, according to the results of the calculation, it turned out that the use of only a set of calendar features (excluding power system features and weather forecast) does not lead to a significant decrease in forecasting accuracy (change in average accuracy is not more than 1%). Then, when using only calendar features, the PLH forecasting horizon is not limited, which is an advantage of the developed model.
PLH forecasting errors are most commonly observed in the summer months (Figure 12), which is likely due to the presence of daily peaks in power consumption that are not typical of other seasons.
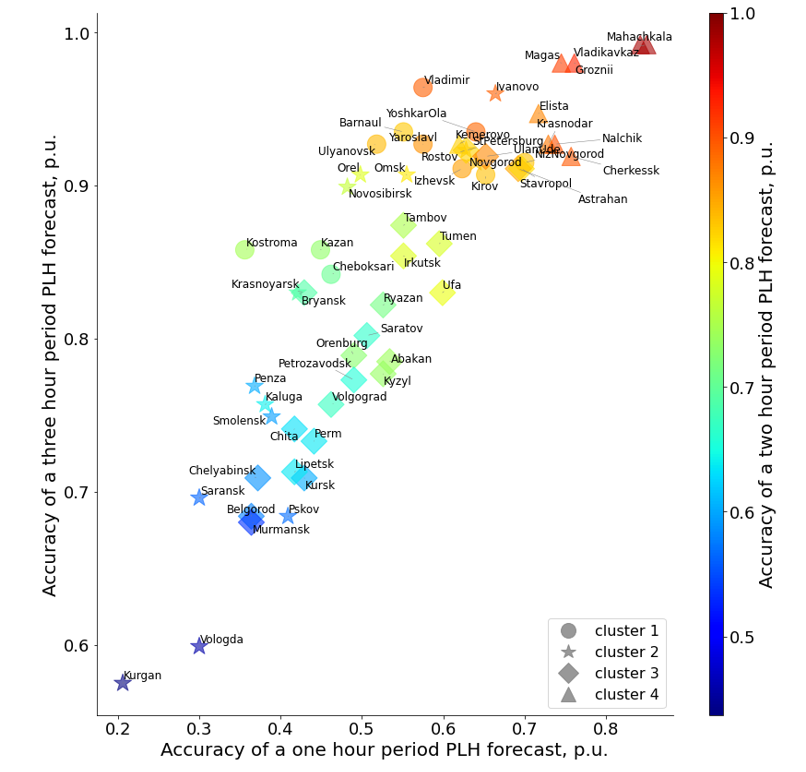
Figure 11 - Scatterplot of PLH forecast accuracy by regions of the Russian Federation
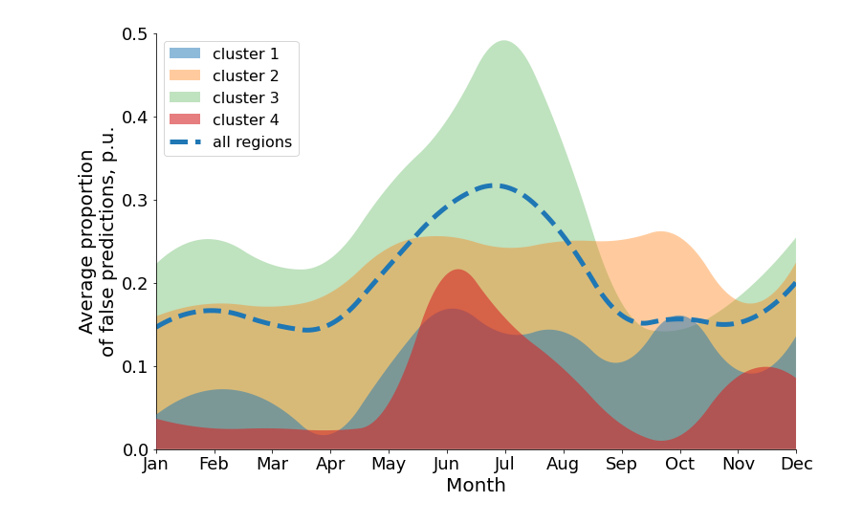
Figure 12 - Distribution of forecasting errors by months
As can be seen from the results obtained, for a number of regions in the Russian Federation, the set of features used does not allow for high forecasting accuracy. Regions with low forecast accuracy are characterized by a relatively small share of household power consumption and a high influence of industrial load on daily power consumption profiles, the nature of which is determined by the technological process of enterprises and is little affected by external factors. Under these conditions, an increase in forecast accuracy can be achieved by using planned power consumption by groups of supply points, which are currently not publicly available.
6. Discussion
In terms of implementation, the developed models for PLH forecasting should be utilized as a peak hour forecasting cloud service, which can provide data on peak hour forecasts by subscription for a small fee. The data can be received in two formats:
- Through the GUI of the cloud service or through instant messaging apps (WhatsApp, Telegram) which is suitable for industrial enterprises that can use the information to plan the utilization of production capacities for a short and middle term forecasting horizon.
- In the form of JSON upon request via the REST API (Figure 13) within the Energy management system (EMS). In this case, the values of the PLH occurrence probabilities will be used in determining control actions in relation to the controlled load, distributed generation, and electric energy storage systems.
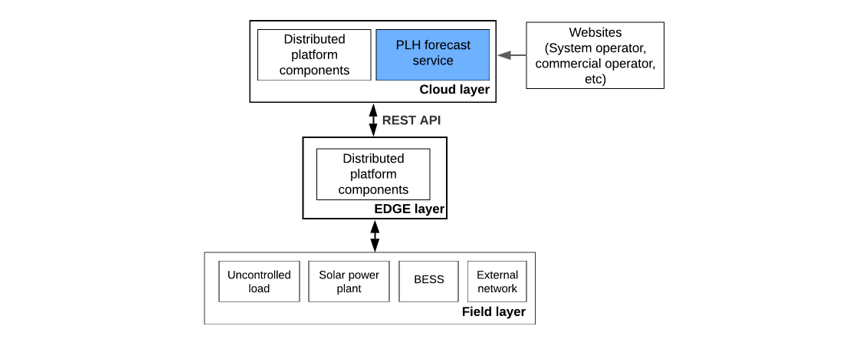
Figure 13 - EMS architecture with PLH prediction service
It should be noticed that PLH forecasting service is a perfect fit for the platform ecosystem for distributed energy [13], [14].
7. Conclusion
In this paper, the problem of short term forecasting peak load hours (PLH) is studied using data from 57 regions in Russia. The research found that the profiles of daily power consumption and the hours of peak loads vary significantly between regions. The forecast results showed that, when using three-hour intervals, the average accuracy of PLH prediction is 84.4% (with a range from 57.5% to 99.2% by region).
In conclusion, the results obtained in this study can be used in planning measures for managing the power consumption by companies that pay for electricity in the retail market, particularly for developing charge/discharge control algorithms for electricity storage devices.
Acknowledgments
The research was supported by the state assignment of Ministry of Science and Higher Education of the Russian Federation (№ 075-03-2021-138/3).
References
- "IRENA, Renewable Power Generation Costs in 2021.” International Renewable Energy Agency, Abu Dhabi, 2022. Accessed: Jul. 28, 2022. [Online].
- M. A. Brown, J. Hubbs, V. Xinyi Gu, and M.-K. Cha, “Rooftop solar for all: Closing the gap between the technically possible and the achievable,” Energy Research & Social Science, vol. 80, p. 102203, Oct. 2021, doi: 10.1016/j.erss.2021.102203.
- C. Wesley, F. Will, and A. Chad, “National Renewable Energy Laboratory, Cost Projections for Utility-Scale Battery Storage: 2021 Update.” Golden, CO: National Renewable Energy Laboratory, 2021.
- R. Khezri, A. Mahmoudi, and M. H. Haque, “Optimal Capacity of Solar PV and Battery Storage for Australian Grid-Connected Households,” IEEE Transactions on Industry Applications, vol. 56, no. 5, pp. 5319–5329, Sep. 2020, doi: 10.1109/TIA.2020.2998668.
- Dziuba A.P. and Solovieva I.A., “Price-dependent electricity consumption as a tool for managing the risks of non-payment for industrial enterprises' electricity,” Strategic Decisions and Risk Management, vol. 10, no. 1, Art. no. 1, 2019.
- I. A. Solovieva, “Economic efficiency of price-dependent cost management for electricity consumption at industrial enterprises,” Vectors of well-being: economics and society, no. 3 (26), Art. no. 3 (26), 2017.
- O. Yu. Maryasin and A. I. Lukashov, “Analyzing and Forecasting Peak Load Hours,” in 2021 International Conference on Industrial Engineering, Applications and Manufacturing (ICIEAM), 2021, pp. 25–30. doi: 10.1109/ICIEAM51226.2021.9446369.
- T. Fu, H. Zhou, X. Ma, Z. J. Hou, and D. Wu, “Predicting Peak Day and Peak Hour of Electricity Demand with Ensemble Machine Learning.” arXiv, Mar. 25, 2022. doi: 10.48550/arXiv.2203.13886.
- L. Visser, T. AlSkaif, and W. van Sark, “The Importance of Predictor Variables and Feature Selection in Day-ahead Electricity Price Forecasting,” in 2020 International Conference on Smart Energy Systems and Technologies (SEST), Sep. 2020, pp. 1–6. doi: 10.1109/SEST48500.2020.9203273.
- A. Mohamed and M. E. El-Hawary, “Effective input features selection for electricity price forecasting,” in 2016 IEEE Canadian Conference on Electrical and Computer Engineering (CCECE), 2016, pp. 1–5. doi: 10.1109/CCECE.2016.7726626.
- D. Burillo, M. V. Chester, S. Pincetl, E. D. Fournier, and J. Reyna, “Forecasting peak electricity demand for Los Angeles considering higher air temperatures due to climate change,” Applied Energy, vol. 236, pp. 1–9, Feb. 2019, doi: 10.1016/j.apenergy.2018.11.039.
- G.-F. Fan, L.-Z. Zhang, M. Yu, W.-C. Hong, and S.-Q. Dong, “Applications of random forest in multivariable response surface for short-term load forecasting,” International Journal of Electrical Power & Energy Systems, vol. 139, p. 108073, Jul. 2022, doi: 10.1016/j.ijepes.2022.108073.
- S. P. Kovalyov and A. A. Nebera, “A Platform-Based Approach to Implementation of Future Smart Distributed Energy Control Systems,” in 2020 2nd International Conference on Control Systems, Mathematical Modeling, Automation and Energy Efficiency (SUMMA), Nov. 2020, pp. 608–613. doi: 10.1109/SUMMA50634.2020.9280709.
- N. G. Shubin, K. A. Krasilnikov, M. I. Krasilnikov, and F. S. Nepsha, “Simulation of an applied microgrid control system based on a digital platform,” in 2020 Ural Smart Energy Conference (USEC), Nov. 2020, pp. 126–129. doi: 10.1109/USEC50097.2020.9281226.
Biographies
Vyacheslav Voronin is currently a senior researcher at .T.F. Gorbachev Kuzbass State Technical University. He received the Specialist degree and the Ph.D. degree in electrical engineering from Kuzbass State Technical University, in 2014 and 2022, respectively. His current research interests include smart grids, machine learning, power supply system modeling and simulation, electric vehicles.
Fedor Nepsha is currently a leading specialist at "RTSoft - Smart Grid" LLC, Russia. He received the Specialist degree and the Ph.D. degree in electrical engineering from Kuzbass State Technical University, in 2012 and 2018, respectively. In 2022 he became the regular member of SC D2 CIGRE from Russian Federation. His current research interests include smart grids, ontological modeling, machine learning, power system modeling and simulation.
Mikhail Krasilnikov is currently a software developer at "RTSoft - Smart Grid" LLC, Russia. He received the M.S. degree in electrical engineering from the University of New South Wales in 2020. His research interests include grid integration of renewable energy, renewable energy system modeling and analysis.