Weak Grid Analysis for Interconnecting Inverter-Based Generation – Ireland Case Study
Authors
G. MISYRIS, D. RAMASUBRAMANIAN - Electric Power Research Institute (EPRI), USA
M. VAL ESCUDERO, T. KËRÇI, S. MURRAY - EirGrid, Ireland

Summary
This paper investigates the dynamic behaviour of new generic positive sequence models developed at EPRI to provide an observability of potential controller interactions of inverter-base resources (IBRs) that may occur in low short circuit networks. A comparison between the new generic positive sequence models and present state-of-the-art generic models is performed. The ability of the proposed positive sequence model to capture oscillations associated with fast inner control loops is demonstrated. A sensitivity analysis with respect to IBR controllers is also performed to identify their corresponding impact on the IBR dynamic response. Further, if the oscillations are observable, then recommendations on pre-emptive mitigation and analysis techniques are proposed.
Moreover, a two-step framework for weak grid analysis is presented and applied to a system with high concentration of inverter-based resources. The objective of the study is to identify IBR plants that may potentially be susceptible to controller instability due to weak grid conditions. In the first stage of screening, an advanced system strength assessment metric is proposed and calculated. Then dynamic stability simulations are performed using a new detailed positive-sequence IBR model developed at EPRI that includes representation of the controls that are associated with weak grid instability.
The outcome of this paper can benefit society by possibly improving grid reliability as the grid is transitioning to more IBRs in the coming years. For the analyses carried out in this paper, a scenario for a future year of the transmission network in Ireland is considered.
keywords
IBR - renewable energy - REGC_C converter model, weak grid1. Introduction
To enable the decarbonation of the energy sector, inverter-based resources (IBRs) progressively replace fossil fuel powered plants. As part of this goal, governments’ objectives mandate 80% renewable electricity by 2030 in Ireland and net zero carbon emissions by 2050 in Northern Ireland [1]-[4]. To reach these objectives, it is inevitable to integrate renewable energy sources in remote areas of the grid and retire most conventional power plants. This will have a negative effect on the system strength both due to the limited availability of short circuit current and the absence of system inertia. To address these challenges, it is necessary for system planners to use metrics and tools that help identifying potential stability risks in operating systems with low system strength.
System strength has been assessed through short circuit metrics, e.g., short-circuit ratio (SCR), that consider the components that are connected to the system, the network configuration and the static short-circuit analysis results. These metrics allow for fast screening and identification of critical locations for interconnecting IBRs. For these IBRs, time domain analysis is required for evaluating their impact on the system stability.
Positive sequence simulation tools and models can be used to assess the system security quickly, to observe the control performance of IBRs and to identify potential instabilities. Although, they are useful and convenient for simulation the bulk power system, positive sequence simulation tools do have many limitations [5]-[8]. This is because IBRs are asynchronously connected to the grid through a power electronics interface and require a strong grid for synchronization. Most of the control systems of those IBRs rely on the voltage magnitude and angle at their terminals to largely be unaffected by its current injection for stable operation. However, in low short circuit networks, the sensitivity of the IBR’s terminal voltage to variations of current injections becomes higher. This can result in IBR controllers having adverse reactions that could affect system stability. From a transmission planning perspective, observability of these controller interactions in simulation models is crucial for reliable planning of the system.
Present state-of-the-art positive sequence dynamic models for IBRs may have limitations in representing some of these controller interactions. This is because state-of the art positive sequence models have a less accurate representation of the fast inner current control loop of the IBR. This simplified representation of the fast inner current control loops can be restrictive when analysing the potential impact of an IBR installation on the system stability. Another limitation is that present state-of-the-art positive sequence converter models treat the IBRs as pure current sources, which can lead to numerical instabilities. This arises because of the way network lines and components are represented in positive sequence environments [9]-[12].
The scope of this paper is to present recent modifications proposed by EPRI to the state-of-the-art positive sequence generic IBR model. With the proposed modifications, positive sequence IBR models can capture small-signal and large-signal oscillatory instabilities, as well as improve the numerical stability of an IBR model.
This paper aims to increase confidence in the proposed positive sequence renewable energy generator/converter model – REGC_C and demonstrate its ability to allow a transmission planner to have observability issues that may arise in future low short circuit networks. A comparison between the new generic positive sequence developed by EPRI and present state-of-the-art generic models is performed. Moreover, a two-step framework for weak grid analysis is proposed that is based on combination of available tools and can help system operators to perform dynamic security assessment in an accurate and fast manner. For the analyses, a scenario for a future year of the EirGrid network is considered.
2. Tools and Models for Weak Grid Analysis
In this section, a summary of the different models and metrics is provided, as well as a proposed screening methodology for weak grid analysis. The aim of the screening methodology is to combine the different methods and allow system planners to determine fast and accurately if an IBR plant puts the stability of the network at risk.
2.1. Grid Strength Assessment Metrics & GSAT
To assess the system strength, SCR-based metrics (e.g., short circuit metric, weighted short circuit metric, composite metric) have been traditionally used as a screening metric [13]. Classic short-circuit metrics [14] gives an indication of the small-signal stability margins, since low short circuit ratio can lead to converter control instability, i.e., decrease the robustness of the control system. Thus, careful consideration should be given to control parameter tuning in case of low short circuit ratio metrics.
Moreover, EPRI has proposed an additional advanced metric corresponding to the critical clearing time (CCT) considering a 3-phase fault at selected buses near the IBR, e.g., point of interconnection (POI) of the IBR [14]. The CCT is from the perspective of the inverter-based resource and not of a synchronous machine. The advanced metric allows system planners to evaluate the transient stability margin of the inverter, coordinate available protection schemes and determine its dispatch at the POI. Moreover, the advanced metric accounts for how different IBR controllers affect the CCT and evaluates how different control parameters influence the transient stability of the system (classic system strength metrics do not account for the influence of the control parameters). Small values for the CCT indicate that the system is close to its transient stability limits. Details about the synchronization/transient instability mechanism, as well as the analytical mathematical model of the advanced metric, are provided in [14].
A software tool named “Grid Strength Assessment Tool (GSAT)” has been developed by EPRI that calculates these various system strength metrics at selected buses of the system [15]. The advantage of utilizing GSAT is that it provides a quick assessment about the transient and small-signal stability margins using only a steady state snapshot of the system (e.g., power flow and network configuration). GSAT is used as a first screening process for identifying areas of potential inverter instabilities in the system.
2.2. Generic REGC_A and REGC_C models
Figure 1 depicts the block diagram of the state-of-the-art renewable energy generator/converter model used in positive sequence simulation environments, namely REGC_A model. It is used to represent the converter interface with the grid and incorporates a high bandwidth current regulator. The main features of the REGC_A model are:
- Reactive current management during higher voltage events at the IBR terminal
- Controlled response of the active current during low voltage events
- Time constants that determine the speed of the active and reactive current injections into the network
All parameters and variables of REGC_A model are defined in reference [16]. As it can be seen in Figure 1, REGC_A does not explicitly represent the dynamics of the IBR’s fast inner controllers, namely the phase-locked loop (PLL) and inner current control loop. Thus, it is unable to represent phenomena or potential instabilities (observability of possible oscillatory behaviour) that can appear when the system strength is low, and the IBRs’ inner control loops are tuned to respond very quickly (within hundredths of milliseconds).
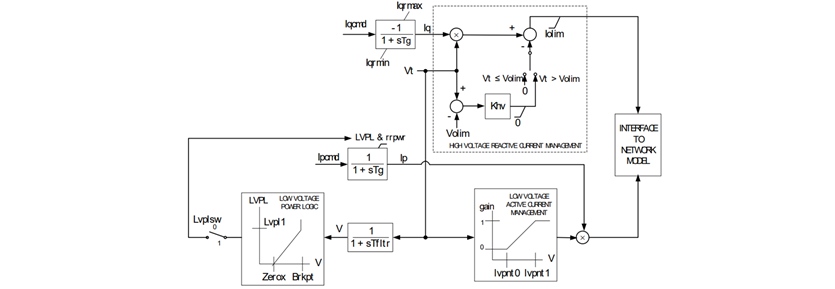
Figure 1 - Complete block diagram of state-of-the-art positive sequence converter model – REGC_A model [16].
The block diagram of the REGC_C model is depicted in Figure 2. The developed model allows for translating the current commands into voltage reference commands behind the impedance. This improves the numerical stability of the IBR model when it is connected to low short circuit networks. Moreover, the developed model by EPRI accounts for the impact of the inner current and PLL controllers on the dynamic response of the IBR. This improves the validity of positive sequence models in terms of capturing oscillatory phenomena associated with the fast inner controllers of IBRs. Thus, the improved representation provides the level of detail which is necessary for capturing some of the oscillatory behavior that was previously only observable in an electromagnetic transient (EMT) platform and renders the REGC_C generic positive sequence model suitable for providing useful results under low short circuit conditions that are in aggrement with the ones obtained with EMT domain simulations.
This improved accuracy and reliability of the REGC_C positive sequence model can benefit system planners, since it allows for faster dynamic security assessment of their system and not having to rely solely on computationally expensive EMT simulation. All parameters and variables of REGC_C model are defined in reference [17].
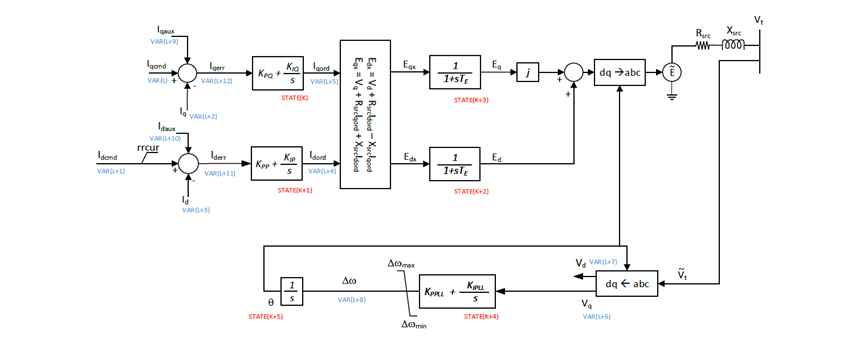
Figure 2 - Complete block diagram of positive sequence converter model developed by EPRI – REGC_C model
Although models implemented in the positive sequence domain lack some of the dynamic information that can be provided by a model implemented in EMT domain, they can still be used for assessing the dynamic performance of IBRs in low short circuit networks. This is realized by improving the mathematical model used in positive sequence domain and an appropriate parameterization of the model.
Figure 3 depicts a comparison between EMT and positive sequence generic models of an IBR operating with constant current reference values. Two responses of two types of generic positive sequence models are compared. These two models are named as REGC_A and REGC_C. The REGC_A model is the present state-of-the-art model in positive sequence simulation environments, while the REGC_C model is a new model which has an approximate representation of inner current control loop and PLL. Although the response provided by the REGC_C is not identical with the one obtained when using the EMT model, there is a useful agreement in terms of dynamic response, i.e., system is marginally small-signal stable. Unlike REGC_C, the state-of-the-art REGC_A model is unable to capture the trend of the IBR response and indicates that the IBR is small-signal stable. This disagreement between the positive sequence models REGC_A and REGC_C is because REGC_A does not represent the inner loop and PLL dynamics which are responsible for the oscillatory behaviour experienced by the IBR. Detailed validation of the proposed REGC_C model against EMT models implemented in different EMT domain platforms and vendor models can be found in [6].
Since the REGC_C model has a representation of the dynamics of inner loops, a smaller numerical integration time step (such as 1ms) may be required when using this model in positive sequence studies. Due to this, and depending on how much computing power is available, there can be an increase in total simulation time. However, it is understood and acknowledged that the bandwidth of these inner loops extend beyond the bandwidth of positive sequence simulations. Thus, although the use of a model such as REGC_C can help provide observability into potential stability issues that may arise with high inverter penetration, it cannot provide exact information regarding the characteristics of the stability issue identified. For exact information of these characteristics, a more detailed EMT study is recommended to be carried out and a model such as REGC_C can help improve the screening of situations when detailed EMT studies are to be carried out. Finally, in regions of the network where high levels of short circuit strength are still present, it may not be necessary to presently use a detailed model such as REGC_C.
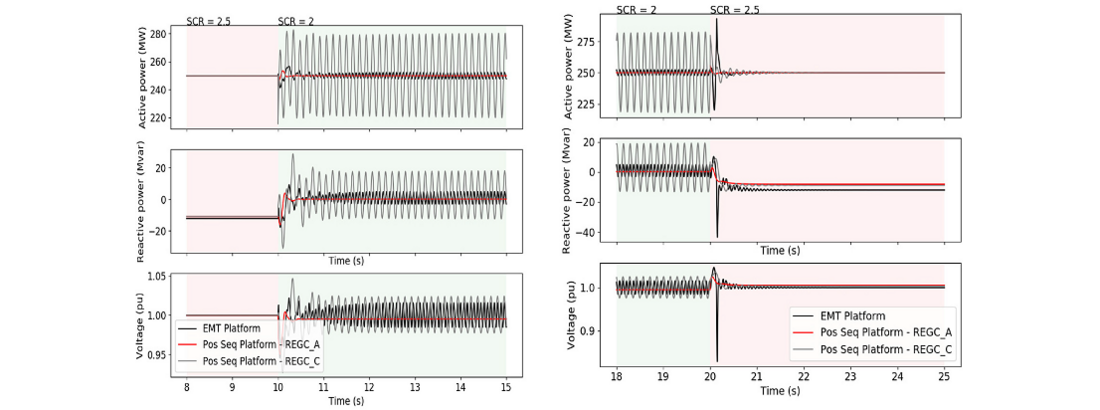
Figure 3 - Comparison of dynamic response between EMT model and positive sequence generic models of PV plant for SCR reduction and SCR increase (black-EMT, red-REGC_A, grey-REGC_C) [6]
2.3. Future planning case in Ireland
The future planning case represents a 2030 high wind scenario. This scenario assumes high penetration of wind, with majority of wind generation located in the southwest of Ireland. The wind generation is transferred from the southwest towards the load centres located in the east side of Ireland. A high level transmission system map of the network is shown in Figure 4.
The high penetration of IBRs in the southwest of Ireland decreases the electrical system strength in this region, i.e., the sensitivity of the IBR’s terminal voltage to variations of current injections becomes higher. This can result in IBR controllers having adverse reactions that could affect system stability. The ability to capture these adverse reactions that could affect system stability is highly influenced by the generator/converter model considered in the positive sequence simulation platform. For the future planning case scenario developed by EirGrid, REGC_A was used as generator/converter model. As demonstrated in [10], this model is unable to capture oscillatory behaviour determined by the PLL and inner current control loop response and can prove inadequate for providing correct information about the system state given a small or a large disturbance.

Figure 4 - High level view of the transmission system [2]
2.4. Screening Methodology for Weak Grid Analysis
The efficiency for carrying out a weak grid analysis highly depends on the accuracy of the results and the computational resources spent performing it, which in turn depends on the tools used in conducting such an analysis.
The available tools can be divided into two categories. The first category involves tools that take a system snapshot as an input and calculate suitable metrics for characterizing the system strength, such as EPRI’s tool GSAT. The tools in this category can provide a very fast quantification of the system strength (without need of dynamic simulations) and identify weak areas/buses in the system for which detailed studies are needed. Although, these tools indicate potential weak areas within the network, they cannot explicitly show to system planners whether the system is stable or not. Thus, simulation tools are required for determining if a connection of an IBR compromises the system stability.
Tools for performing dynamic simulations either in positive sequence or EMT domain form the second category. EMT simulations are able to provide accurate results in terms of how an IBR-plant affects the system operation, however they require considerable computational resources to complete the process. To address the issue of the computation burden, system operators have to rely on positive sequence simulation domain for performing fast system stability assessment. Although inherent limitations in the nature of setup and conduction of positive sequence simulations may be restrictive while analysing the impact of IBRs on the system, they can still provide some useful results that are in agreement with the ones obtained with EMT domain simulations.
To this end, the following two-step approach is proposed that allows system planners to perform weak grid analysis in a fast, reliable and accurate manner.
- Step 1: GSAT analysis – Apply GSAT to selected buses and/or areas in the system, to calculate various system strength metrics and identify potential weak grid conditions. Based on the results of the analysis, the system strength can be characterized to identify weak buses/areas.
- Step 2: Positive sequence Stability analysis – Having determined the weak buses/areas in the system, positive sequence stability analysis is performed with appropriate positive sequence IBR models, to quickly evaluate whether the IBRs connected to these areas/buses have an adverse effect on the system stability or not and identify potential instability scenarios.
It should be mentioned that a subsequent step after the positive sequence stability analysis is to perform stability analysis in EMT domain. This allows for a more accurate representation of the dynamic response of the IBR and thus more accurate information about the stability margins of the IBR and the system. However, as presented in [9], for the type of instabilities (converter small-signal instability, synchronization/transient stability of IBR) investigated in this paper, the positive sequence model REGC_C is sufficient.
3. EirGrid Study Results
3.1. SCR & Advanced Metric
In this section, GSAT is initially used to identify critical POIs. For the analysis, the full EirGrid planning case which represented a 2030 high wind scenario is used and the focus is on 24 IBR POIs that are connected to high voltage buses with low short circuit megavolt-ampere (MVA). Figure 5 presents the calculated SCR for each IBR plant in the future planning case [1]. Among the 24 IBR plants, there are 3 plants with SCR less than 7. In particular, the lowest SCR is 3.3 and corresponds to a POI bus with 2 wind farms (WFs) and a total of 172 MW. The SCRs for the other two IBR POIs are equal to 6.1 and 6.7, which are relatively high and do not imply a weak grid scenario. Thus, considering the short circuit ratio metric only one IBR can be considered as critical with an assumption that a weak grid scenario considers a SCR of less than 5.
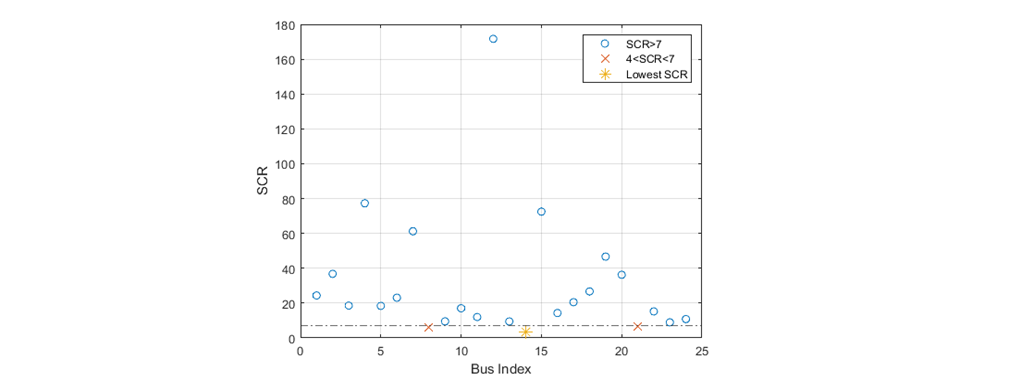
Figure 5 - Calculation of SCR for each POI.
Based on the short circuit ratio analysis, there is only one IBR plant POI with SCR less than 5, i.e., weak grid scenario. However, as it has been presented in [18, 19], the IBR control gains play an important role in converter stability. To understand how the control gains influence the converter stability, the advance screening metric proposed by EPRI is used. We remind the reader that the advanced metric gives an analytical calculation of the CCT considering a 3-phase fault at the IBR-POI and can capture the influence of the AC voltage and PLL control gains on the transient stability of the IBR. While the current control gains also influence the converter stability, they are not considered by GSAT. It is considered that the inner current control is faster than the PLL response and thus it has less influence on the CCT. This assumption is made in order to calculate the CCT analytically. Last, but not least, since the focus is on evaluating the influence of the inner loop fast dynamics of the REGC_C model, a parametric study is performed considering different PLL gains. The control gains of the AC voltage controller are set to 0 and 40, respectively for the PI parameters. Two control settings are considered for the PLL gains with the first one being 20 and 300 and the second one being 20 and 700.
Figure 6 presents the calculated CCT for each POI bus, considering a parameterization of 20 and 700 for the PI components of the PLL. For the calculation, it is considered that the two WFs are aggregated into a single IBR plant. As it can be seen from the figure, only one aggregated IBR plant has a CCT less than 0.2 s.
A sensitivity analysis considering different PLL settings is carried out for these two WFs. The results for the two WFs can be seen in Table 1. More information regarding the selected values for the PLL control parameters can be found in [9]. It is important that the parameters of the REGC_C model are selected so that the positive sequence model ideally match the response of the actual plant.
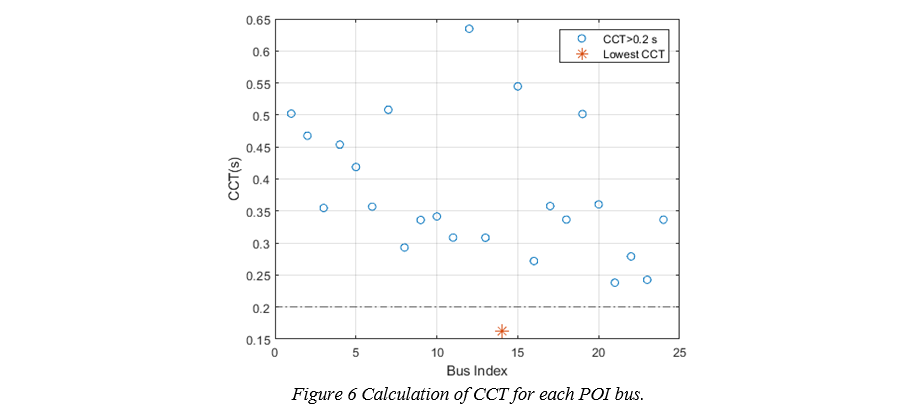
Figure 6 - Calculation of CCT for each POI bus
| PLL gains | CCT - WF1 | CCT – WF2 |
|---|---|---|
| KPPLL = 20, KIPLL = 700 | 0.1572 s | 0.1668 s |
| KPPLL = 20, KIPLL = 300 | 0.2233 s | 0.2378 s |
A higher integral gain of the PLL controller leads to a faster PLL response. The results show that a fast PLL response leads to a reduced CCT. This can be understood as follows. A fast PLL response combined with the increased sensitivity of the voltage to changes of the injected current from the IBR can result in inability of IBRs to synchronize with the system after a 3-phase fault. During a system event that causes a large change in the converter terminal voltage, the inverter controllers would try to change the value injected current into the grid. This change cannot occur instantaneously, but it depends on how fast the PLL can lock onto the grid voltage. If the PLL has a very fast response, it will be unable to lock onto the grid voltage and will cause a current injection different than the current commands determined by the outer controllers. Consequently, the IBR will be unable to recover the voltage magnitude at its terminal, which in turn will further deteriorate the PLL’s control performance.
Finally, it is interesting to note that these WFs are the ones that connected to the point of common coupling with the lowest SCR.

3.2. Time Domain Analysis
In this part of the section, the focus is on evaluating the dynamic response of the WFs considering different converter models, namely REGC_A and REGC_C. For the analysis, the full EirGrid planning case, which represented a 2030 high wind scenario, is used and we are interested in evaluating the dynamic response of the IBRs associated with the worst-case SCR and CCT. To study the system in the positive sequence domain, the IBR plants are represented using the REPC_A and REEC_A for modelling the plant controller and electrical controls of the inverters, respectively. The REGC_A and REGC_C are used to represent the converter model, depending on the considered scenario. Two types of disturbances are considered:
- A three-phase fault at the POI
- Line disconnection close to IBRs connected to the POI with the lowest short circuit ratio.
With the three-phase fault, we are interested in evaluating how different converter models affect the transient stability of the system, while with the line trip, we are interested in identifying small-signal stability issues. Based on the results from GSAT, the IBRs that are connected to the POI corresponding to the smallest SCR and present the smallest CCT values are investigated.
Positive sequence stability analysis is performed to assess performance of existing and newly developed generic IBR models in the low short-circuit parts of the transmission system.
3.2.1. State-of-the-art REGC_A model
We begin the time-domain analysis with evaluating the response of the state-of-the-art REGC_A model considering a 3-phase fault at the IBR-POI bus with the lowest SCR value. It is considered that the fault duration is equal to 150ms, i.e., 7.5 cycles in a 50 Hz system.
3.2.1.1. 3-phase fault – IBR plant with the lowest CCT
Figure 7 depicts the IBR response to a 3-phase fault. As it can be seen in the figures, the voltage cannot recover to its pre-fault value even though there is no topological change after clearing the fault. This leads to a reduced active power injection by the WFs connected to the POI. It is interesting to notice that after the fault clearing, some oscillations can be noticed in the active power trajectories. These oscillations are associated with the lack of numerical robustness of the REGC_A model. As presented in [10], for low values of SCR, the REGC_A has difficulties in maintaining numerical stability. This renders the REGC_A model not suitable for capturing the dynamic response of the IBR in low short circuit environments.
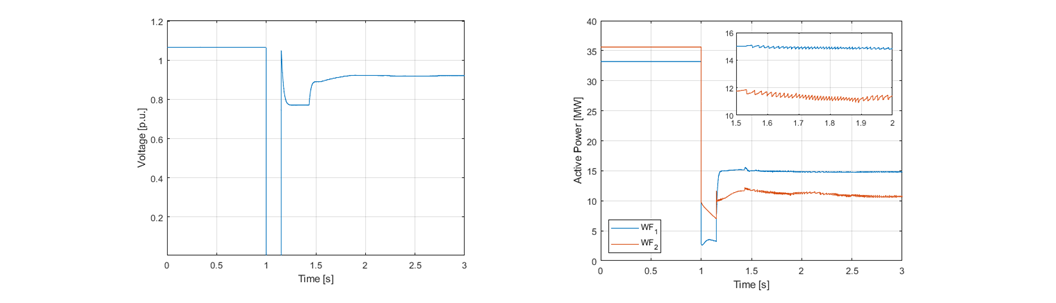
Figure 7 - IBR plant response to a 3-phase fault at POI.
Left figure: Voltage at the POI. Right figure: Active power output of WFs connected to the POI
3.2.1.2. Line disconnection close to IBR plant with lowest SCR
Figure 8 shows the IBR response to a line outage which causes a reduction of the SCR of the IBR plant. The REGC_A model cannot maintain numerical stability which is also indicated by repeated non-convergence messages displayed in the output bar of the simulation platform. The primary cause of non-convergence messages is due to inability of the network solution to converge at each time step.
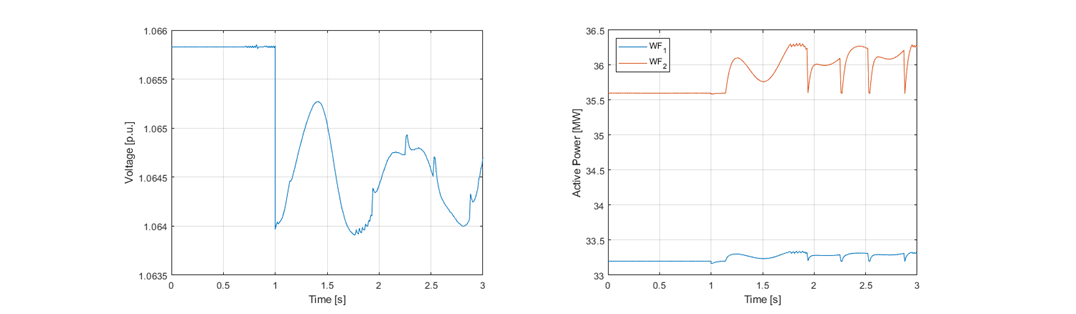
Figure 8 - IBR plant response to a line outage when using the REGC_A model.
Left figure: Voltage at the POI. Right figure: Active power output of WFs connected to the POI
This inability for the solution to converge is an indicator of numerical instability. The causes of numerical instability can be many, but the appearance of non-convergence points towards numerical instability. This shows that the response of the IBR plant to a line outage (i.e., reduction of the SCR) is not able to be sufficiently modelled when the REGC_A is used as converter model. However, the response of the IBR is shown to be unstable. While this can alert system planners that more detailed simulation studies (such as studies in EMT domain) needs to be used to represent the plant’s dynamic behaviour, it does not provide any useful information about the IBR’s response to changes of the SCR. Further, there can be reduced confidence in the model’s result as it could be a false negative result.
3.2.2. Proposed REGC_C model
egarding the REGC_C converter model, we have selected its control parameters to be equal to the ones that have been used before for benchmarking the model against EMT models. This is because we want to avoid selecting values that can lead to unrealistic dynamic responses of the IBR and ensure the validity of the proposed REGC_C model.
3.2.2.1. 3-phase fault – IBR plant with the lowest CCT
A 3-phase fault at IBR-POI bus with the lowest SCR value is applied, considering different fault durations. The REGC_C model is parameterized with current controller gains of 2.0 and 30.0, while the PLL gains were set to 20.0 and 700.0, respectively for the PI parameters.
The IBR response during and after the fault can be seen in Figure 9. For a fault duration equal to 150ms, the IBR is unable to synchronize with the system, so the IBR becomes unstable. An oscillatory behaviour is observed both in the active power injected by the WFs and the voltage at the POI. The frequency of oscillations in the active power injected by the WFs is 11.6 Hz.
Compared to the REGC_A converter model, REGC_C can capture the oscillatory behaviour of the IBR after the fault clearance and most importantly indicate that the IBR dynamic response is unstable. This is because the REGC_C converter model accounts for the fast inner loop dynamics associated with the PI components of the inner current and PLL controllers.
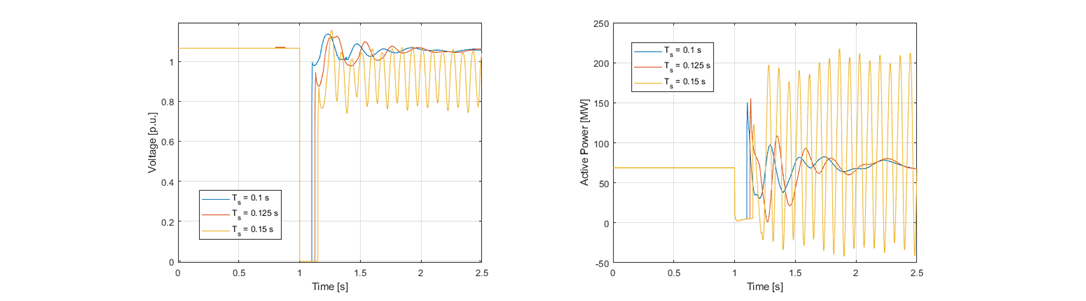
Figure 9 - IBR plant response to a 3-phase fault at POI considering different fault durations.
Left figure: Voltage at the POI. Right figure: Total active power output of WFs connected to the POI.
For shorter fault duration, the IBR can remain synchronized with the grid and its response is stable. Thus, there is a maximum finite duration of fault at the POI of the converter plant before going unstable. Finding the maximum duration of the AC fault is of paramount importance for transmission planners for coordinating protection settings. Considering that this information (about the maximum fault duration) can be extracted using positive sequence simulations, system planners can perform fast dynamic security assessment with a much lower computational burden (compared to EMT simulations). It should also be mentioned that the CCT calculated by time-domain analysis is close to the one estimated using GSAT. This shows that using GSAT as a screening tool allows system planners to evaluate the transient stability margins of each IBR and run time-domain simulations only for IBRs with a low CCT.
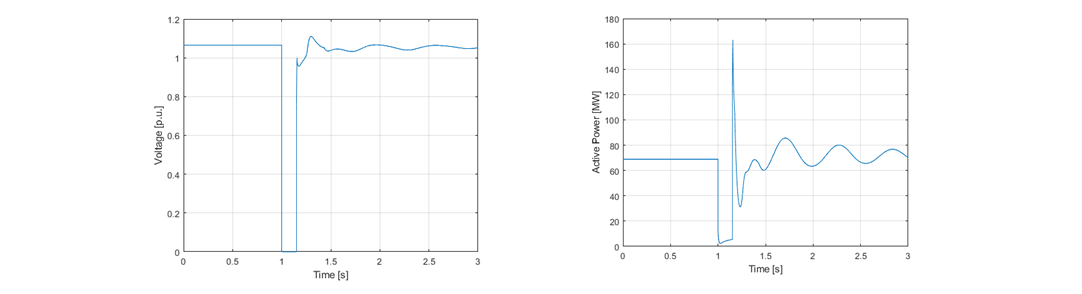
Figure 10 - IBR plant response to a 3-phase fault at POI for 150ms fault duration with change in control gain values.
Left figure: Voltage at the POI. Right figure: Total active power output of WFs connected to the POI
To showcase the importance of control gain values, the REGC_C model is parameterized with current controller gains of 2.0 and 30.0, while the PLL gains were set to 20.0 and 300.0, respectively for the PI parameters. The IBR response during and after the fault can be seen in Figure 10. Unlike the previous case, the WFs can now synchronize with the system and show a stable response after clearing the fault, when a fault duration of 150ms is applied. The only change that was made is the different settings for the PLL controller. Making the PLL response slower improves the transient stability margins. It is important to notice that the results from the time-domain analysis agree with the ones from GSAT, which shows that the tool can be used both for identifying critical POIs but also for performing sensitivity analysis considering different settings for the IBR controllers.
3.2.2.2. Line disconnection close to IBR plant with lowest SCR
Figure 11 shows the IBR response to a line outage which causes a small reduction of the SCR of the IBR plant from 3.325 to approximately 3.0. The REGC_C model is parameterized with current controller gains of 0.25 and 20.0, while the PLL gains were set to 20.0 and 700.0, respectively for the PI parameters. As it can be seen from the figure, the line disconnection leads the WFs to a small-signal instability. The frequency of oscillations and the damping ratio of the mode is determined by the parameterization of inner current and PLL controllers, as well as the equivalent impedance seen by the converter terminal. This shows the ability of the REGC_C to capture the unstable dynamic behaviour of the WFs in a numerically robust manner.
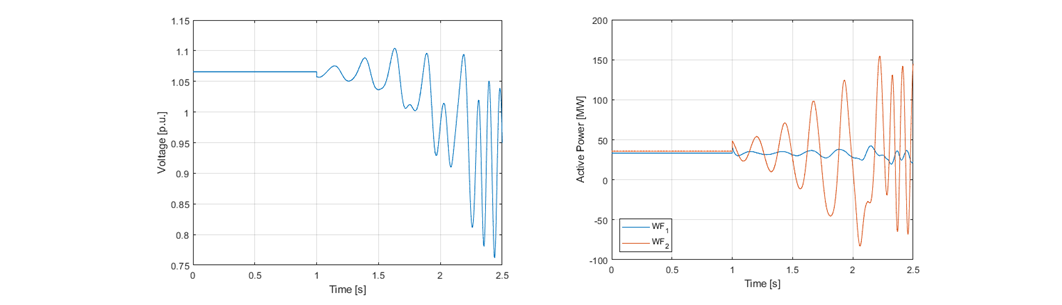
Figure 11 - IBR plant response to a line outage when using the REGC_C model.
Left figure: Voltage at the POI. Right figure: Active power output of WFs connected to the POI
Such small-signal oscillations are not an artefact of positive sequence simulations, as they have also been observed in actual converter plants [20, 21]. The frequency oscillations might differ from the frequency of oscillations observed in the actual plants, as the control parameters in the generic models are not necessarily the actual parameters used in the converter plant. Therefore, the control parameters of the REGC_C model should be identified and selected, so that REGC_C represents adequately well the response of the actual plant or of the black-box model provided by the vendor. Moreover, unlike the REGC_C model, the state-of-the-art REGC_A model cannot capture this oscillatory behaviour since it neglects the fast dynamics of the inner loop controllers. This renders the REGC_C suitable for simulating the dynamic behaviour of an IBR when it is connected to low short circuit networks.
Figure 12 shows the IBR response to the same line outage but with different parameterization of the PLL controllers. The REGC_C model is parameterized with current controller gains of 0.25 and 20.0, while the PLL gains were set to 20.0 and 300.0 respectively for the PI parameters. As seen in the figure, the responses of the WFs are still oscillatory but stable. A decrease in the integral gain of the PLL and a higher ratio of Kp/Ki lead to an improvement of the damping ratio of the mode associated with the PLL and inner current control loop dynamics [21]. This shows the importance of the parameterization of the REGC_C model. Just because an IBR plant is
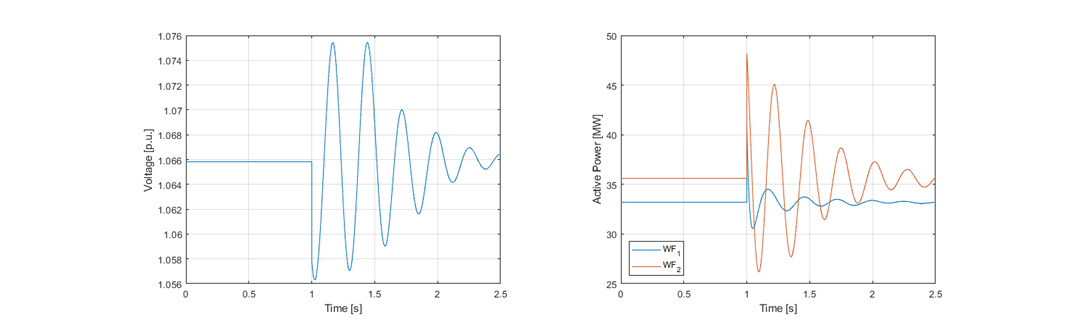
Figure 12 - IBR plant response to a line outage when using the REGC_C model with different PLL settings.
Left figure: Voltage at the POI. Right figure: Active power output of WFs connected to the POI
Connected to low SCR does not imply that its response will always be unstable. A slower PLL response improves the small-signal stability margins of the IBR and ensures its stable operation to a sudden decrease of the SCR.
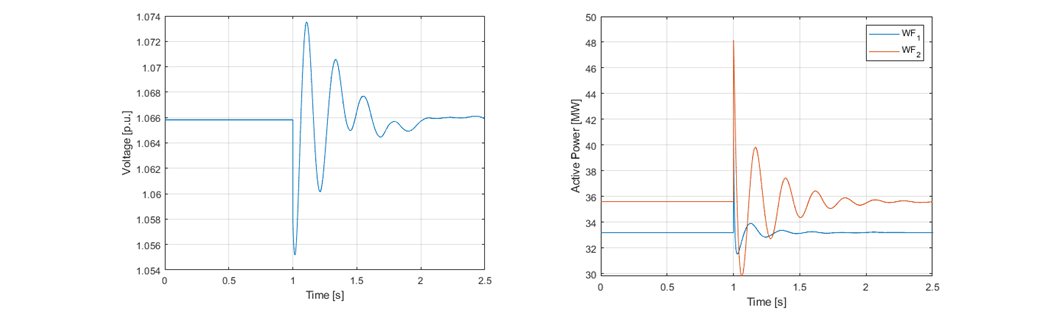
Figure 13 - IBR plant response to a line outage when using the REGC_C model with different current controller settings.
Left figure: Voltage at the POI. Right figure: Active power output of WFs connected to the POI
Figure 13 shows the IBR response to the same line outage but with different parameterization of the inner current controller. The left figure shows the voltage at the POI of the IBR plant and the right figure the active power output of the WFs connected to the POI. The REGC_C model is parameterized with current controller gains of 2.0 and 30.0, while the PLL gains were set to 20.0 and 700.0, respectively for the PI parameters. The figure shows that the responses of the WFs are stable even though the PLL gains are the same as in the unstable case. This indicates that increase of the inner current controller’s proportional gain improves the damping of the oscillatory mode and so the small-signal stability margins of the IBR.
4. Conclusion
This paper presents results of a case study on Ireland’s system using EPRI’s REGC_C generic positive sequence model to detect potential instabilities that may arise when IBRs operate in low short circuit networks. Using GSAT, we were able to identify WFs connected to nodes with low short circuit MVA. After this we tested how different converter models influence the dynamic response of the IBR. We first demonstrated that the state-of-the-art REGC_A is not able to capture these types of instabilities. This renders REGC_A not suitable in networks with decreased short circuit MVA.
Then, using REGC_C generic model, we were able to detect potential small-signal and transient instabilities that may arise considering different control parameters of the inner current and PLL controllers.
Finally, it should be mentioned that the use of the REGC_C model does not intend to replace the importance of EMT simulations but instead, it acts as an additional tool that can help identify critical scenarios where detailed electromagnetic simulation would be required. The representation of the fast current control loops and PLL in the REGC_C model follows a conservative generic structure. It is however assumed that the actual control structure of these loops used by inverter manufacturers can be more detailed/involved. That being said, it is our opinion that the inclusion of these loops in the inverter manufacturer models should be considered on a case by case basis and this should also consider the simulation platform that is being used. One of the authors of this paper has previously compared results of the REGC_C model with a model provided by an inverter manufacturer and in that situation, the inverter manufacturer model lost numerical stability for the low short circuit conditions studied. This by itself does not point towards the need to include these fast control loops in the inverter manufacturer model, but it does point towards a required and necessary effort to increase the numerical robustness of some inverter manufacturer models. It is our opinion that no model is going to be correct/perfect and as an industry, we should have the ability to choose a model that is appropriate for the study that is being carried out.
Based on the results presented in this paper, the following remarks should be considered:
- The static SCR metrics and the CCT can be used for identifying weak POIs and IBRs that are susceptible to converter control instabilities. A sensitivity analysis for different PLL parameters and voltage control gains should be performed using GSAT, to evaluate how sensitive is the CCT for the IBRs to change of the control parameters.
- For POIs with SCR < 5, time domain analysis using the EPRI’s developed positive sequence model can be performed for assessing the small-signal stability of the IBRs connected to these POIs.
- For IBR plants with CCT < 200 ms, a positive sequence stability analysis should be carried out for evaluating the ability of the IBR to remain in synchronism with the network.
- For IBR plants with CCT < 100ms, a detailed EMT study is recommended.
- In the event of a disconnection of the line:
- A reduction of the integral part of the PLL controller improves the small-signal stability of the system.
- A small proportional gain can deteriorate small-signal stability of the IBR and the damping ratio of the mode associated with the PLL, inner current control loop and equivalent impedance seen by the converter.
- In the event of a three-phase fault at the converter’s POI, a slower PLL response improves the transient stability of the IBR and increases the value of CCT.
References
- Milano, F., Dörfler, F., Hug, G., Hill, D. J., & Verbič, G. (2018, June). Foundations and challenges of low-inertia systems. In 2018 power systems computation conference (PSCC) (pp. 1-25). IEEE.
- EirGrid, Transmission System Map, 2020. https://www.eirgridgroup.com/site-files/library/EirGrid/EirGrid-Group-Transmission-Map-January-2020.pdf, accessed 15 December 2022
- Department of Communications, Climate Action and Environment. (2019). Climate Action Plan 2019. https://www.dccae.gov.ie/documents/Climate%20Action%20Plan%202019.pdf, accessed 2 October 2020.
- EirGrid Group Strategy 2020-2025, http://www.eirgridgroup.com/about/strategy-2025/EirGrid-Group-Strategy-2025-DOWNLOAD.pdf, accessed 2 October 2020.
- Ramasubramanian, D., Yu, Z., Ayyanar, R., Vittal, V., & Undrill, J. (2016). Converter model for representing converter interfaced generation in large scale grid simulations. IEEE Transactions on Power Systems, 32(1), 765-773.
- Ramasubramanian, D. (2022). Differentiating between plant level and inverter level voltage control to bring about operation of 100% inverter based resource grids. Electric Power Systems Research, 205, 107739.
- Misyris, G. S., Chatzivasileiadis, S., & Weckesser, T. (2021). Grid-forming converters: Sufficient conditions for RMS modeling. Electric Power Systems Research, 197, 107324.
- Misyris, G. S., Mermet-Guyennet, J. A., Chatzivasileiadis, S., & Weckesser, T. (2019, June). Grid supporting VSCs in power systems with varying inertia and short-circuit capacity. In 2019 IEEE Milan PowerTech (pp. 1-6). IEEE.
- Ramasubramanian, D., Wang, X., Goyal, S., Dewadasa, M., Li, Y., O’Keefe, R. J., & Mayer, P. F. (2022). Parameterization of generic positive sequence models to represent behavior of inverter based resources in low short circuit scenarios. Electric Power Systems Research, 213, 108616.
- Ramasubramanian, D., Wang, W., Pourbeik, P., Farantatos, E., Gaikwad, A., Soni, S., & Chadliev, V. (2019). Positive sequence voltage source converter mathematical model for use in low short circuit systems. IET Generation, Transmission & Distribution, 14(1), 87-97.
- J. Z. Zhou, H. Ding, S. Fan, et al., "Impact of Short-Circuit Ratio and Phase-Locked-Loop Parameters on the Small-Signal Behavior of a VSC-HVDC Converter," in IEEE Transactions on Power Delivery, vol. 29, no. 5, pp. 2287- 2296, Oct. 2014, doi: 10.1109/TPWRD.2014.2330518
- J. Hu, Q. Hu, B. Wang, et al., "Small Signal Instability of PLL-Synchronized Type-4 Wind Turbines Connected to High-Impedance AC Grid During LVRT," in IEEE Transactions on Energy Conversion, vol. 31, no. 4, pp. 1676- 1687, Dec. 2016, doi: 10.1109/TEC.2016.2577606.
- WG B4.62, 'Connection of Wind Farms to Weak AC Networks,' Cigre Technical Brochure 671, 2016.
- Wang, Wenzong, et al. "Transient stability analysis and stability margin evaluation of phase‐locked loop synchronised converter‐based generators." IET Generation, Transmission & Distribution 14.22 (2020): 5000-5010.
- Electric Power Research Institute, ‘Guidelines for Studies on Weak Grids with Inverter Based Resources’, Palo Alto, CA, December 2018. 3002013639
- WECC Renewable Energy Modeling Task Force, “WECC Wind Plant Dynamic Modeling Guidelines”, April 2014.
- WECC Modeling and Validation Subcommittee, “REGC_C Model Benchmarking”, Sept. 2022
- Baker, W. W., Ramasubramanian, D., Escudero, M. V., Farantatos, E., & Gaikwad, A. , “Application of an Advanced Short Circuit Strength Metric to Evaluate Ireland's High Renewable Penetration Scenarios”, (2021).
- Application of an Advanced Short Circuit Strength Metric to Evaluate Ireland's High Renewable Penetration Scenarios: EPRI Supplemental Project, EPRI Palo Alto, CA: 2020. 1-112949.
- First Solar Inc.: ‘Deploying utility-scale PV power plants in weak grids’. 2017 IEEE Power & Energy Society General Meeting, July 2017
- B. Badrzadeh, Z. Emin, S. Goyal, S. Grogan, A. Haddadi, A. Halley, A. Louis, T. Lund, J. Matevosyan, T. Morton, D. Premm, S. Sproul, System strength, CIGRE Sci. Eng. 20 (February) (2021) 5–26.
- [1] Here, SCR is evaluated for each bus as ratio between the short circuit capacity and the MVA rating of the IBR at that bus. In this evaluation, the impact of nearby IBRs have not been considered, although this capability is there in GSAT