Testing and Diagnosis of Power Cables using Damped AC Voltages
AUTHORS
E. GULSKI, G.J. ANDERS - Lodz University of Technology, Poland
R. JONGEN - onsite hv solutions ag, Switzerland
J. PARCIAK - onsite hv solutions Central Europe, Poland
H. PUTTER, D. GÖTZ - Megger Germany GmbH, Germany

Summary
Testing of the newly installed and service aged transmission power cables is becoming more and more important issue to ensure high quality of the cable circuits. During the past 20 years, in addition to the traditional continuous AC voltage testing using AC resonant systems, the damped AC method has become an alternative testing way accepted in many countries. PD monitored voltage withstand testing using damped AC voltages provides similar results for PD occurrence and the localization to the traditional resonant method. PD monitored damped AC voltage testing was successfully applied for quality control of newly installed on- and offshore long length HV cable connections up to 230 kV. Such tests form a sound basis for quality assurance and condition-based maintenance during the cable’s service life.
KEYWORDS
After-laying testing - Diagnostic testing - Damped AC Voltages - Dissipation Factor - Partial Discharges - Power Cables1. Introduction
Early cable failure occurrence can be prevented by high quality of the workmanship onsite [1,2]. In order to check the on-site installation, the acceptance voltage withstand testing is performed on the newly installed cable systems. During the on-site tests, both cable insulation and cable accessories are tested at an externally applied over-voltage condition just before putting them into operation [1,3]. The test intends to identify any weak spot in the power cable system e.g., introduced during transportation or poor workmanship and so on. According to [4-5], the test is called successful if no breakdown was registered in any part of the cable system during testing time. Failure statistics of, e.g., new cross-linked polyethylene (XLPE) cables at different voltage levels, show that early failures occur during the first three years of operation. Eighty percent of these failures are related to the local installation defects in cable joints and terminations [1]. Experience presented in [2] shows that 12% of all on-site acceptance tests on newly installed circuits resulted in breakdowns mostly in cable joints and terminations. The majority of the problems are caused by poor workmanship during assembling, including:
- Wrong assembling dimensions,
- Wrong materials or tools used,
- Missing or wrongly applied electric field distribution elements of joints and terminations, e.g.: spacers, fillers, semi-conductive materials, insulating tapes, defects of deflectors and so on.
Past experiences show for new XLPE insulated 60 kV to 230 kV cables that the highest number of failures appears within the first 3 years of service [6,7]. Assuming that the cable systems have been tested after installation and passed successfully the commissioning process, there must have been some hidden defect(s) that had not been detected by the applied testing procedures like those described in [4,5]. These defects could develop slowly, and the statistics show that there is a chance of a failure every 42 km of circuit lengths [6,7].
In the last 30 years, different testing methods have been introduced and are currently in use, including: continues AC resonant (ACR) and damped AC (DAC) [3]. It has been documented in recent publications that for testing transmission power cables; the DAC after-laying and diagnostic testing [13-15,49,50,54,55] is providing a sensitive PD detection method. By using DAC, a calibrated PD detection is possible onsite with a background noise below few tens of pC [8,12].
To assess the overall technical condition of newly installed power cable circuits and/or to evaluate the electrical, thermal and mechanical service aging of cables in operation, the following tests and diagnostics are usually performed and the results evaluated in relation to different testing parameters as provided by the international guidelines, recommendations, national regulations and power companies own recommendations [3-5, 16-30]:
- High voltage continuous resp. damped AC over-voltage testing,
- Partial discharge measurement,
- Dielectric losses by estimation of the dissipation factor (Tan δ).
The quality of the installation of power cables, including its components, has an impact on the availability of the power supply [12,29]. To obtain full information about the technical status of the cable system, it is important to answer the following questions:
- What are the conditions of cable system components, e.g.: terminations, joints, cable insulation?
- Is there any degradation process visible in the cable components, e.g., from installation or service operation?
- Can the particular components of the cable system withstand service conditions with minimum risk of breakdowns?
- Are there any threats of potential failures in the near future, e.g., next year or in five years, in any of the cable system components?
- Will the over voltage service conditions, e.g., switching surges or short-circuits, cause the deterioration or defects which can be a threat for cable reliability?
To answer these questions, various types of on-site tests can be applied to power cables, e.g.: low/high voltage, on-line/off-line, electrical/non-electrical or destructive/non-destructive tests. Detailed information about various testing methods for HV/EHV cables can found in [3-5,16,20,21,27].
Voltage withstand tests are part of after-installation acceptance tests described by the standards, guides and recommendations [4,5,16,21]. PD and dielectric loss are diagnostic parameters that may give additional information about the condition of the tested object [24-28]. Based on characteristic of the PDs and dielectric loss measurements, potential insulation damage can be pinpointed.
High voltage on-site withstand tests are applied for:
- Commissioning of the cable system on site to demonstrate that transportation, installation and the erection have not caused any dangerous defects in the insulation.
- Checking quality of the repair of the cable system and confirmation that all dangerous defects in the insulation have been eliminated.
- Diagnostic purposes to demonstrate that the insulation is still free of dangerous defects and the life-time expectation is sufficiently high.
This paper discussed the testing approach covering partial discharge (PD) diagnosis and dielectric loss estimation monitored during the on-site voltage withstand testing by damped AC voltages [3, 16].
2. Onsite testing of transmission power cables
Application of an overvoltage to the insulation is the oldest method used to qualify the cable for service conditions. This test is related to the nominal voltage (Uo) or above nominal cable voltage (over-voltage) conditions. This simple test can be used to check whether the cable insulation holds the required voltage for the duration specified in the applicable standard, e.g., according to the IEC norm - 1h at 2.0 x Uo for 110 kV cables. The test based only on a breakdown criterion is considered insufficient to reliably qualify the examined cable [4, 5]. An external voltage source is necessary for the voltage withstand test to energize the cable capacitance. For HV withstand testing, two types of AC voltages are utilized [3,30]:
- Continuous AC voltage (AC)
- Damped AC voltage (DAC)
For a continuous AC, the capacitance of the cable produces high power requirements to compensate for the losses during the application of a resonant voltage. To generate the required power, a mobile resonance test-set is used with a variable test voltage frequency of 20-300 Hz [3, 30, 36, 38]. Another type of withstand test is the so-called “soak test”. This test is performed on new or after repair circuits at nominal voltage (50/60 Hz power network supply) obtained by connecting it for 24 hours to the network without load [4,5] at the operational voltage. The test is called successful if no breakdown occurred in any of the cable system components. However, results reported in [35, 36, 40] show that this type of the withstand test is not efficient as many installation-related defects have partial discharge inception voltage (PDIV) above the nominal operating voltage - Uo [36, 41].
The IEEE Guide for Field Testing of Shielded Power Cable Systems Rated 5 kV and Above with Damped Alternating Current (DAC) Voltage, has been available for the past 7 years [3, 16].
This document describes the advantages and challenges of application of DAC for cable testing in the field. The references [3, 16] discuss the various testing parameters (methodology, voltage levels, test procedures and other testing specific factors) applicable for after-laying- and diagnostic testing for medium- and high voltage power cables. Figure 1 shows some typical test set-ups of single- and double-ended PD detection systems.
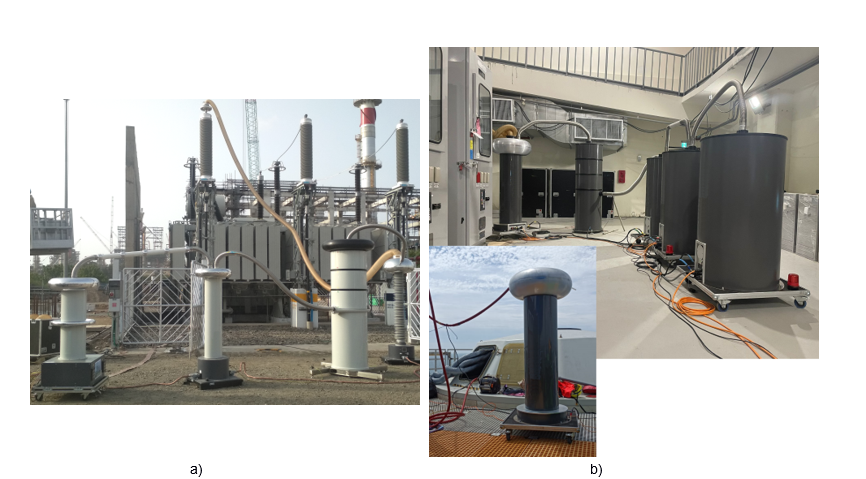
Figure 1 - Example of the on-site testing of newly installed HV power cable circuits: using (a) DAC voltages by a 300 kV system with single sided PD detection, PD detector (Coupling capacitor and quadrupole) on the right side directly connected to the cable termination (b) DAC voltages by a 300 kV system with double power and double-sided PD detection, Both PD detectors (Coupling capacitor and quadrupole), recognisable by the aluminium electrode, directly connected to the cable terminations. The typical weight of those systems is in the range of 1.000 kg and the onsite power demand is in the range of 5 kVA, even to test power cable with the capacitive loads above 10 μF
Sinusoidal damped AC (DAC) voltage testing has been introduced at the end of 1980s as an alternative to the DC test voltages [17]. Since then, the technology has been further developed and DAC testing has been commercially used since the end of 1990s [12, 18,25-29,37,39,41]. Various countries are using the DAC technology for the onsite cable testing combined with PD measurements and dissipation factor (DF) estimation [16,20,21,26-28]. The method is applied for condition assessment of all types of power cable systems up to 230 kV network voltage level.
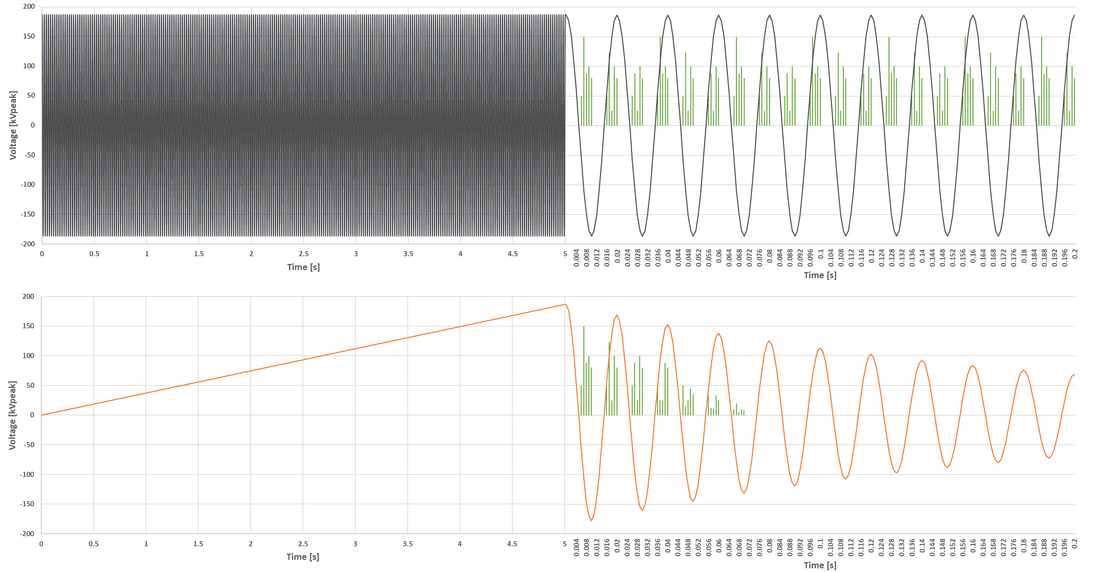
Figure 2 - Visualization example of onsite energizing and PD diagnosis by continuous AC (ACR) voltages (top) and by damped AC (DAC) voltages (bottom), energizing (left), diagnostic (right)
Considering that for (E) HV power cable both methods ACR and DAC are in use, Figure 2 shows the principal differences between them. Based on [8-12], the following statements can be made regarding the results of both methods as a consequence of the same type of insulation defects:
- There is no difference between PD inception, detectable PD levels and PD extinctions voltages.
- The PD pattern information of a single DAC voltage cycle is more informative than that from an AC counterpart because a PD occurrence by decaying DAC voltage is visible.
- There is no difference at maximum voltage level between voltage stress effectiveness in kV/mm.
- The test voltage destructiveness of DAC is lower than that caused by the AC stresses because of the decaying character of the DAC voltage.
- There is no significant difference between dielectric losses at similar test voltage levels and frequencies.
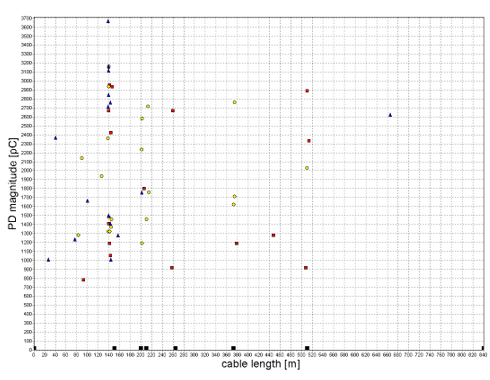
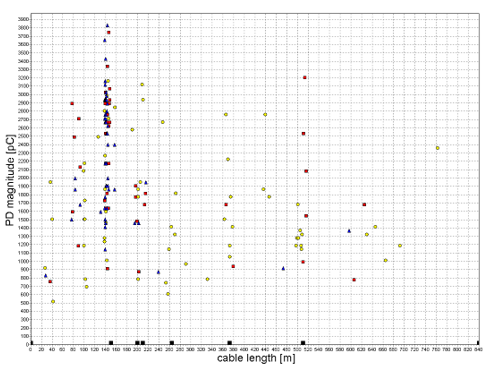
Figure 3 - Examples of PD localization in the same HV power cable done by both a) continuous and b) damped AC test voltages
It is known that the occurrence of partial discharges (PD) is a good method to show the condition of the cable insulation at different voltage stresses. Moreover, prior an insulation breakdown, the detection of a PD is a 72% indicator of the upcoming failures [16].
To investigate the applicability of the damped AC as an alternative for continuous AC voltages, their comparison by different experts is illustrated in Figure 3. These examples, as well as investigations reported in [9,12,51,58,59], confirm that there are no significant differences by applying continuous or damped AC voltages for the PD detection. Additionally, reference [19] suggests that if the damped AC frequency is in the range of 10 Hz-300 Hz, the PD inception and occurrence will not be different from those for occurring at the power-frequency and voltage. This was also confirmed by [12,51].
3. DAC technology
At present the DAC technology up to 400 kV is an alternative method for the onsite testing of power cables, which can be used for testing distribution and transmission power cables and allows PD detection and localization of the problematic areas in a complete cable system (terminations, all types of joints, cable sections, and so on). It can detect problems in both the on-shore and, since a few years, also in the off-shore power cables [53-56].
The physical design and embedded system configuration result in a small footprint, and low level of electromagnetic interference resulting in a reproducible onsite background noise of few tens of pC (see [19, 32-33]), as illustrated in Figures 4 and 5. This noise level is a combination of the background noise of the applied test voltage, which should be low, and additional electromagnetic interferences in the nearby environment.
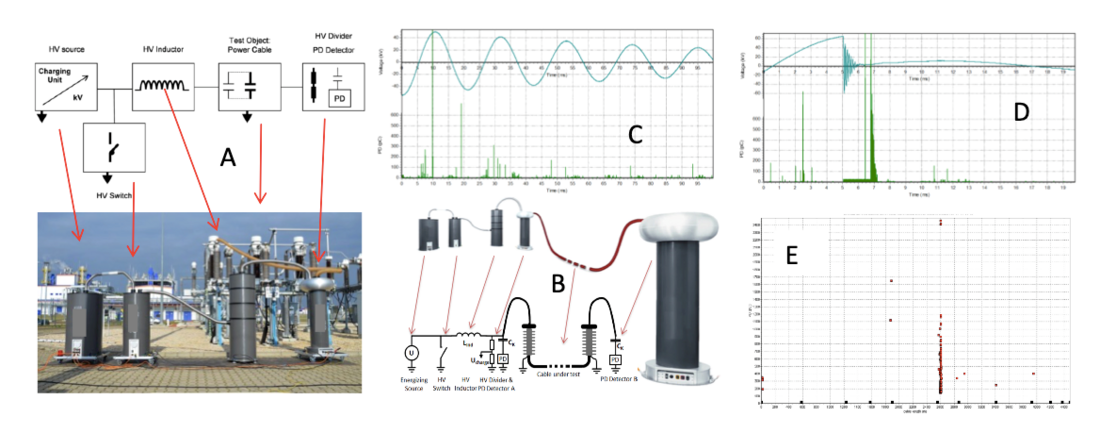
Figure 4 - Damped AC (DAC) system for the on-site testing and PD detection of transmission power cables: (A) schematic overview; (B) configuration for 2-side PD detection for long cables; (C) PD monitored DAC voltage; (D) PD monitored DAC voltage breakdown; (E) PD mapping to localize the discharging site in a cable
To obtain a low noise level during the PD measurement, DAC systems use own HV supply. Additionally, all components in the system have to be PD free. All components have dedicated designed HV electrodes and HV (inter) connections that would withstand a higher voltage easily without showing any corona effects. Because of compact construction, it is possible to obtain enough distance from other (live) parts, while keeping a short HV and ground connection between the DAC system and the test object that delivers the optimal signal to noise ratio. Furthermore, the following aspects are providing system own background noise level below 10 pC (see Figure 5) when applying the DAC system:
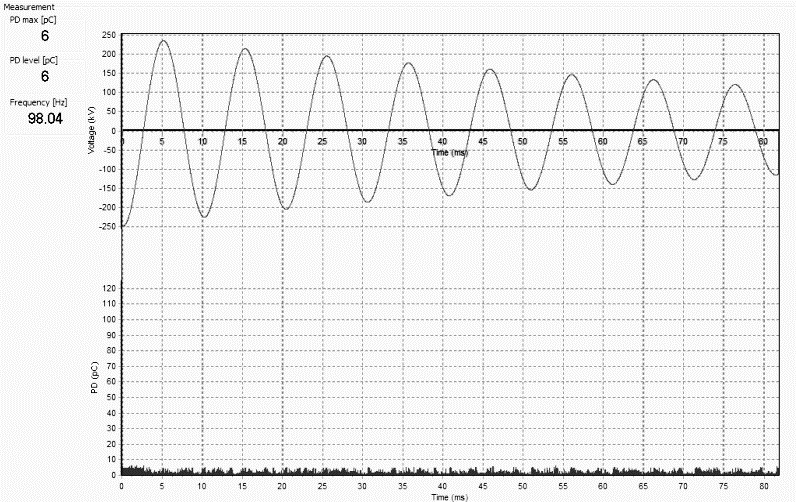
Figure 5 - Example of DAC PD background noise (< 6 pC) as measured on-site on a PD free 220 kV power cable
- The ‘clean power supply’: is formed by the capacitive test object itself and the external inductance that is part of the system. During damped AC resonance, the power supply used to energize the test object is actually switched off during the PD measurement. The modern design of the coils of the PD free external inductance guaranties a noise free power supply that enables a very sensitive PD free measurement environment.
- Unique semiconductor switch: The use of a proprietary laser triggered semiconductor switch, unique to the DAC, enables switching without disturbances, both in its primary current path, as well in the energy necessary to operate the switch. As this switch is driven by a laser light only, no heavy, noisy power supplies and mechanical moving parts are necessary.
- Linear grounding philosophy & optical control: Grounding of the system is designed in such a way that the grounding path is as short as possible. During the measurement, only one linear, non-branched, ground connection is of importance. Ground loops and external coupling of interferences over the grounding path is therefore reduced to a minimum. Also, all communication and control between the system components takes place over optical cables. In this way, no analogue signal loops or lines are present between the system components that could cause interference or noise.
- Optimal shielding: All sensitive PD measurement and signal processing components are constructed in shielded compartments in such a way that external disturbances cannot couple in.
Measurement systems with low self-noise levels will provide better and easier PD detection. Furthermore, it is known that the noise level at a low frequency bandwidth (IEC level) can be higher compared to the noise level at the higher frequencies, which is used for PD localization.
4. AC testing voltages with emphasis on DAC
The generation of DAC voltages consists of 3 stages described below.
4.1. Energizing phase
Damped alternating voltages (DAC) are generated by continuously increasing the voltage applied to the test object to a predetermined level (energizing phase) and then immediately discharging the test object’s capacitance through a suitable inductance (switching and LC damped resonance phase), this is visually shown in Figure 2.
During the energizing stage, the capacitance of the test object is subjected to a continuously increasing voltage at a rate dependent on the test object capacitance and the current rating of the power supply. According to [16], during the energizing phase the test object is stressed with increasing unipolar (negative or positive) voltage. The charging time depends on the maximum available load current of the voltage supply, the test voltage, and the capacitance of the test object.
One of the concerns that exists within the industry is that during the damped AC energizing stage space charge may accumulate and can therefore potentially damage the cable under test. Until now, there is no scientific- or applied evidence that space charge accumulation may or may not exists after damped AC application on MV, HV or EHV cable systems.
Following arguments are in favour of the damped AC technology with regards to the possible injection and accumulation of relevant space charge:
- According to [3,12,16,51], applying DAC cannot be treated as an application of a pure constant HVDC voltage because after a reaching the peak value, within a time shorter than 1 µs, a decaying AC voltage is generated.
- According to electric fields and materials fundamental theory [43], no DC stresses and steady-state condition occur in the cable under test if the voltage is continuously increasing until the time of triggering the HV switch.
- Based on the review of the international literature discussing the use of damped AC [3,12,16, 49-56, 58, 59] and the basics of a space charge behaviour, it cannot be stated that there will be space charge accumulation in the XLPE insulation because of the energizing phase for the generation of DAC voltages. This considering the excitation time stays below 100 seconds, and the electrical field strengths will be up to 20 kV/mm.
- All field tests performed in last 20 years in both MV and HV installations supports the theory that no relevant space charge is generated. Within the MV range the field stresses are not comparable with HV or EHV range; however, it was within the MV range where a high number of water-treed cables failed shortly after a HVDC withstand test as the result of the space charge effect. With the DAC tests performed on such critically aged cables no faults have been reported. No increased after testing failures have been reported for measurements performed on HV and EHV cable systems. It must be said that for cable systems above 245 kV limited testing experience is available.
- It is known from the basics of electric field theory that the presence of space charge in the insulation is locally changing the electric field distribution, which in his turn, may be responsible for the occurrence of any pre-breakdown phenomena like a partial discharge e.g., PDIV or PD amplitudes. Older references like [12, 51] as well as recent publications [46, 58, 59] have proven that there are no significant differences between AC and DAC with respect to the occurrence of PD. More important, even after 45 minutes of stressing the cable samples with DAC, no difference in PDIV and PD level occurred, underlining that no relevant space charge has been accumulated over that period as otherwise this would have influenced the PDIV and PD level.
- A recent publication [60] being used in Cigre TB 751 [57], clearly shows that a significant increase in electrical caused by the generation of space charge with a steady-state DC field stress of 30 kV/mm, takes hours. Hypothetically taken, if DAC would generate space charge, which is not proven so far, then based on this research it will not significantly change the local electrical field, as electrical field stress will be lower than 30 kV/mm and as the energizing time will be maximum 1 hour (whereas the increased field strengths will only be seconds per excitation).
- Published conference and referred journal contributions suggest that the electrical field stress must be above 20 kV / mm for the possibility of space charge being trapped [44-47].
- Reference [16] describes the transmission mechanisms from AC to DC field distribution as follows; the initial voltage distribution will be capacitive and slowly relaxes to a resistive distribution with the time constant of typical XLPE insulation (permittivity εr ε0 times volume resistivity ρ): 2.3 × 8.85 × 10 −12 F/m ×1014 Ω•m = 2035 s.
- As a result, in a hypothetical case of pure HVDC stress (constant voltage level only), the time constant needed for this transition would be over 30 minutes. As the duration of the charging phase of a DAC test is significantly below this time with the test voltage levels as mentioned in [4, 5, 16], the E-fields will stay below critical values [44 - 45], [47]. This applies for both single DAC excitations and for several cycles as typically applied during a PD monitored DAC test.
The energizing time needed to apply a DAC excitation depends on several parameters:
- The capacitance of the cable under test in [µF]
- The test voltage level in [kV]
- The energizing current that the DAC power supply can supply.
Depending on the rated voltage of the HV cable, the maximum test voltage level can be up to two times the nominal operating voltage (2.0 x Uo). Damped AC systems are delivering a constant current during the energizing phase, whose value is system dependent. Depending on the cable capacitance and other minor factors, a certain time is needed to reach the selected test voltage level. Examples of energizing times are given in Figure 6.
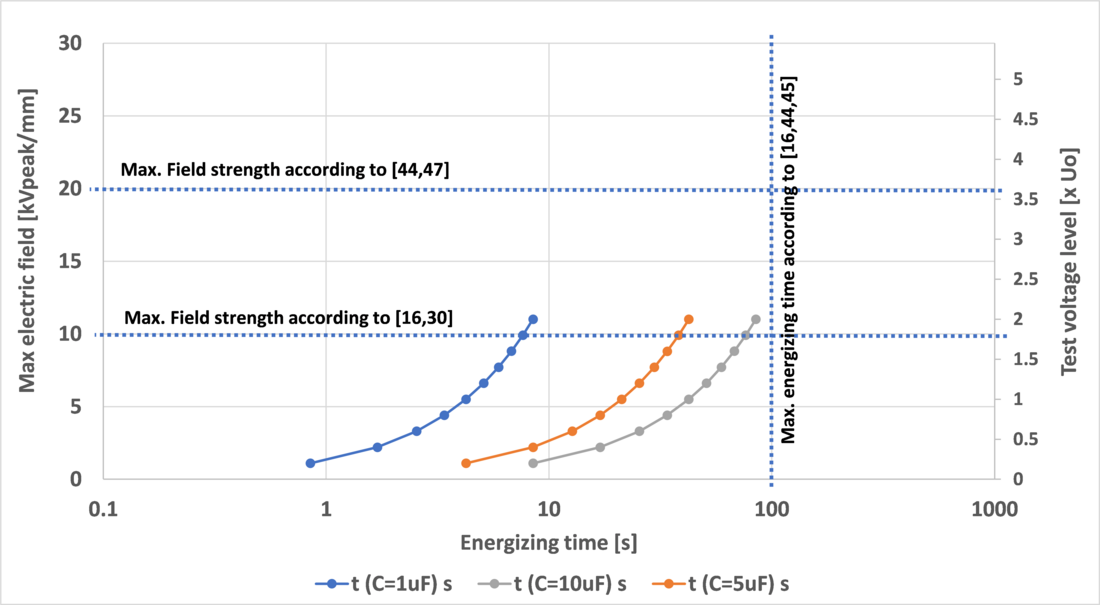
Figure 6 - Examples of damped AC energizing times in relation to the maximum field strengths and energizing times as discussed in different references in a HV cable when testing at 2 x Uo. Example based on a 72 kV rated cable with an XLPE insulation thickness of 11 mm
Energizing times are shown for three different cable capacitances of 1, 5 and 10 µF (approximately 3, 15 and 30 km length). On the secondary Y-axis at the right side, the test voltage level in relation to Uo is given. On the primary Y-axis at the left side, the corresponding maximal peak field strength in [kVpeak/mm] at the conductor is given for a typical HV cable with conductor cross-section of 2500 mm2. The maximum field strength stays far below 20 kV/mm, which is the borderline as per [44, 47]. In general, the total energizing time is below the 100 seconds as suggested in [16].
Examples of energizing times of EHV cables are illustrated in Figure 7 with energizing times shown for three different cable capacitances of 1, 5 and 10 µF (approximately 5, 25 and 50 km length). The maximum field strength does not exceed 20 kV/mm when testing up to 1.7 x Uo. It can also be observed that, in general, the total energizing time is below the 100 seconds if the total capacitance stays below 8 µF. To stay within the limits recommended by [16] and considering very long EHV power cables with capacitances above 8µF, voltage sources with higher energizing currents are recommended to be used.
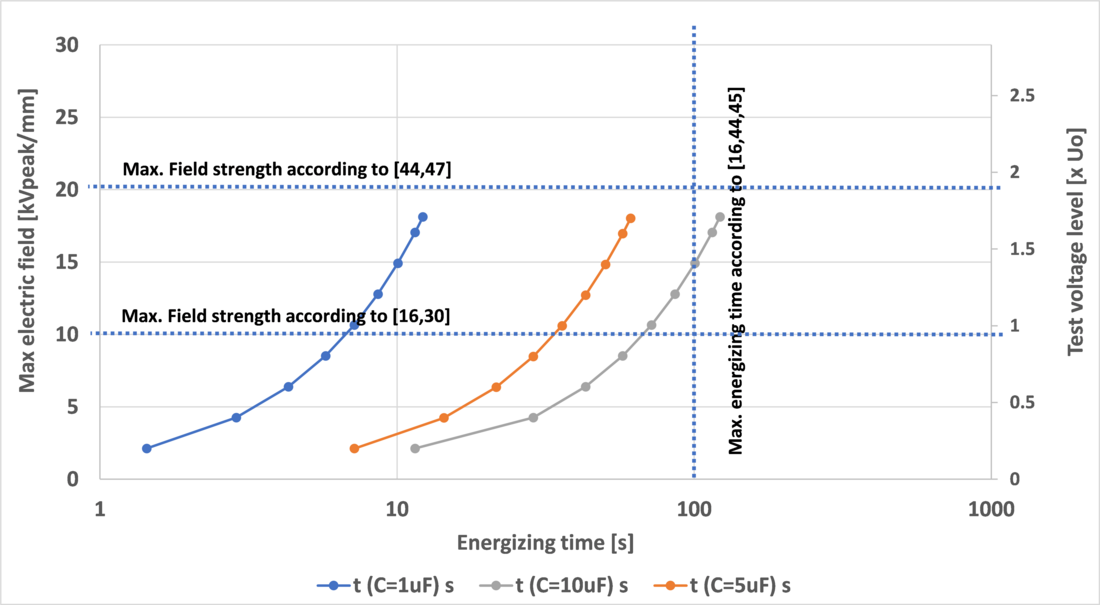
Figure 7 - Examples of damped AC energizing times in relation to the maximum field strengths and energizing times as discussed in different references in a HV cable when testing at 1.7Uo. Example based on a 245 kV rated cable with an XLPE insulation thickness of 22.5 mm
Summarizing the energizing phase, it is recommended to keep the DAC energizing time below 100 seconds [16] and the test field strengths below 20 kV/mm [44-47]. By having these boundaries and the arguments mentioned above, it can be assumed that there will be no relevant space charge accumulation within the XLPE cable insulation.
4.2. Switching phase
After the unipolar charging voltage with a given voltage ramp rate of dU/dt has reached the selected maximum DAC test voltage (charging voltage), the HV switch closes instantaneously, with very fast turn on time, e.g., less than 1μs. This fast-switching time is necessary to avoid switching over-voltages and disturbances during the PD measurements. The cable capacitance and the system HV inductance then form an LC oscillating circuit. The maximum resulting DAC current flowing in the LC circuit is a function of the actual capacitive load, system inductance and the maximum test voltage.
4.3. LC damped resonance phase
The frequency of the DAC test voltage equals the natural frequency of the circuit.
The DAC attenuation depends on the quality factor of the total resonant circuit. The quality factor is inversely proportional to the losses of the circuit that include the HV switch, the losses in the cable system, and the losses in the test set inductor.
Because of the symmetrical bipolar AC discharging process, no remaining charges will be introduced to the cable insulation during the oscillating phase.
As a result of the relatively low cable inductance and no occurrence of transient over-voltages due to reflections at joints and cable terminations, the DAC stress applied to the cable capacitance represents normal AC stress conditions. This means that the PD inception voltage (PDIV), the PD amplitudes, and the PD behaviour are comparable to the factory testing conditions [12,29,51].
In the case of PD-free insulation, the application of DAC stress will have a similar effect as during the factory testing conditions on the pass/fail outcome of the test [12,16,41]. The dissipation factor (DF) can be estimated with the decay characteristics of the DAC wave.
5. DAC voltage testing
Reference [16] defines several parameters that are related to the test circuit, the test procedure, the data acquisition and the data analysis when a DAC test is conducted.
It is recommended to perform the voltage withstand testing with DAC voltages as a monitored DAC withstand test – in this mode, besides a breakdown criterion, diagnostic parameters, i.e., partial discharges and dielectric losses can be used. Evaluation of the PD parameters is used to detect weak spots in the cable system during the DAC test. PD attributes are expressed by diagnostic properties such as PD amplitude, PD intensity, PD occurrence, PD phase-resolved patterns and PD location. The additional information provided by the PD detection; it can improve the evaluation of the insulation condition. If PDs are detected during voltage test execution, evaluation of the detected PDs is necessary. Expert knowledge about PD behaviour for different types of insulation is necessary to obtain reliable picture of the object under test. Important aspects are the background noise level at the test location, proper test setup, calibration and quality of the connection between the cable terminations and DAC test system.

In relation to the applied DAC testing procedures, [16] includes practical considerations, based on user experience during the last 20 years [4,5,12,16,41]. Examples of such considerations include the number of DAC excitations applied during testing and the minimum recommended test voltage level. User feedbacks have confirmed the following test parameters:
- Maximum DAC test voltage levels (Uo is the rated phase to ground voltage):
- For HV cables up to 150 kV up to 1.73 – 2.0 Uo
- For EHV cables up to 230 kV up to 1.4 – 1.7 Uo
- For EHV cables up to 400 kV up to 1.18 Uo
- Fifty DAC excitations at maximum applied DAC voltage withstand level are recommended [16]. Considering the time from the PD initiation until breakdown, DAC test results may differ from those obtained by a continuous AC withstand voltage testing due to the shorter duration of the excitation and decaying characteristics of the voltage [16]. As the use of DAC is an alternative method, the testing should not be unnecessarily destructive and is monitored with the PD inception indicating whether defects are already present. The main goal of the monitored DAC PD withstand test is to detect partial discharge activity during this test. If PD has been detected and localized/ examined one can perform a qualitative assessment. Based on the survey among DAC users reported in [16], some apply (in case of short cable length) a testing time of 60 minutes instead of 50 excitations. Moreover, 40% of the survey responders have observed an insulation breakdown during testing, and in more than 70% of these failures, PD has been detected before breakdown.
A simplified testing procedure for a DAC test on a 220 kV offshore export cable is shown in the flow chart in Figure 8. The test setup is calibration and then each individual cable phase is tested consecutively by increasing the DAC test voltage in steps. When the maximum test voltage is reached, the voltage withstand diagnosis is performed with a minimum of 50 DAC excitations. During all steps, the partial discharge activity and tan δ development are monitored.
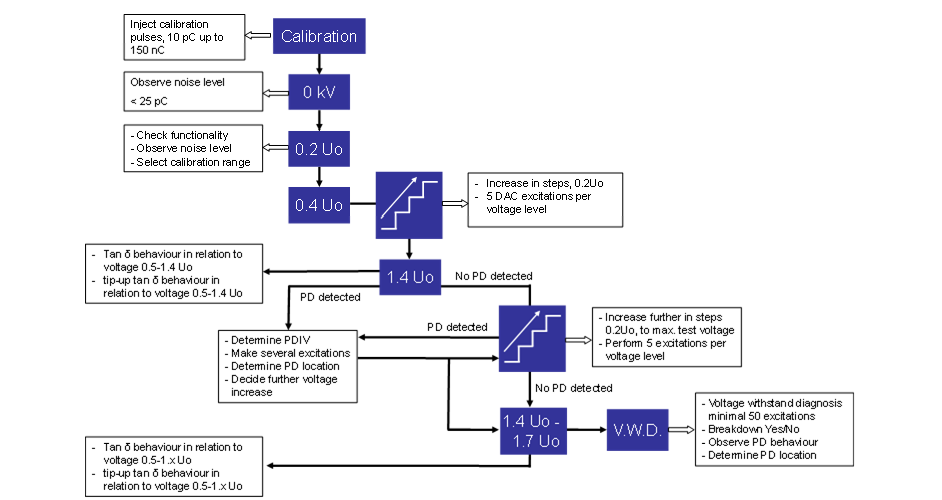
Figure 8 - Test procedure for 150 kV -230 kV export cables [29, 53]
6. Diagnostic parameters
6.1. PD measurement
In situation when the internal PDs are detected and localized, decision about further action(s) needs to be taken. Further steps involve TDR analysis, phase resolved PD patterns analysis and evaluation of the characteristics of PD (occurrence, intensity, amplitude). If PDs are localized during DAC voltage increasing phase in one or more of the faulty cable components, it is usually not necessary to perform the withstand test phase. Additional overstressing of the cable that is not PD-free, can result in an unexpected breakdown and additional risk of the cable and system damage during the testing at the maximum voltage level. Moreover, a breakdown may have an impact on the service life reduction of a healthy cable and cable accessories, especially for serviced aged cables. The cable owner can make an agreement to execute the withstand test even though the PDs were successfully localized. However, if no breakdown was recorded at voltage withstand test but PDs were localized in the cable system, 100% service reliability of the cable system cannot be ensured anymore.
If the PD monitored test voltage mode is used, several PD parameters can be measured as show in Table 1.
| Parameter | Description |
|---|---|
PDIV [kV] | Partial Discharge Inception Voltage – at this voltage first repetitive discharges are visible. |
PDEV [kV] | Partial Discharge Extinction Voltage- at this voltage internal discharges vanish. Determines the highest “safe” voltage at which the test object is “PD-free”. |
PD magnitude [pC] at different voltage | Related to size of defect gives information about PD destructivity. The higher PD amplitude, the more harmful defect is. |
PD pattern (PRPD) | Phase-resolved PD fingerprint of discharging pulses that occurs in single DAC voltage excitation. |
PD intensity [N] | Number of PD pulses recorded in one DAC excitations. |
PD location | Location of discharging sources in cable system through Time Domain Reflectometry technique. Based on this parameter, it is possible to pinpoint the faulty part of cable circuit. |
For effective partial discharge detection, a standardized PD measurement is recommended. A centralized standardized PD detection at the cable termination(s) is normally performed in compliance with [32-34]. The detection and localization depend on many factors, and the higher the PD level is, the higher the chance of localizing it. Depending on the construction type of an individual cable system, a successful single ended PD detection testing can be performed on about 20 km long HV cable circuit.
In the case of longer lengths, the application of a PD detection on both ends of the cable can be performed [16,30,49,50]. This will, for the worst-case situation (PD at the near end), reduce the travelling distance for PD pulses by a factor 2. For the double-sided measurement the system uses a coupling capacitor with PD detector on the near end side and a second PD detector at the far end. In this way, PD localization along the complete line length can be performed, including the terminations, all joint types and the cable insulation [32-34,41,49,50,61]. At present for double-sided PD measurements, experience is available on HV cable circuits with a length of 60 km. From technical and conceptual point of view, present solutions of dual sided PD detection on HV power cables are applicable for cable length of up to 100 km.
6.2. DF (tan δ) estimation using DAC
With DAC voltages, the estimation of the dissipation (DF) factor is based on the calculation of the attenuation factor of damped sine voltage wave applied to the test object [16]. The readings of the DF are based on the loss characteristics of the test object together with the known losses of the measuring device.
During the measurements on the power cable, the dielectric losses can be directly obtained from the damping factor of the oscillating test voltage calculated between, e.g., the first and the third amplitude periods. The damping factor of the AC voltage depends on the loses in the test object (R2) and losses of the measuring circuit. Therefore, the change of R2 relates to change of cable losses. As a result, the lower the value of R2 is, the less damped and longer oscillations are obtained [16].
To the best knowledge of the authors, there are no international standardized acceptance rules for dielectric loss measurements with DAC voltages beside some guidance as given in [12,16,22,52]. Tests are performed on a comparative basis. The purpose of dielectric loss estimation with DAC is to grade tested cables on a scale from high to low quality. Again, comparative testing will show which cables are better and which are worse and, over time, let the users develop their own in-house guidelines, unique to a specific situation. Measurement of the dielectric losses on a cable sample result in a single DF value in [%] expressed as N x 10-4 where the relation is 0.01% = 10 x 10-4. The measuring threshold value of DF at DAC is generally 0.1%.
7. Evaluation guidelines / criteria
When applying PD-monitored DAC testing for acceptance and/or maintenance testing, the following outcomes are possible:
- The complete installation and/or repair have been successfully performed, and the cable section is approved and can be used for network operation.
- The complete installation and/or repair have not been successfully performed e.g., PD presence or insulation have been observed and the cable section has to be repaired or needs further investigations.
| General criteria | Cable voltage class up to 220 kV |
|---|---|
Maximum test voltage | [16, 4,5] After-laying test: 1.4 – 2.0 x Uo (depending on voltage class) |
Background noise level PD measurement (IEC 60270) | ≤ 25 pC with tolerance of ± 20% [29, 53] |
Withstand test criterion | No breakdown during the withstand test (50 DAC excitations) respectively (1 hour using ACRT) at the maximum test voltage level |
PD criterion | No concentrated PD activity (> 6 PD events per cycle) above the background noise level on a voltage level equal and below 1.4 x Uo |
Dissipation factor criterion | Tan δ ≤ 0.1% / Δ Tan δ ≤ 0.1% with tolerance of ± 20% up to the maximum test voltage level |
Introduction of the DAC technology 20 years ago for the onsite testing of power cables opened the possibility of reproducible conditions for calibrated PD detection [32-35]. As a result of scientific research projects [12,49,51] and about 20 years of worldwide after-laying testing of MV and HV power cables at more than hundred different third parties, the parameters listed in Table 2 could be recommended as general criteria for determination whether a transmission cable has passed the test and is sound for operation or not. The criteria are based on the authors’ experience from worldwide testing of power cables at hundreds of different installations up to 230 kV [29, 53].
The background noise level criterion is for the onsite conditions and is also based on experiences. There are no standards available that define the maximum allowed background noise level for the onsite PD testing. This is different to the laboratory measurements where the standard defines a maximum noise level in the range of 1 up to 10 pC. With onsite testing the focus is on the quality assessment of cable laying and installation workmanship. In case of bad quality, the PD level is generally higher then 25-100 pC.
8. Practical case studies of newly installed and in service cable circuits
8.1. Overview of the DAC applicability for testing (E) HV cables
Author’s practical feedback of the last 10 years confirms results of the survey [16] about aplicability of DAC for testing power cables up to 230 kV. Morover, the experences show, the application ratio between HV and EHV cables being 1 to 5, where HV cables are those with the operating voltage of up to 150 kV versus EHV power cables with operating voltage between 150 kV and 230 kV, see Figure 9.
In recent years, the DAC voltage in combination with PD measurement, has been used multiple times for testing HV power cables longer than 10 km as summarized in Table 3.
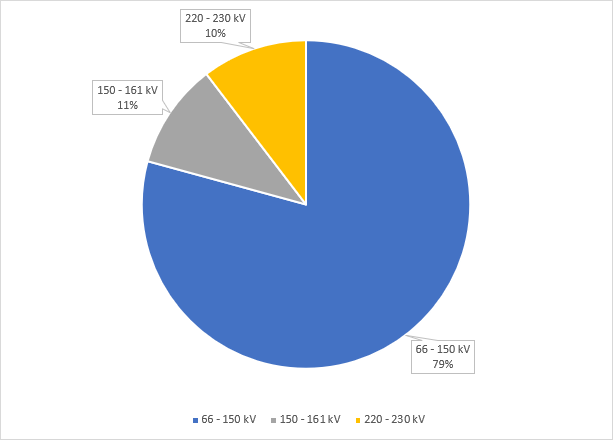
Figure 9 - Overview of cable voltage categories as tested using damped AC voltages
In all cases, the after-laying test was successful, for some cables defective joints have been identified, localized, assessed and replaced. All circuits still operate without any issues after putting in service.
As the overview given in [30] of the use of DAC for testing HV and EHV was based on data collected up to 2016 only and the fact that in the mean time the use of DAC technology has increased significantly, unfortunately these users data have not been evaluated in process of the preparation of the latest version of the [5].
| Cable length | Voltage class | Cable insulation type |
|---|---|---|
38 km, 28 km, 19 km, 16 km, 50 km, 31 km, 31 km, 27 km, 21 km | 110 kV | XLPE |
60 km | 132 kV | XLPE |
22.2 km, 18 km | 50 kV | XLPE |
27 km, 28 km | 230 kV | Oil-filled |
Different lengths up to 14 km | 33 kV | XLPE * |
Different lengths up to 11 km | 66 kV | XLPE * |
14 km | 220 kV | XLPE |
18 km | 150 kV | XLPE |
*Complete strings of an inter-array cables connecting > 10 offshore wind farm turbines | ||
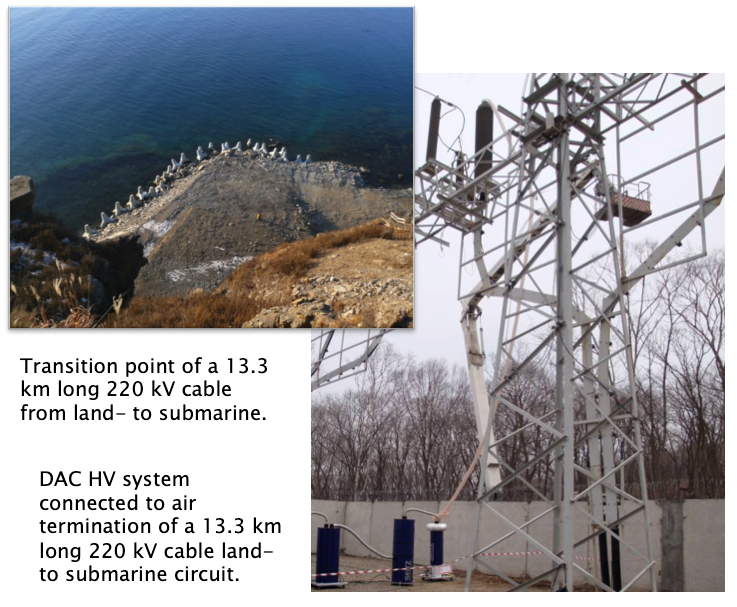
8.2. After-laying Test of On- and Off-shore Cable Circuit XLPE 220 kV 13.3 km long
The after-laying test of a 220 kV export cable 13.3 km long (cable capacitance: 2.1 μF, joints: 21 per phase) has been performed in accordance with [16] by partial discharge monitored damped AC (DAC) withstand test at 1.3 Uo. The frequency was 49 Hz, which is within the recommended power frequency range from 20 Hz-300 Hz, see Figure 10. The PD background noise level was below 30 pC.
An increase in the test voltage has resulted in an increase of PD activity and a breakdown in the discharging site has occurred. Using PD mapping, the PD concentration at 5.2 km has indicated the breakdown position in the cable. The joint breakdown occurred during the voltage increase phase whereas all PD detected before the breakdown were originating from the failed joint. After inspection of the breakdown location it could be seen that an installation issue showed to be the cause of the PD development and eventually the breakdown in the joint.
As a result, the after-laying testing using damped AC voltage combined with dual-sided PD detection proved to be effective for PD monitored testing of a 13.3 km newly installed 220 kV cable with a joint problem, see Figures 11 and 12.
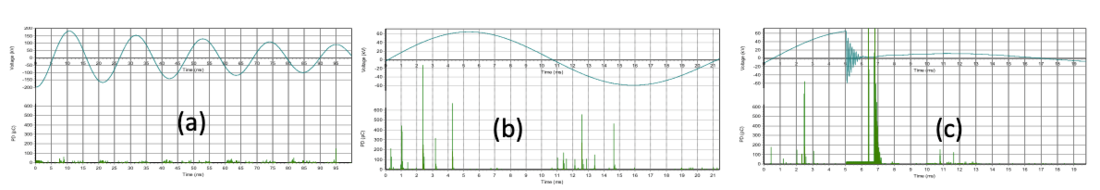
Figure 11 - PD patterns as observed during the test: (a) at L2 and L3 at max test voltage level of 1.3 Uo with no PD activity above the background noise level of 30 pC, (b) at L1 at 0.4 Uo test voltage level before breakdown, (c) at L1 at the moment of breakdown
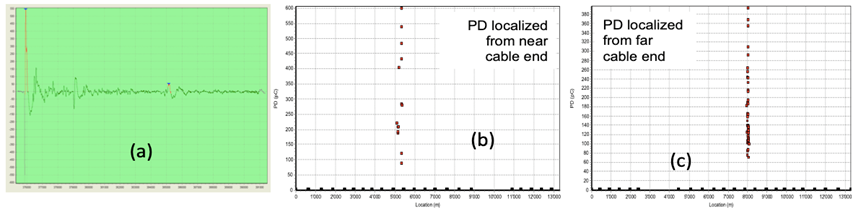
Figure 12 - Dual-sided localization of PD sites in a 220 kV 13.3km long cable circuit: (a) TDR analysis of PD pulse, (b) PD mapping as made from the near cable end up to 1.3 Uo during DAC on-site testing indicating PD presence at 5.160 m position, (c) PD mapping as made from the far cable end up to 1.3 Uo during DAC on-site testing indicating a PD presence at 8.100 m position. Dual-sided PD detection confirms the same PD localization in a joint
8.3. After-laying Test of 110 kV XLPE cable 30.7 km long
A newly installed 110 kV XLPE insulated cable, with a total circuit length of 30.7 km, has been tested after installation, see Figure 13.
The total cable capacitance was 5.9 μF per phase with 37 cable joints installed on each phase. The cable has been tested to a maximum voltage level of 2.0 x Uo with a withstand test of 50 DAC excitations [16]. Prior to the withstand test, a voltage ramp-up test has been performed where the test voltage level was increased from 0.4 Uo up to 2.0 Uo in steps of 0.2 Uo.
The DAC frequency was 28 Hz and the background noise level during the PD measurement was 25 pC.
The test setup can be seen in Figure. 13, with the DAC test system installed at the near end and the additional PD detector installed at the remote end of the cable phase.
The PD activity has been detected during the ramp-up test in cable phase L2, see Figure 14a. Starting from a voltage level of 1.7 x Uo a clear PD pattern could be seen, see Figure 14b. After the ramp-up test, the voltage withstand test of 50 DAC excitations was performed with the duration of 65 minutes.
The analysis resulted in a PD location at the cable joint no. 11 located at 7520 meters from the near end.
The PD mapping is a graphical representation of the cable length that shows the concentration of the localized PD pulses along the cable length, see Figure 14c.
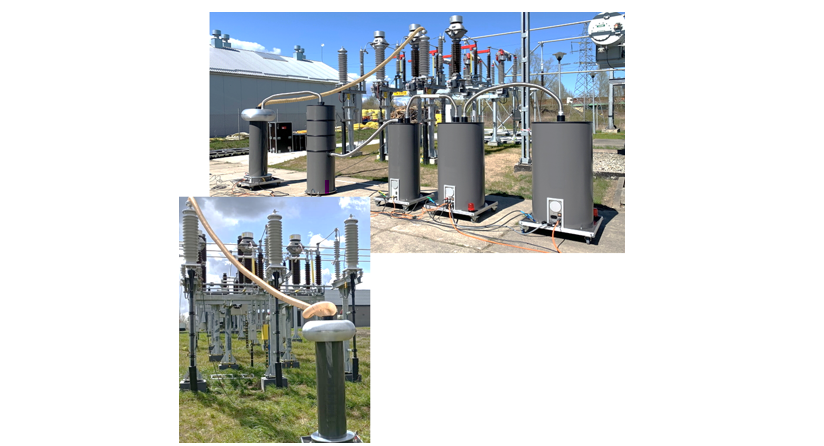
Figure 13 - Test setup with the DAC system connected to the 110 kV cable phase under test at the near end and an additional PD detector at the remote end of the same cable phase
As the PD level was in the range of 100 – 12.000 pC, it has also produced an increase in the dissipation factor tan δ, see Figure 14a. PD activity was found above the operating voltage in phase L2 at a joint position. The joint at this position was replaced and the test was repeated after the replacement. During inspection of the joint, it was found that incorrect installation dimensions have been maintained. During the 2nd measurement, the absence of PD activity could be confirmed, and the cable was successfully energized for service operation.
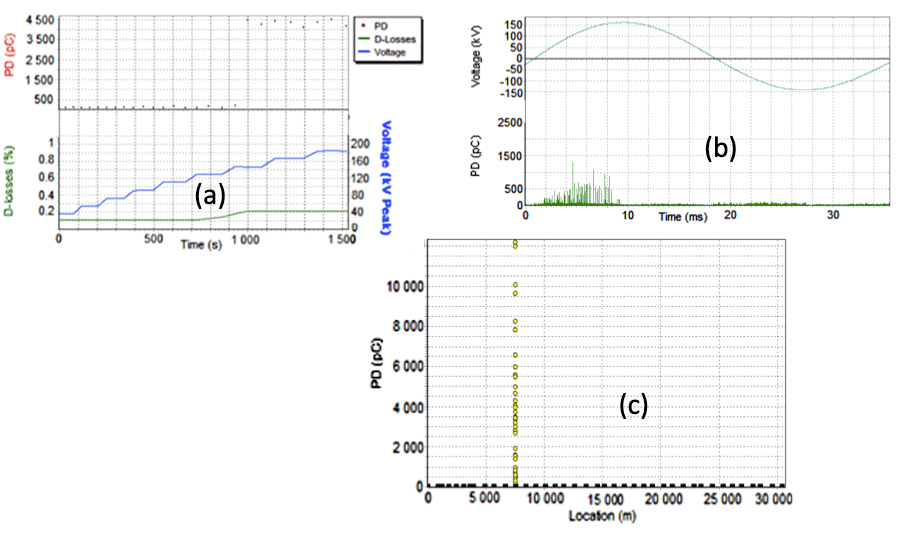
Figure 14 - Dual-sided PD monitored voltage withstand test of a 110 kV 30.78 km long cable system: (a) Test result overview of the PD monitored ramp-up test from 0.4 Uo to 2.0 x Uo prior to the voltage withstand test, duration 25 minutes, (b) DAC phase-resolved PD pattern on phase L2 at the PDIV of 1.7 x Uo, (c) PD mapping showing the overall cable length versus the PD concentration. The black dots represent the joint locations
8.4. After-laying Test of 132kV XLPE cable 19.7 km long
A newly installed 132 kV XLPE insulated cable, being operated at 110kV, with a total circuit length of 19.7 km has been tested using a DAC PD monitored withstand test. The location of cable was 4km above sea-level, thus special requirements for both test system and cable terminations were needed (as of lower breakdown strength at these heights). Test set-up and measurement results are shown in Figure 15.
The cable circuit consisted of 11 cross-bonding joints, which have been straightened for testing and had a capacity of 3.4µF per phase. On one side of the cable, the terminations were ending on a transmission tower. The cable has been tested using single-ended PD coupling only, although based on the calibration a single-ended measurement would have been sufficient (low attenuation, reflective end-pulse being clearly visible), the measurement has been performed from both sides.
The cable has been tested to a maximum voltage level of 2.0 x Uo with a withstand test of 50 DAC excitations [16]. Prior to the withstand test, a voltage ramp-up test has been performed where the test voltage level is increased from 0.2 Uo up to 2.0 Uo in steps of 0.2 Uo. For the second test on the remote end, only a diagnostic ramp-up test has been performed. The background noise was ~50 pC, and the test frequency was 32 Hz.
The 1st measurement performed withstood the DAC PD monitored withstand test, no PD has been detected during the ram-up test and during the withstand phase. In the 2nd test performed from the other side, PD has been detected and localized in the near terminations. After data analysis, it became clear that the PD detected is floating PD, which was caused by the test set-up (implications of having the terminations on HV tower). This shows how important it is to not only have PD detection, but also sophistic tools helping to analyse the root cause of the PD. This this is of major importance for the terminations.
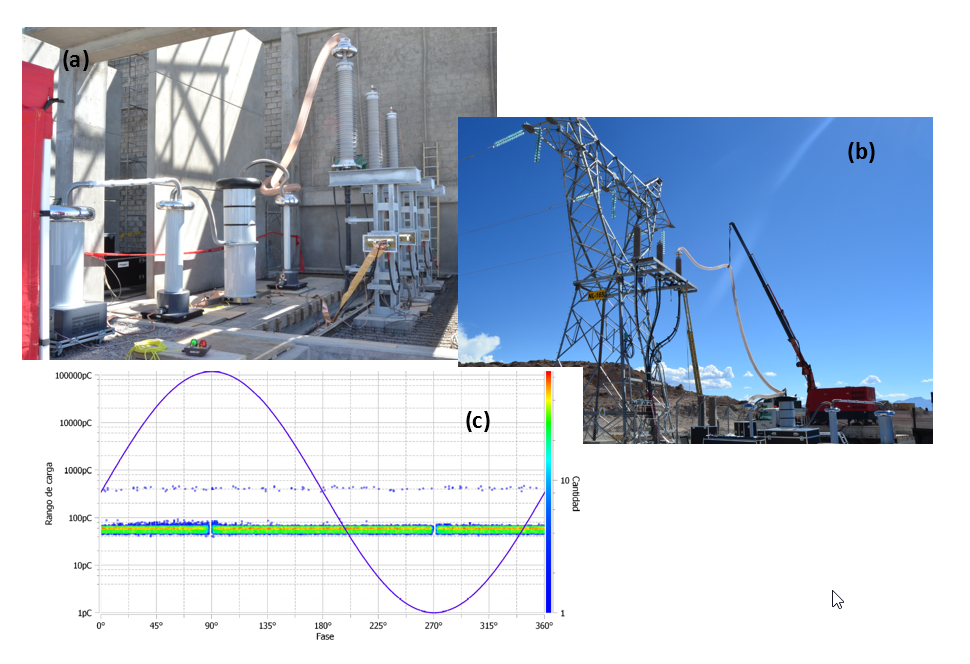
Figure 15 - Single-ended PD monitored voltage withstand test of a 132 kV 19.7 km long cable system: (a) Test set-up from side A, (b) Test set-up from side B, (c) PRPD pattern up to 2Uo of the measurement from side B indicating floating PD and no internal PD
9. Conclusions
From the discussion presented in this paper, the following can be concluded:
- Testing newly installed and service aged transmission power cables is becoming more and more important from the point of view of quality assurance of the transmission circuits.
- The failure statistics confirm that there is a chance of failure every 42 km of installed circuit length. Usually, the failures occur in accessories during the first 3 years of operation with the highest severity and the frequency of failures for export and inter-array cables.
- For the last 20 years, the damped (DAC) testing method has become an alternative to the traditional continuous AC voltage testing using AC resonant systems and is accepted in many countries and regulatory bodies.
- Typical DAC systems for testing (E) HV cables are relatively compact and require low input power. They are typically characterized by weights of approximately 1.000 kg, footprints of less than 10m2 and input power demands of 5 kVA.
- The details of the DAC methodology and the parameters to be used by performing after-laying and maintenance testing of newly installed and service aged cable systems are described.
- PD monitored voltage withstand testing using damped AC voltages provides similar results to the near 50 (60) Hz power frequency high voltage testing for PD occurrence and localization.
- Using large number of old and new references it has been discussed that damped alternating voltages cannot be treated as an application of HVDC and any assumptions as made by [30] about destructiveness of the DAC due DC field and space charge are not proven at all.
- Based on dedicated investigations, it has been shown that if the DAC energizing time will be below 100 sec and the test field strengths will be below 20 kV/mm, there will be no space charge accumulation in the XLPE insulation.
- It has been demonstrated that the PD inception and occurrence is not significantly different from those for power-frequency voltage by applying continuous or damped AC voltages with the AC frequency in the range of 10 Hz-300 Hz.
- It has been pointed out that until now there is no scientific or applied evidence that negative resp. positive polarity of the energizing voltages might have any significant influence on the AC electric fields including PD inception and occurrence generated in the test object.
- Case studies have shown the value of applying the damped AC testing including PD detection and dissipation factor estimation for detecting the upcoming failures prior to service operation and/or in maintenance of existing power cable systems.
- PD monitored damped AC voltage testing was successfully applied for quality control of newly installed on- and offshore long HV cable connections. Such tests form a sound basis for quality assurance and condition-based maintenance during service life.
- Due to the fact that in last 10 years the use of DAC technology has increased significantly, documents from organisations like Cigre, IEEE and IEC need to up-dated to the state of the art.
- Based on the references, the practical examples and the fact that the majority of installation problems is related to defects in cable joints and terminations it is becoming visible that the focus of a modern after-laying testing of newly installed (E) HV cables should move away from applying e.g., a 2.0 Uo voltage over-stresses, towards sensitive PD detection and localisation at lower over-stresses.
References
- E. Pultrum, S.A.M. Verhoeven, “Testing of Extruded Cables”, CIGRE, Paper B1-104, 2004.
- “After-laying tests on high-voltage extruded insulation cable systems”, ELECTRA No. 173 CIGRE Working Group 21.09, 1997,
- IEEE 400-2012: Guide for Field Testing and Evaluation of the Insulation of Shielded Power Cable Systems Rated 5 kV and Above.
- IEC 60840: Power cables with extruded insulation and the accessories for rated voltages above 30kV up to 150kV test methods and requirements;
- IEC 62067: Power cables with extruded insulation and the accessories for rated voltages above 150kV;
- CIGRE Technical Brochure 815, Update of service experience of HV underground and submarine cable systems, 2020;
- CIGRE Technical Brochure 825, Maintenance of HV Cable Systems, 2021
- Wester FJ, Gulski E, Smit JJ. Detection of partial discharges at different AC voltage stresses in power cables. IEEE Electrical Insulation Magazine, July-Aug. 2007;23(4):28–43.
- Oyegoke B, Hyvonen P, Aro M, Gao N. Selectivity of damped AC (DAC) and VLF voltages in after-laying tests of extruded MV cable systems. IEEE Transactions on Dielectrics and Electrical Insulation, Oct. 2003;10(5):874–82.
- Gulski E, et al., Practical aspects of on-site testing diagnosis of transmission power cables in China., International Conference on Condition Monitoring and Diagnosis 2010, Tokyo, Japan, pp. 675-678;
- Bodega R, et al. PD recurrence in cavities at different energizing methods. IEEE Transactions on Instrumentation and Measurement April 2004;53(2):251–8.
- Cichecki P, Testing and diagnosis of high voltage and extra high voltage power cables with damped AC voltages ISBN: 978-83-952726-0-8.
- CIGRE Technical Brochure 722. Recommendations for additional testing for offshore cables from 6kV (Um=7.2 kV) up to 60 kV (um = 72.5 kV). 2018.
- Gulski E, et al. Conventional and unconventional partial discharges detection in power cables using different AC voltages. Montreal, QC: IEEE Electrical Insulation Conference; 2009. p. 5–9. 2009.
- CIGRE Technical Brochure 444. Guidelines for unconventional partial discharge measurements. 2010.
- IEEE 400.4-2015, Guide for Field-Testing of Shielded Power Cable Systems Rated 5 kV and Above with Damped Alternating Current Voltage (DAC)
- “After-laying tests on high-voltage extruded insulation cable systems”, ELECTRA No. 173 CIGRE Working Group 21.09, 1997
- F.J. Wester, E. Gulski, J.J. Smit, “Electrical and acoustical PD on-site diagnostics of service aged medium voltage power cables”, 5th International Conference on Power Insulated Cables, Jicable 1999
- IEEE 400.3-2006: Guide for PD Testing of Shielded Power Cable Systems in a Field Environment;
- HD 632 S2 (CENELEC): Power cables with extruded insulation and their accessories for rated voltages above 36kV (Um=42kV) up to 150kV (Um= 170kV);
- UK Power Networks, ECP 11-0006, Engineering Commissioning Procedure, ECP 11-0006, HV insulation testing 2018;
- CIGRE Technical Brochure 627 Condition Assessment for Fluid-Filled Insulation in AC Cables, 2015;
- CIGRE Technical Brochure 226, Knowledge rules for partial discharge diagnosis in service, 2003;
- CIGRE Technical Brochure 297, Practical aspects of the detection and location of PD in power cables, 2006;
- CIGRE Technical Brochure 502, High-Voltage On-Site Testing with Partial Discharge Measurement, 2012;
- PTPiREE, Frame instructions for exploitation of power cables up to 110 kV, 2011;
- PSE (Polish Power System TSO), Power Cable Lines 220 kV and 400 kV, 2020;
- Smit J, van Riet M, Staarink B, “Non-destructive after laying test with PD localization”, Jicable 2019, paper D3-4
- E. Gulski, R. Jongen, J. Parciak, J. Sieminski, “Modern Methods for Quality- and Condition Assessment of High Voltage Cables” 2020, VDE VERLAG GMBH, Berlin, Offenbach, ISBN 978-3-8007-5353-6.
- CIGRE Technical Brochure 841 - After laying tests on AC and DC cable systems with new technologies, 2021
- CIGRE Technical Brochure 279 - Maintenance for HV Cables and Accessories, CIGRE WG B1.04, Paris 2005
- IEC 60270, Partial discharges measurements.
- IEC 60885-3, Test methods for partial discharges measurements
- IEEE 400.3-2006, Guide for PD Testing of Shielded Power Cable Systems in a Field Environment
- E. Pultrum, S.A.M. Verhoeven, “Testing of Extruded Cables: experience in Type Testing, PQ Testing and Test After Installation. What do we learn from it?”, KEMA High Voltage Laboratory, Netherlands, CIGRE Working Group B1.104, 2004
- E. Pultrum, S.A.M. Verhoeven, “Testing of Extruded Cables”, CIGRE, Paper B1-104, 2004,
- Gulski, E, Cichecki, P, Wester, FJ, Smit, JJ, Bodega, R, Hermans, TJWH, Seitz, PP, Quak, B, de Vries, F, "On-site testing and PD diagnosis of high voltage power cables", IEEE Transactions on dielectrics and electrical insulation, (ISSN 1070-9878), 15(6), 1691-1700, 2008
- After-laying tests on high-voltage extruded insulation cable systems”, ELECTRA No. 173 CIGRE Working Group 21.09, 1997,
- E. Gulski, P. Cichecki, F. Wester, J. J. Smit, “On-site Testing and PD Diagnosis of High Voltage Power Cables”, IEEE Transactions on Dielectrics and Electrical Insulation Vol. 15, No. 6; December 2008,
- CIGRE Technical Brochure 815 - Update of service experience of HV underground and submarine cable systems, 2009
- Gulski E, Jongen R, Quak B, Parciak J, Rakowska A, “Fifteen Years Damped AC Testing and Diagnosis of Transmission power cables”, Jicable 2019, paper D3-1.
- 60060-3: High Voltage test techniques Part 3: Definitions and requirements for on-site testing;
- Kreuger, F.H., Industrial High DC Voltage. Delft University Press, 1995, pp. 1–34;
- Dissado, L.A., C. Laurent, G.C. Montanari and. P.H.F. Morshuis, “Demonstrating a Threshold for Trapped Space Charge Accumulation in Solid Dielectrics under dc Fields,” IEEE Transactions on Dielectric and Electrical Insulation, vol. 12, no. 3, 2005, pp 612–620;
- Takada T., “Acoustic and Optical Methods for Measuring Electric Charge Distributions in Dielectrics,” IEEE Transactions on Dielectric and Electrical. Insulation, vol.6, no. 5, 1999, pp.519–547;
- W. Wang, D. Jiang, W. Dong, Z. Ning, J. Xiong and G. Du, "The Effect of Charge Rate on Space Charge Accumulation in Damped Alternating Current (DAC) Testing for Power Cable," 2018 IEEE International Conference on High Voltage Engineering and Application (ICHVE), 2018, pp. 1-4, doi: 10.1109/ICHVE.2018.8642249;
- Bodega, R., Space charge accumulation in polymeric high voltage DC cable systems, ISBN 90-8559-228-3;
- IEEE Std 400.2™, IEEE Guide for Field Testing of Shielded Power Cable Systems Using Very Low Frequency (VLF) (less than 1Hz);
- M. Wild, S. Tenbohlen, E. Gulski, R. Jongen, “Basic aspects of partial discharge on-site testing of long length transmission power cables”, IEEE Transactions on Dielectrics and Electrical Insulation. 2017
- Seitz PP, Quak B, Gulski E, Wild M, de Vries F, “Long lengths transmission power cables on-site testing up to 500 kV by damped AC voltages”, Jicable 2015
- Wester FJ, Condition assessment of power cables using partial discharge diagnosis at damped AC voltages, ISBN 90-8559-019-1.
- E. Gulski, R Jongen, “Condition-based Maintenance of Transmission Power Cables”, IEEE Transactions on Power Delivery, 2021.
- E. Gulski, G. Anders, R. Jongen, J. Parciak, J. Sieminski, E. Piesowicz, S. Paszkiewicz, “Discussion of Electrical and Thermal Aspects of Offshore Wind Farms Power Cables Reliability”, Renewable and Sustainable Energy Reviews, 2021
- P. P. Leufkens, Cable Testing: State-of-the-Art, Standards & Technological Developments, Proceedings of INMR World Congress (INMR 2022), 16-19 October 2022, Berlin, Germany.
- R. Corjanus, M. van Riet, S Staarink, Testing High Voltage Cable Without Ageing the cable Itself, Proceedings of INMR World Congress (INMR 2022), 16-19 October 2022, Berlin, Germany.
- M. A. Pangah, H.S. Abd Halim, Condition Assessment of Long Length Medium Voltage Underground Cable Using Dual Side Offline, Partial Discharge Measurement, Proceedings of INMR World Congress (INMR 2022), 16-19 October 2022, Berlin, Germany.
- CIGRE Technical Brochure 751, Electrical properties of insulating materials under VLF voltage, 2018
- Bach R.; Müller D.; Walter C.; Strake P, Comparative investigations of PD behaviour on anartificial accessory failure under medium test voltage AC, damped AC (DAC) and 0,1-Hz-VLF, IEEE, 2020, Berlin, Germany, ISBN:978-3-8007-5353-6
- Bach R.; Müller D.; Peck N, Detectability of internal partial discharges at an artificial reference failure under different types of on-site test voltages, VDE Hochspannungstechnik 2022, Berlin, Germany, ISBN 978-3-8007-5978-1.
- J. E. Hagen, Romladningsdistribusjon i lagdelt XLPE HVDC kabelisolasjon (in Norwegian), MSc, Dept. of Electric Power Eng., NTNU, Norway, 2014.
- CIGRE Technical Brochure 728, On-site Partial Discharge assessment of HV and EHV cable systems, 2018