Forecasting of Domestic and Commercial Power Demands using Machine Learning for LESCO Region in Pakistan
Authors
Hafiz Arslan MANZOOR - Lahore Electric Supply Company, Pakistan
Manzoor ELLAHI - Department of Electrical Engineering, The Superior University, Lahore, Pakistan
Saif Ur REHMAN - School of Advanced Technology, Xi'an Jiaotong-Liverpool University (XJTLU)
Muhammad Zeeshan BABAR - School of Engineering and Physical Sciences, Heriot-Watt University, Edinburgh, United Kingdom
Waqas ARIF - Department of Electrical Engineering Technology, National Skills University, Islamabad, Pakistan
Ahmed SAEED - Aarab Contracting Company, Kingdom of Saudi Arabia

Summary
This paper presents a machine learning-based model for load forecasting by the Lahore Electric Supply Company (LESCO). The specific electrical load data in the LESCO region were trained through ML to achieve optimal predictive solutions through multiple training mechanisms. LESCO is the largest power distribution company in Punjab, Pakistan and handles both domestic and commercial loads. The main problem with LESCO is its manual system for handling load recording, which results in poor load management and consequent forced load shedding. The model proposed in this study works on real-time electrical data collection and the application of the Long Short-Term Memory (LSTM) algorithm for forecasting. The dataset comprises numerical load values over 20 years from major supply feeders in the Lahore city of the LESCO region. ANACONDA was used as a simulation platform to provide sophisticated and effective load forecasting through the training of recent data for the prediction of long-term future load demand. The examination of the accuracy and performance of the LSTM-based load forecasting model using acceptable criteria demonstrated its efficacy in gathering and forecasting complex load patterns. The traditional load monitoring mechanisms adopted by LESCO are less efficient, besides, no system for accurate load estimation is currently used by the distribution companies in Pakistan. The proposed LSTM based model can provide efficient load prediction addressing the issues of energy management and avoid forced load-shedding.
Keywords
ANACONDA, Energy Management System, Load Forecasting, Long-Short Term Memory, Machine LearningNomenclature
ARIMA | Autoregressive Integrated Moving Average |
ANFIS | Adaptive Neuro-fuzzy Inference System |
ANN | Artificial Neural Network |
CNN | Convolutional Neural Network |
DSM | Demand Side Management |
DL | Deep Learning |
EMD | Empirical Mode Decomposition |
ENN | Ensemble Neural Network |
ICT | Information and Communication Technology |
IRRHEM | Intelligent Reasoning Rules for Home Energy Management |
LESCO | Lahore Electric Supply Company |
LF | Load Forecasting |
LSTM | Long Short-Term Memory |
LMA | Levenberg-Marquardt Algorithm |
MAPE | Mean Absolute Percentage Error |
ML | Machine Learning |
MLR | Multi Linear Regression |
NN | Neural Network |
PSO | Particle Swarm Optimization |
RMSE | Root Mean Square Error |
RNN | Recurrent Neural Networks |
STLF | Short Term Long Forecasting |
SVM | State Vector Machine |
1. Background and Motivation
1.1. Context and Motivation
Despite being a promising energy source, nuclear, solar, and wind power cannot currently meet the world's demand for electricity, either now or in the future. Numerous studies, including load forecasting, have been conducted to fulfill the necessary electricity demand throughout the year. It is necessary to accurately forecast the power demand ahead of time. Several projections are available for various load types. Forecasting the demand for a brief period of time, such as a few days or hours, is the first form of prediction. While the second form of forecast estimates desires from just a few weeks to a few months, the third type of project requires from a few months to several years. In order to exploit these predictions, live for efficient energy management, this proposal tackles the fundamental concept of load forecasting utilizing Machine Learning algorithms in a power distribution company context. The ML techniques have the capability to manage and analyze large datasets, understand the complex patterns in electrical load data and explore the information available in them, provide precise and timely load estimations in contrast to the conventional forecasting approaches. Besides, the developing country like Pakistan require accurate load prediction for effective load management, avoid load-shedding and ensure smooth power supply to the consumers. Owing to the evolution of the information sector, conventional electricity transmission and distribution systems have become smarter [1]. Smart grids are responsible for two-way digital communication. The most important technique for the home energy management system is Demand-side Management (DSM). To reduce the electricity demand and load peaks, the energy user can change his/her consumption upon some incentives, and this is all done in the DSM.
Amidst the transition towards intelligent energy management systems, the role of machine learning, artificial intelligence, and burgeoning 5G technology cannot be overstated. As elucidated by the authors of [2], these technological advancements offer a robust framework for the automation and optimization of smart buildings and energy systems. This combination not only improves the operational efficiency that can assist in highlighting practices for better energy management that are important in addressing the issues arising in distribution companies like Lahore Electric Supply Company (LESCO).
The Table 1, shared immediately after the abstract provides with all the necessary abbreviations used in this paper.
1.2. Problem Formulation
Both forecasting load and language translation use recurrent neural networks (RNNs), a category of neural networks designed for sequential input. RNNs are highly suited for simulating temporal behavior because of their internal configuration (memory) and ongoing connections to equivalent neurons in the preceding time step. RNNs are usually taught over time; however, this method might result in a problem called vanishing gradients, which causes the NN to forget prior knowledge, particularly for lengthy sequences. This problem has been solved by the development of Long Short Term Memory (LSTM) algorithms, which are able to retain knowledge for a greater amount of time and produce forecasts that are more precise [3,4].
In the context of sequential data processing, the flexibility and ability of LSTM networks to solve the vanishing gradient problem demonstrates how well they can manage long-term dependencies. The authors of [5] highlighted the versatility of LSTM in load forecasting as well as public health analytics by demonstrating these capabilities across multiple domains, most notably in predicting COVID-19 case trends. Because of its versatility, LSTM is positioned as a key component of our approach to improving LESCO's load management system, offering a notable improvement in forecasting accuracy and dependability.
The traditional approach for electric load supply and forecasting future load demand is shown in Figure 1.
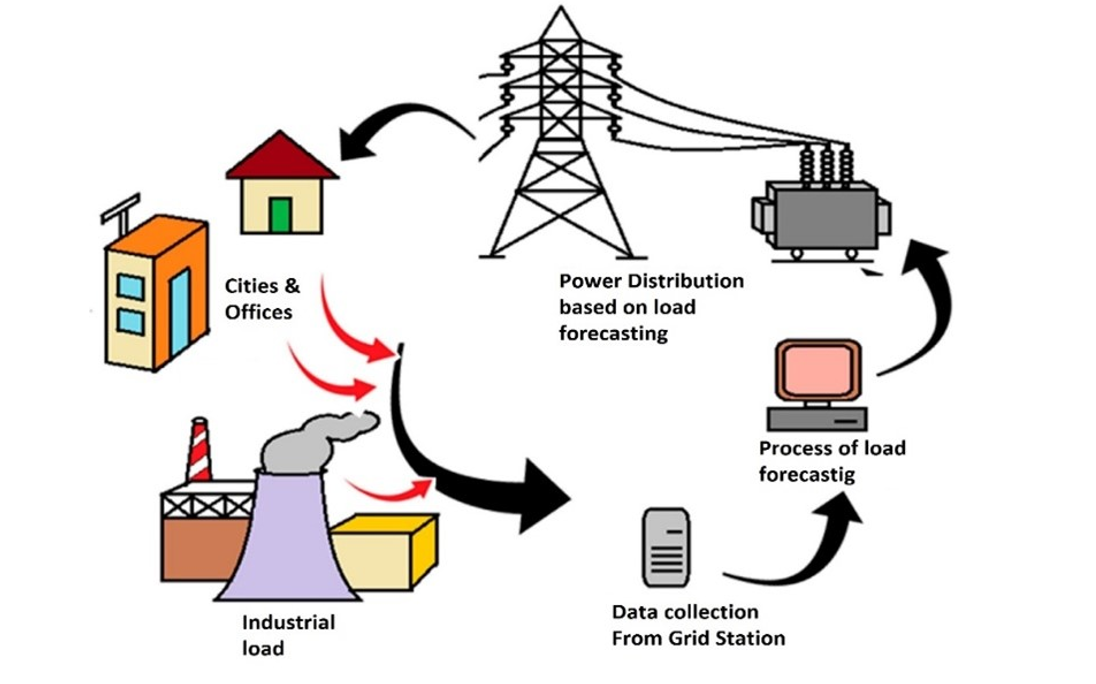
Figure 1 - Mechanism of Load Supply and Forecasting
The current electrical power system of Pakistan suffers from the following issues,
- Sudden increase in load (Forced Load shedding)
- Damage to equipment
- Tripping problem
- Loss of power (Energy)
- An exponential increase in load requires planning on the source side (Real-time Load forecasting)
- In Pakistan, such solutions for future planning are still in the process of development.
1.3. Research Approach
From the outset of our data collection process at LESCO grids, the significance of optimizing and filtering data to preserve their integrity while eliminating redundancy becomes paramount. Drawing upon the methodology adopted by the authors of [6] in their exploration of load management and optimal sizing for special-purpose microgrids, we aim to employ a similar two-stage PSO-fuzzy-based approach. The PSO effectively navigates the solution space, while the fuzzy logic manages vagueness and roughness in the data, making the methodology adaptable and robust. By embracing this two-stage model, the target was to achieve the theoretical benefits like improved accuracy in load forecasting, better operational efficiency and assistance in better decision making for future when implemented to resolve energy management issues of LESCO. Besides, this technique can assist in avoiding forced load-shedding through improved predictive accuracy of our load forecasting model. By incorporating these advanced analytical techniques, we ensured the relevance and reliability of the data being processed, thereby setting a solid foundation for subsequent ML applications.
The research approach followed for the execution of the developed methodology to achieve precise forecasting results is presented below.
- Gather real-time data from LESCO grids.
- Filter out redundant, irrelevant, and insignificant data while preserving valuable information integrity.
- Employ data analytics techniques.
- Process data using machine learning methodologies.
- Optimize LESCO data through advanced algorithms.
- Perform long-tern load forecasting through yearly estimation
- Conduct results and analysis.
The described mechanism facilitates in making significant contribution to research relevant to load forecasting.
1.4. Research Contribution
This study makes the following significant contributions to research in the field of load forecasting:
- Collection of recently available data from LESCO grids to ensure updated information is at hand for accurate load forecasting.
- Implementation of dynamic filtration through ENN to remove unnecessary and irrelevant data while maintaining the integrity of important information.
- Utilize data analysis techniques to obtain important insights and patterns from the collected data as presented in the figures 7 to 9 in the section 5 of the paper.
- Implement LSTM to process the data and enhance predictive accuracy as shown in figures 10 to 12 in the section 5 of the paper.
1.5. Structure of Paper
Section 2 presents a literature review, and Section 3 provides an overview of the techniques considered, followed by the proposed strategy elaborated in Section 4. Section 5 provides the results and discussion, followed by the conclusion and future work in section 6. The paper concludes with the cited references and dataset provided in the appendix.
2. Literature Review
In literature, several studies exist investigating load patterns. If the consumer load consumption is known, a better DSM program can be implemented [7]. Load prediction is very useful for controlling electricity consumption [8]. Consumers’ expected behavior helps in real-time decision making. User awareness of daily energy usage is also helpful. But beside from all these things many factors are present that can affect the consumption and create problem for DSM.
The application of Intelligent Reasoning Rules for Home Energy Management (IRRHEM), as described by the authors of [9], stands out among the several tactics investigated to enhance energy efficiency and control demand. This strategy, which is based on a case study in Algeria, uses artificial intelligence to maximize daily electricity usage by encouraging the use of natural resources and warning people not to waste energy. This study emphasizes the potential for large energy savings and improved operational efficiency within the smart home domain by integrating the norms of intelligent reasoning. This case study sheds light on the wider relevance of these developments in DSM and energy management, which is helpful for our investigation into how to optimize LESCO's load forecasting and management procedures.
To build an accurate and precise DSM control system, an accurate load prediction is necessary. The system efficiency is disturbed owing to inaccurate weather predictions, and it is underestimated or overestimated [10]. If the load prediction is underestimated, then there must be a chance for the unavailability of load demand, which can cause a system outage.
On the other hand, overestimation can increase the system capacity but reduce the economic efficiency. In [11], an optimizing algorithm based on scheduling was presented. This algorithm increases profit and efficiency. This study focuses on this because it reduces energy costs and increases profits for suppliers and users. An empirical study in [12] was also conducted to reduce the energy cost on the user side. Two side benefits can be obtained to implement this management system.
The issue of parameter approximation in NNs for predictions based on time series mechanisms with random noise, outliers and noting the unreliability of the l2 loss minimization. To enhance the precision, the authors in [13] proposed an adaptive rescaled loss function, “lncosh” that has the ability of dynamically switching between loss values 1 and 2 (l1, l2), and Huber losses based on a modifying parameter, predicted through operational “likelihood” method. The authors develop a regression model, robust adaptive rescaled lncosh NN (RARLNN) having better forecasting efficiency. The designed algorithm works through an iteratively learning approach that filters the tuning parameter, and a new estimation approach, based on quantile theory is presented. Using the RARLNN model for wind speed estimation, the study shows better precision and permanence, especially in handling outliers and noise.
It is a significant requirement from the power systems to manage the load demand while considering the customer habits and geographical conditions through hierarchical structures. Conventional mechanisms frequently ignore the mentioned factors, and this approach leads to less precise estimations. The paper [14] presents iterative decompose-cluster-feedback technique, upgraded from the CLC approach that uses EMD to disintegrate load and its sub-series based on amplitude-frequency characteristics. The authors tested the proposed technique for three real hierarchical load prediction tasks, and it showed a better performance of at least 52% over TD-MLP and TD-LSTM-SDE methods, 43% over SVR-BU, and 32% over several middle-out methods.
Standard load estimation techniques are exposed to cyberattacks, risking system blackouts that lead to major economic losses. To overcome this, robust predictive algorithms having data-driven tuning parameters are significant to identify and manage outliers effectively. The paper [15] proposes an adaptive trimmed regression method that enhances outlier detection and forecasting accuracy, demonstrating superior performance over fixed tuning parameter approaches.
The authors in [16] addressed the issue of cyberattacks on load forecasting mechanisms that lead to erroneous estimations and higher operational expenses in the power industry. Conventional robust regression algorithms suffer from reduced efficiency against symmetric attacks. To reduce the impact of these attacks, authors presented an asymmetric robust regression technique namely “asymmetric bisquare regression”, developed to manage mixed cyberattack-resilient load forecasting. This approach introduces two tuning parameters to discipline the positive and negative impacts of attacks individually. The comparative analysis shows the better performance of the proposed model against the available robust statistical regression methods in reducing the impact of mixed cyberattack.
Load prediction depends on the dependent variables. When the data are in bulk, there is a need for a good and advanced technique. The single act of the consumer created his/her energy usage profile. A forecasting technique can be developed to track these patterns [13]. The LSTM showed better results. In electricity load forecasting, LSTM proved to be the best. Experimental work was conducted to determine the optimal configuration. This model is beneficial for both energy users and providers. This can be used in smart districts for effective DSM techniques. System operators can also use this information to predict future consumption. This study contributes to the field of load forecasting, as shown in Table 2.
Sr. | References | Key contribution | Techniques | Limitations |
|---|---|---|---|---|
1. | [14] | Data-driven load forecasting of air conditioners using an ANN based on the Levenberg-Marquardt algorithm for demand response | (LMA)-based Artificial Neural Network (ANN) | Quite complicated because no strategy was utilized to remove unnecessary data |
2. | [26] | Using data from smart meters, online adaptable recurrent neural networks can forecast loads. | Adaptive Recurrent Neural Network | The buffering module's goal is to locate and temporarily hold batches where the model failed to deliver. |
3. | [3] | Online adaptive recurrent neural networks are able to forecast loads using input from smart meters. | Parallel Deep LSTM- CNN and ML Techniques | The findings may vary depending on the weather. The load one was predicted using the previous consumption as a parameter. |
4. | [20] | Machine learning-based short- and long-term electric load forecasting | Machine Learning | Complexity of the used models' computations |
5. | [21] | Understanding error calculation techniques in the context of energy forecasting | A Novel related to Errors | Underestimating the situation and failing to make sufficient preparations. using multiple dimensions to forecast performance. |
6. | [22] | Smart meter data and deep learning for load forecasting: Online Adaptive Recurrent Neural Network | Deep Learning | The buffering module's goal is to locate batches for which the model could not effectively perform and temporarily store them. |
3. Overview of the Considered Techniques
The proposed model for LESCO LF uses the LSTM-based choice of features approach and recommended integration strategy. The majority of publications in the scientific literature have used AI methods to boost MAPE accuracy rates, including SVM, ANFIS, evolution computing, trained systems, fuzzy logic, and LF-related problems. Because of their sluggish processing times and complexity due to the amount of data they use, these solutions are limited. The removal of redundant and irrelevant information without affecting the most important data is an essential step in LF. Table 3 presents a symbolic representation of LSTM.
Utilizing cutting-edge algorithms to optimize LESCO's data, our methodology reflects the creative tactics emphasized by the authors of [18] have emphasized. They emphasized the significance of choosing the most efficient methods and tools to produce ideal configurations in their clever solutions for the optimization of hybrid energy systems. This realization is critical to our study because it highlights the need for advanced yet effective techniques to increase the predicted accuracy of the load forecasting model. In light of this, we utilize their research to guide the choice and implementation of machine learning techniques, guaranteeing that our model not only forecasts future load demands more accurately, but also makes a valuable contribution to the more intelligent use of energy resources.
| Symbols | Description |
|---|---|
ht | Hidden Gate |
ot | Output Gate |
xt | Input Vector |
it | Input Gate |
og | Sigmoid Function |
tanh | Hyperbolic Tangent Function |
Input Modulation Gate |
When delving into the nuances of using machine learning techniques for load forecasting, it is imperative to remember how critical cybersecurity is to a smart grid system. We are reminded of the potential vulnerabilities in our system by drawing on ideas from the authors of [19], who painstakingly examined cybersecurity attacks and suggested blockchain and machine learning solutions for the smart grid. This acknowledgement directs our first preparations, ensuring that our proposed strategy for LESCO is based on a foundation that prioritizes data and infrastructure protection, in addition to predictive accuracy. Such all-encompassing cybersecurity safeguards are necessary to protect real-time data collection and analysis, on which our load forecasting model depends.
3.1. Recurrent Neural Networks (RNNs)
For networks whose directed graph does not contain cycles, a typical neural network methodology, known as feedforward, is used. RNNs, however, are networks containing cycles in their graphs. Even though an RNN seems to have a completely unique structure, if the cycle is unrolled, it may be regarded as a collection of identical networks that are all copies of one another and deliver messages to their respective successors [4]. Figure 2 depicts an unrolled RNN diagram, where A denotes the repeating section of the NN and is an input that yields the output.
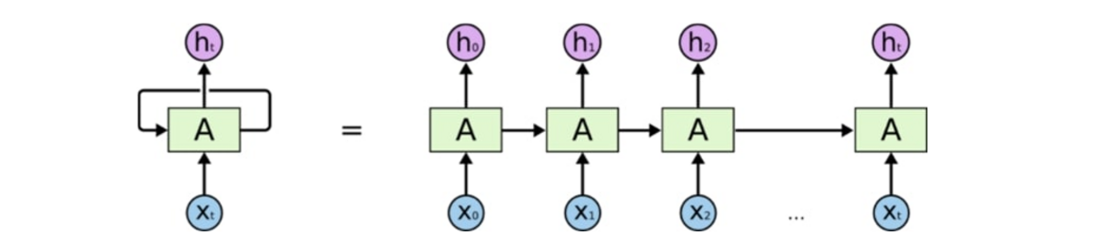
Figure 2 - Unrolled Recurrent Neural Network
In contrast to what people think, feed-forward neural networks begin each activity from the beginning. The results of many sequences and list-related problems can be improved by making use of the prior states. By allowing information to be transferred from one network phase to the next, RNN accomplishes information persistence between instances. These models include specific application examples that utilize temporal series issues, and the recurring feedback in these instances takes advantage of the temporal relationship between the data.
3.2. Long Short-Term Memory Neural Networks
Simple RNNs can theoretically handle "long-term dependencies. The authors of [21] suggested LSTM Networks, a type of RNN that can memorize information for extended periods of time, as a solution to this issue. The LSTM differs from a standard RNN in its repeated module construction. For example, in typical RNNs, this repeating module consists of a single hyperbolic tangent layer. As shown in Figure 3, LSTMs feature four neural network layers as opposed to just one.
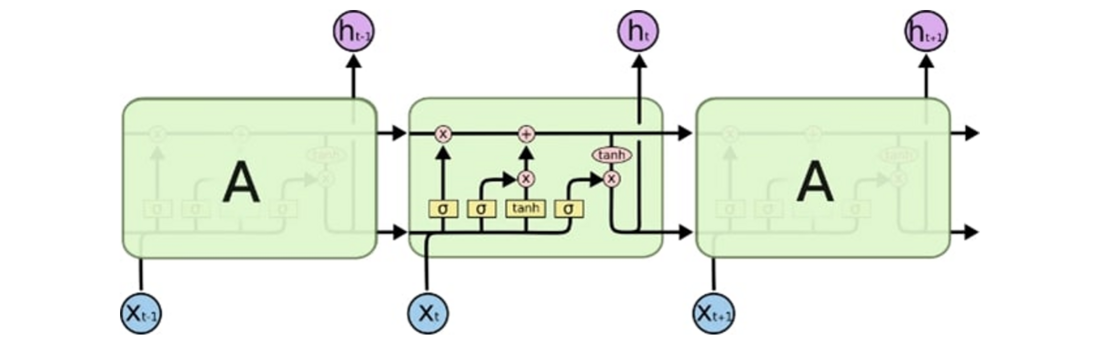
Figure 3 - Long Short-Term Memory Layers
The syntax in Figure 4 simplifies the understanding of the schemas. The main distinctiveness of LSTMs is the two recurrent connections in the repeating module. In addition to the typical recurrent connection present in RNNs, LSTMs use the output of the prior prediction. The storage of cumulative data is made possible by this cell state, which allows a small number of linear interactions to change the data throughout each execution. To understand the internal behavior of the LSTM, there are four steps.

Figure 4 - Notations of LSTM Layers
LSTMs are nothing more than stacks of neural networks with linear layers composed of weights and biases, similar to any other traditional neural network.
In essence, an LSTM cell consists of 4 distinct parts,
i) Forget Gate:
The data to be deleted from the cell state are chosen by the forget gate, which is the first part of the LSTM,
(1)
ii) Input Gate:
The second, referred to as an input gate, chooses what data needs to be included in the cell state,
(2)
(3)
iii) Cell State:
An essential element that allows an LSTM system to store and update data across lengthy sequences is the cell state.
(4)
iv) Output Gate:
The output is generated in the last step, and it is a filtering description of the modified cell state.
(5)
(6)
where, xt, ht, and Ot represent the input, hidden and output states respectively. Ct, is gives the cell state while the weight of the function is given by Wf. ?? is a vector that contains values between 0 and 1 and is afresh candidate whose values depend upon input, hidden layer and tanh layer.
4. Proposed Strategy
4.1. Integration Approach
The flow chart of the proposed methodology has been demonstrated in Figure 5. The fundamental components of the LF methodology include the time series, suggested feature selection approach, and ANN method. In this step, the forecast was further optimized by lowering the root mean square error (RMSE) [15]. The area where data collection along with time-series model modeling is considered includes all methods in this regard.
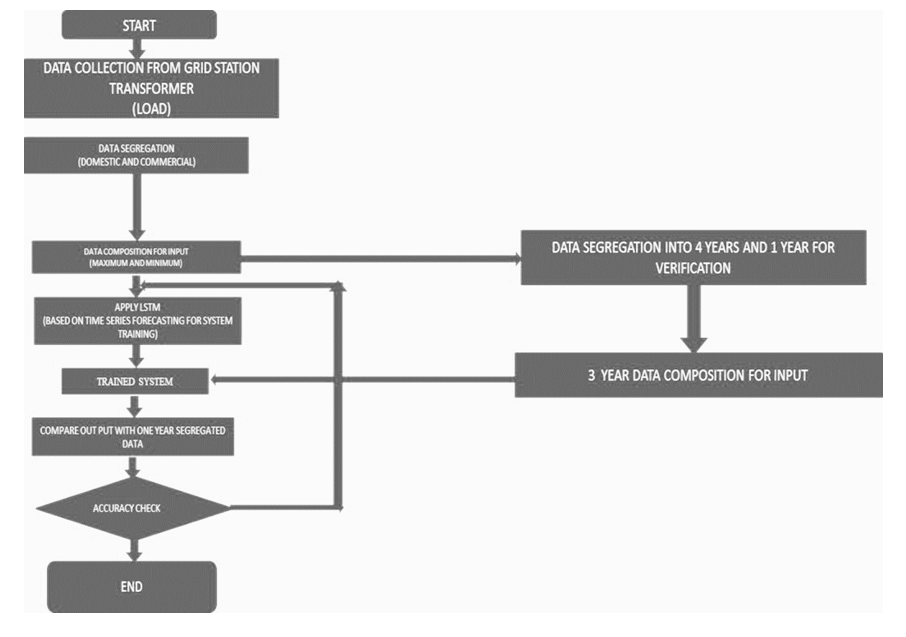
Figure 5 - Sequence of Flow Chart of Simulation
The integration approach doesn't consider twenty-year data containing four seasons, per-month data transformation, ANN, or choosing features as a final option; instead, it concentrates on the best method of the pertinent week of each season. Additionally, we modified the RMSE computations to consider the integration method that we created as follows for each specific building.
Like any AI model, LSTM networks have flaws, and a number of variables, including the caliber of the input information, selected hyperparameters, and network size, can influence their effectiveness. A further challenge when developing LSTM networks is the potential for overfitting, which can significantly reduce accuracy.
LSTM networks have been demonstrated to be extremely potent and effective tools for a range of machine learning applications, particularly for natural language processing. Although some issues still need to be resolved, continuous research is anticipated to further improve the precision and effectiveness of these models.
Table 4 provides a more thorough description of the algorithm, which was validated using a 5-year LF artificial neural network. The goal of this integration is to identify the false data points. Once the root average square error for each set of data has been determined, a workable solution should be developed. More precise data should then be sent to the hardware. The simulation results show that the proposed five-stage LSTM model, which incorporates current data as the input for the error-correcting function, has an acceptable RMSE of less than one.
| Steps | Proposed Algorithm |
|---|---|
1 | Set the hidden state and cell state to 0. |
2 |
|
3 |
|
4 | As the output, give the hidden state sequence . |
5 | Plot the Figures of LSTM Prediction |
6 | Plot the Figures of Future Values |
Evaluation of the LSTM for Load model, measuring the model's precision in forecasting a LESCO Data's LF based on input features such as power, involves forecasting prediction.
The evaluation metrics to be utilized are determined by the specific situation and type of data being used. The equation for the RMSE is [23-25]:
(7)
where N is the total number of cycles, Cn is the predicted capacity, and Cn is the ground-truth capacity.
Preparing the data is the initial stage in assessing the LSTM model. To achieve this, the data must be cleansed, divided into sets for training and testing, and arranged so that the LSTM algorithm can be used. To help the model better identify trends in the data, the data should be standardized. The data from the dataset is divided into testing, confirmation, and training datasets to assess the utility of the LSTM model as a load prediction tool. The desired variables and input attributes are used in a training dataset to train the LSTM model. The LSTM model's hyperparameters are adjusted using the validation dataset, and the model's training effectiveness is evaluated. The training LSTM model's final performance is assessed using the testing dataset.
The system utilized the test data to predict the information from the load after training the LSTM model, and we then compared the values that were predicted with the actual values. The effectiveness of the LSTM model was then assessed using various indicators, including the RMSE. A successful LSTM model for data prediction should have low RMSE values and high R-squared and accuracy values. If the LSTM model's performance is unsatisfactory, its hyperparameters can be changed, or several LSTM architectures can be tested to improve the performance. The overall model is depicted as follows, with examples of various LESCO Data inputs.
In summary, the LSTM cell receives an input vector and the previous hidden state at each time step and then modifies the memory cell and concealed state based on the input, forget, and output gates. The hidden state functions as short-term memory that selectively accesses information from the memory cell, while the memory cell serves as a long-term store for pertinent data. Figure 6 depicts the overall procedure.
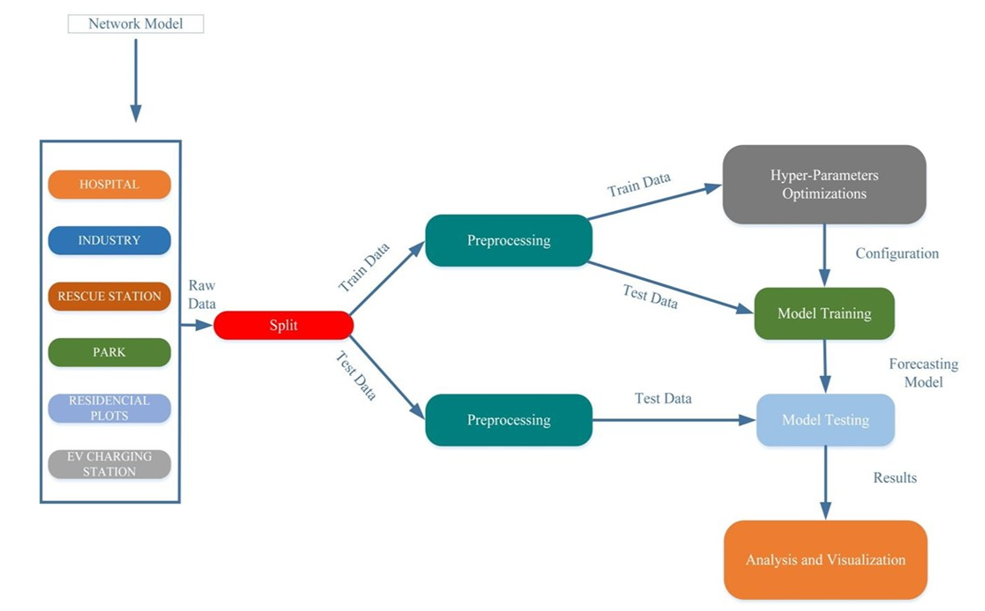
Figure 6 - Data Flow Between Different Parts of the Developed Project
An essential part of evaluating an LSTM model is choosing the loss function. The difference between the anticipated and actual output of the model is computed using the selected functions. Three types of loss functions that can be used to LSTM models include cross-entropy loss, mean error values. Between expected and actual output, RMSE calculates the average squared difference, and the proposed model operates in the manner given in figure 6, after which the data can be pre-processed for feeding it for further working.
4.2. Mathematical Modelling of Proposed Model
Mathematically, each LSTM layer is a collection of interconnected cells that perform various operations involving the input, output, and memory states. Here, is a simplified mathematical representation of the LSTM cell. Given:
- Xt is the input at time step t.
- ht is the hidden state at time step t.
- Ct is the cell state at time step t.
- ft, ??, and ?? are the forget, input, and output gates, respectively.
- W, U, and b are the weights and bias terms of the gates and transformations, respectively.
- σ is the sigmoid activation function and tanh is the hyperbolic tangent activation function.
(8)
(9)
(10)
(11)
(12)
(13)
Where:
- W are the weights for the gates.
- B is the bias
- ℎ?−1 represents the concatenation of the previous hidden state. The epoch size was 1000 and the batch size was 10.
4.3. Data Collection and Analysis
The electrical load data are gathered to show how differently the load in LESCO Data operates to validate long-term load forecasts. The quantity of load monitored and sent alongside the system varies depending on the day. The load datasets for different electrical feeders of LESCO are presented as supplementary files along with this article. The dataset is based on the information received from the national grid and local distribution company, and it contains the values for both working days and holidays. It is also understandable that the load consumption during vacations is lesser than the routine, as it can be seen from Figure 10 which shows an initial dip and smaller rise during the period of Covid-19, (2020-22).
5. Results and Discussion
Different load data are collected to demonstrate the difference in the LESCO load operation to check the average values of the short-term load forecasting as shown in Table 5. Different days have different load amounts on which the data are monitored and sent next to the system. The results for load forecasting are obtained on hourly basis and then these values are averaged over the year to show them in presentable form for pictorial and numerical representations.
Now, we first discuss the data of residential plots, as shown in Figures 7, 8, and 9, and discuss its yearly consumption data, LSTM predicted long-term data, and Forecasted Data.
| Sr | Date | Residential Plot (W) | Industry (W) |
|---|---|---|---|
0 | 01/01/2002 | 5715 | 6452.32 |
1 | 02/01/2002 | 5641 | 6245.43 |
2 | 03/01/2002 | 5113 | 5211.41 |
3 | 04/01/2002 | 5258 | 3236.12 |
4 | 05/01/2002 | 5456 | 3778.47 |
5 | 06/01/2002 | 5651 | 3897.7 |
The mentioned Figures 7, 8 and 9 are for the residential load and they are extracted using the domestic load (taken from incoming T2) mentioned in the tables given in the Appendix (i.e. A1-A24). The consumption shows a very small rise over the mentioned period, due to rise in dependency on rooftop solar PV systems, installed due to longer outages and high prices of electricity.
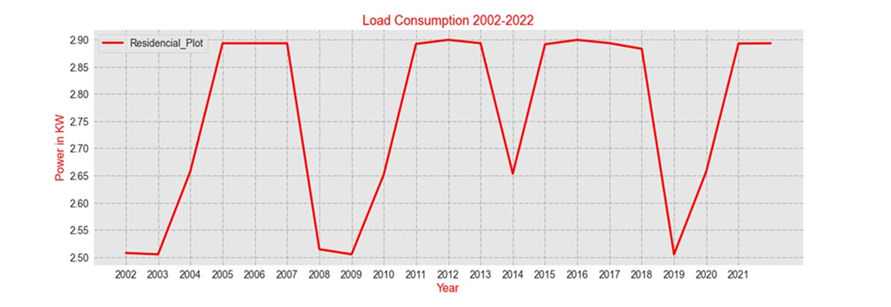
Figure 7 - Yearly Consumption Data of Residential Plots
Initially, the system takes data of 21 years, in which 16.5 years of data should be trained, and the remaining data should be tested. Figure 8 shows that the prediction should be based on 5.5 years for the next 10 years. Overlapping indicates predicted data.
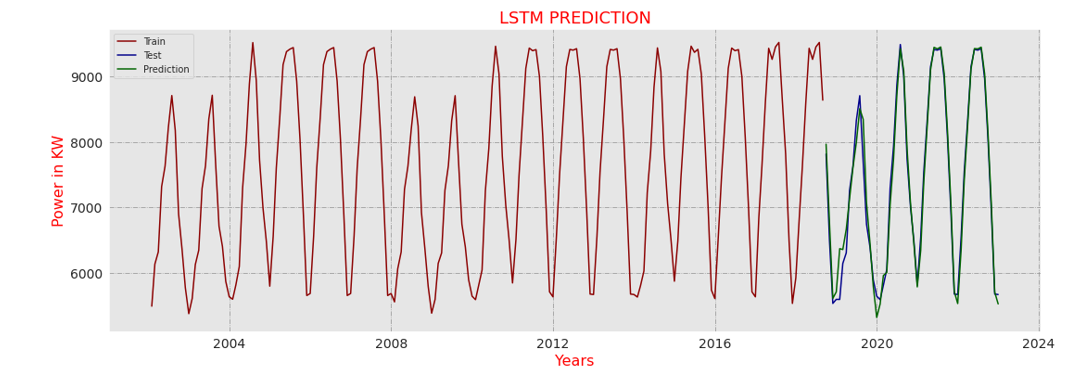
Figure 8 - LSTM Predicted Data
Figure 9 shows the forecasted values for the 10 years, the dotted line represents the Future Values, and the simple line shows the Original Data. This is how the LSTM predicts the data.
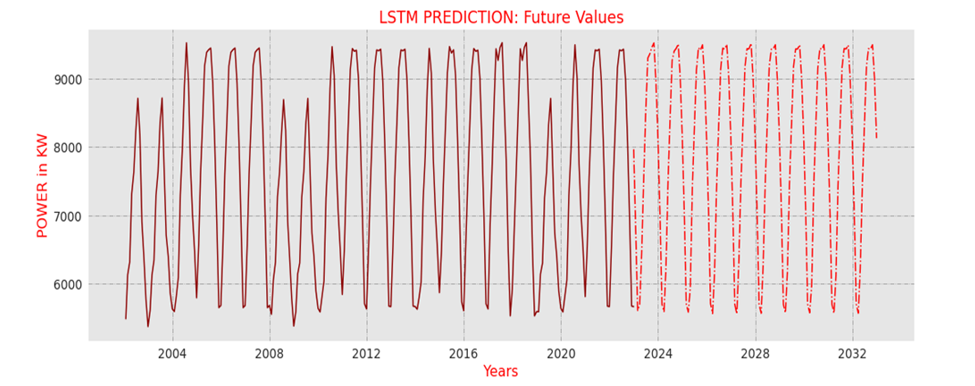
Figure 9 - Original Data Vs Forecasted Data
We now discuss the data industry, as shown in Figures 10, 11, and 12, and discuss its Yearly Consumption Data, LSTM Predicted Data, and Forecasted Data. The mentioned Figures 10, 11 and 12 are for the industrial load and they are extracted using the industrial load (taken from incoming T1) mentioned in the tables given in the Appendix (i.e. A1-A24).
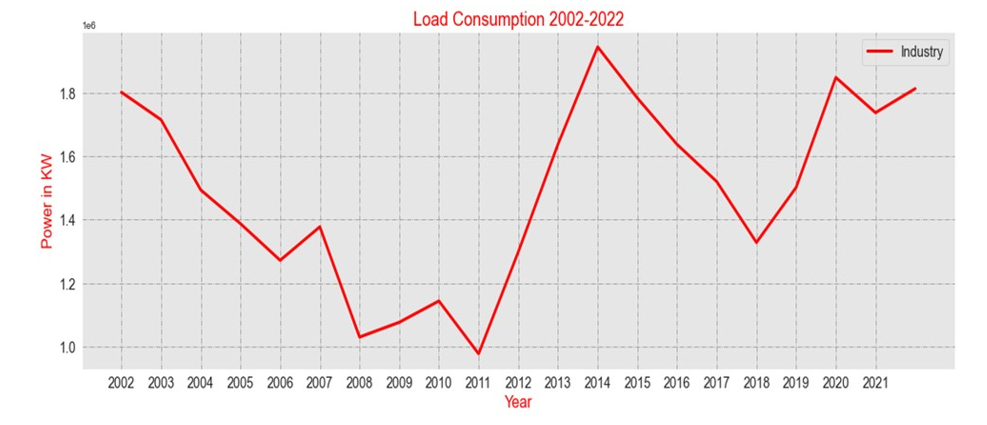
Figure 10 - Yearly Consumption Data of Industry
First, we take 21 years of data, in which 16.5 years of data should be trained, and the remaining data should be used for testing the performance of the designed model. Figure 11 shows that the prediction should be based on 5.5 years for the next 10 years. Overlapping indicates predicted data.
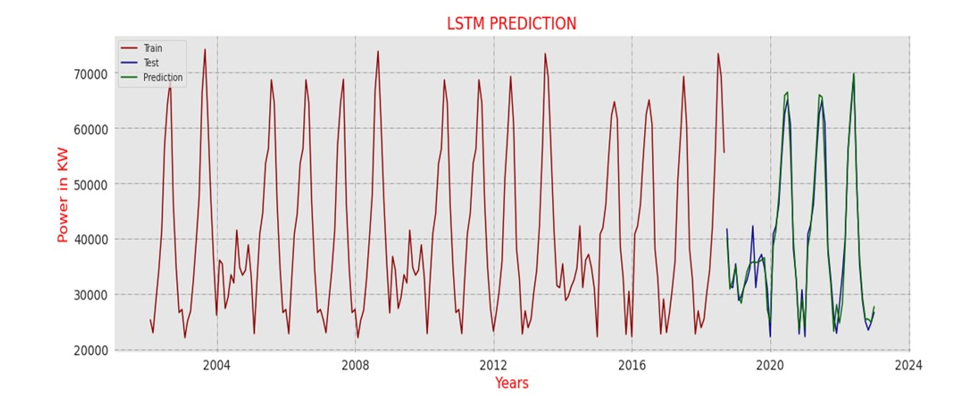
Figure 11 - LSTM Predicted Data
Figure 12 shows the forecasted values for the 10 years, the dotted line represents the future values, and the simple line shows the Original Data. This is how the LSTM predicts the data.
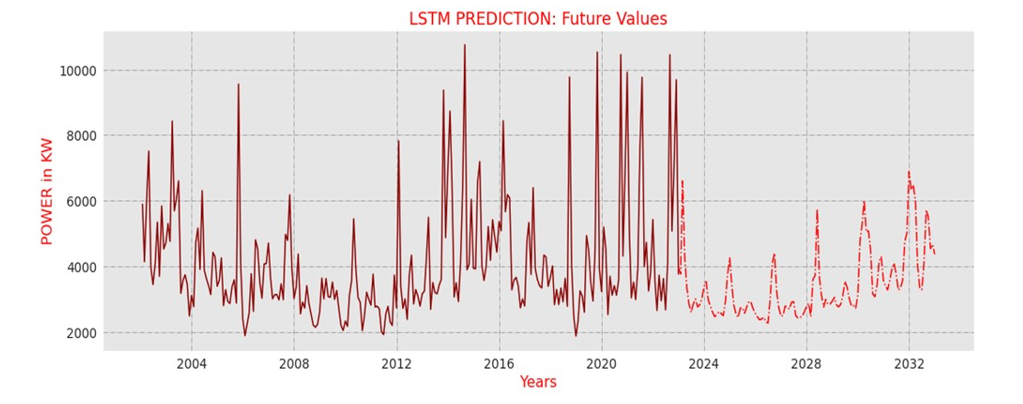
Figure 12 - Original Data Vs Forecasted Data
The Table 6 given below, shows the accuracy of the prediction of LESCO Data with RMSE and loss in the model.
| Sr | Inputs | RMSE | Loss | Accuracy (%) | |
|---|---|---|---|---|---|
0 | Residential Plots | 0.040939193257074055 | 0.0001 | 74 | |
1 | Industry | 0.09736663127160096 | 0.0014 | 77 | |
The accuracy presented in the Table 6 shows how precisely the designed algorithm works for the provided input data, while the loss shows the information lost while training the model for both residential and industrial datasets. RMSE shows the difference between the actual and forecasted electrical load values for the considered datasets.
Forecasting the load of LESCO Data is a critical task, as it helps in the efficient planning and utilization of resources. With the increasing population and adoption of new technologies, the load on a city's power grid can fluctuate significantly. The LESCO Data power system should be able to handle this variation in demand while maintaining reliability and stability. To forecast the load, data from various sources, such as weather patterns, population growth, industry and commercial development, and energy consumption trends, need to be analyzed. Machine learning models and algorithms can be applied to these data to predict the load for different timescales from minutes to months. With accurate load forecasting, LESCO Data can optimize power distribution and management systems, reduce energy costs, and enhance the overall efficiency of the power grid. It is an essential aspect of building sustainability and LESCO Data that can provide a high quality of life for its residents.
6. Conclusion
This study presents an AI-based energy management system for LESCO, with a particular emphasis on load forecasting. The results show how well LSTM performs in precisely forecasting the energy loads in the LESCO setting.
The importance of load forecasting in the context of LESCO energy management is the first point we looked at. Accurate load forecasting is crucial for the cost reduction and optimization of energy generation, distribution, and consumption. Typically, traditional forecasting methodologies fail to accurately capture the complex and dynamic nature of energy load LESCO. Consequently, we used the LSTM deep learning algorithm, which is renowned for its capacity to recognize temporal correlations and patterns in sequential data.
We observed encouraging results in load forecasting through the use and assessment of an LSTM model. The LSTM model successfully learned the historical load patterns and produced precise forecasts for upcoming load requirements. The algorithm showed enhanced accuracy compared with traditional forecasting methods by including weather data, time of day, and historical load statistics.
In conclusion, the use of AI, in particular LSTM, for load forecasting in the context of smart cities demonstrates promising outcomes in the improvement of energy management. Future research is required in several areas, including the incorporation of real-time data, hybrid model exploration, energy strategy optimization, demand-side management promotion, and scaling issues.
6.1. Future Work
There are several opportunities for further research and development, even though this study demonstrates a strong AI-based energy management system using LSTM for load forecasting.
- By combining real-time data sources, such as weather updates, traffic patterns, and energy usage data from smart meters, load forecasting models can become more accurate and responsive.
- By exploring the potential of hybrid models that integrate LSTM with different machine learning approaches, such as ARIMA, SVM, or ensemble methods, the accuracy of load forecasting may be improved.
- These future improvements can enhance the predictive precision for advanced power systems that incorporate RESs
- LESCO’s data energy management system can benefit considerably by investigating optimization options to reduce energy expenditure and maximize energy efficiency based on load estimates.
- By examining demand-side management tactics and financial incentives to support energy efficiency and load shifting, the demand for energy and supply in LESCO Data can be balanced.
- It is critical to consider scalability and resource allocation for AI-based energy management systems, as smart cities continue to grow and expand, especially for modern RES based power networks.
- Future models can be designed to perform dual prediction,
- Initially for the resource (solar or wind) estimation to find the probable generation that can be extracted from them.
- Secondly, the model can perform load forecasting to identify the power demand and the supply that can be extracted. Such models can greatly enhance the operational efficiency of future power grids.
Appendix
References
- D. G. Costa et al., “A Survey of Emergencies Management Systems in Smart Cities,” IEEE Access, vol. 10, pp. 61843–61872, 2022, doi: 10.1109/ACCESS.2022.3180033.
- B. Farsi, M. Amayri, N. Bouguila, and U. Eicker, “On Short-Term Load Forecasting Using Machine Learning Techniques and a Novel Parallel Deep LSTM-CNN Approach,” IEEE Access, vol. 9, pp. 31191–31212, 2021, doi: 10.1109/ACCESS.2021.3060290.
- B. Farsi, M. Amayri, N. Bouguila, and U. Eicker, “On Short-Term Load Forecasting Using Machine Learning Techniques and a Novel Parallel Deep LSTM-CNN Approach,” IEEE Access, vol. 9, pp. 31191–31212, 2021, doi: 10.1109/ACCESS.2021.3060290.
- H. Shi, M. Xu, and R. Li, “Deep Learning for Household Load Forecasting—A Novel Pooling Deep RNN,” IEEE Transactions on Smart Grid, vol. 9, no. 5, pp. 5271–5280, Sep. 2018, doi: 10.1109/TSG.2017.2686012.
- D. Mills, S. Pudney, P. Pevcin, and J. Dvorak, “Evidence-Based Public Policy Decision-Making in Smart Cities: Does Extant Theory Support Achievement of City Sustainability Objectives?,” Sustainability, vol. 14, no. 1, Art. no. 1, Jan. 2022, doi: 10.3390/su14010003.
- “LESCO - Load Shedding/Shutdown Schedule.” Accessed: Jul. 08, 2025. [Online].
- “As the Chorus of Dumb City Advocates Increases, How Do We Define the Truly Smart City?” Accessed: Mar. 03, 2024. [Online].
- D. Mills, S. Pudney, P. Pevcin, and J. Dvorak, “Evidence-Based Public Policy Decision-Making in Smart Cities: Does Extant Theory Support Achievement of City Sustainability Objectives?,” Sustainability, vol. 14, no. 1, Art. no. 1, Jan. 2022, doi: 10.3390/su14010003.
- Y. Yang et al., “Robust Adaptive Rescaled Lncosh Neural Network Regression Toward Time-Series Forecasting,” IEEE Transactions on Systems, Man, and Cybernetics: Systems, vol. 53, no. 9, pp. 5658–5669, Sep. 2023, doi: 10.1109/TSMC.2023.3272880.
- “LAHORE ELECTRIC SUPPLY COMPANY (LESCO) OPERATIONAL AUDIT REPORT.” Accessed: Mar. 03, 2024. [Online].
- “From intelligent to smart cities 1 | 3 | Sm.” Accessed: Mar. 03, 2024. [Online].
- A. Al-Qarafi et al., “Artificial Jellyfish Optimization with Deep-Learning-Driven Decision Support System for Energy Management in Smart Cities,” Applied Sciences, vol. 12, no. 15, Art. no. 15, Jan. 2022, doi: 10.3390/app12157457.
- Y. Yang et al., “Robust Adaptive Rescaled Lncosh Neural Network Regression Toward Time-Series Forecasting,” IEEE Transactions on Systems, Man, and Cybernetics: Systems, vol. 53, no. 9, pp. 5658–5669, Sep. 2023, doi: 10.1109/TSMC.2023.3272880.
- Y. Yang, H. Zhou, J. Wu, C.-J. Liu, and Y.-G. Wang, “A novel decompose-cluster-feedback algorithm for load forecasting with hierarchical structure,” International Journal of Electrical Power & Energy Systems, vol. 142, p. 108249, Nov. 2022, doi: 10.1016/j.ijepes.2022.108249.
- D. VandenHeuvel, J. Wu, and Y.-G. Wang, “Robust regression for electricity demand forecasting against cyberattacks,” International Journal of Forecasting, vol. 39, no. 4, pp. 1573–1592, Oct. 2023, doi: 10.1016/j.ijforecast.2022.10.004.
- S. Zhao, Q. Wu, Y. Zhang, J. Wu, and X.-A. Li, “An asymmetric bisquare regression for mixed cyberattack-resilient load forecasting,” Expert Systems with Applications, vol. 210, p. 118467, Dec. 2022, doi: 10.1016/j.eswa.2022.118467.
- E. A. Feinberg and D. Genethliou, “Load Forecasting,” in Applied Mathematics for Restructured Electric Power Systems: Optimization, Control, and Computational Intelligence, J. H. Chow, F. F. Wu, and J. Momoh, Eds., in Power Electronics and Power Systems. , Boston, MA: Springer US, 2005, pp. 269–285. doi: 10.1007/0-387-23471-3_12.
- R. Mubashar, M. J. Awan, M. Ahsan, A. Yasin, and V. P. Singh, “Efficient residential load forecasting using deep learning approach,” International Journal of Computer Applications in Technology, vol. 68, no. 3, pp. 205–214, Jan. 2022, doi: 10.1504/IJCAT.2022.124940.
- T. Vantuch, A. G. Vidal, A. P. Ramallo-González, A. F. Skarmeta, and S. Misák, “Machine learning based electric load forecasting for short and long-term period,” in 2018 IEEE 4th World Forum on Internet of Things (WF-IoT), Feb. 2018, pp. 511–516. doi: 10.1109/WF-IoT.2018.8355123.
- S. Hochreiter and J. Schmidhuber, “Long Short-Term Memory,” Neural Computation, vol. 9, no. 8, pp. 1735–1780, Nov. 1997, doi: 10.1162/neco.1997.9.8.1735.
- R. Mubashar, M. J. Awan, M. Ahsan, A. Yasin, and V. P. Singh, “Efficient residential load forecasting using deep learning approach,” International Journal of Computer Applications in Technology, vol. 68, no. 3, pp. 205–214, Jan. 2022, doi: 10.1504/IJCAT.2022.124940.
- “Root Mean Square Error (RMSE).” Accessed: Mar. 03, 2024. [Online].
- “RMSE: Root Mean Square Error,” Statistics How To. Accessed: Mar. 03, 2024. [Online].
- “Root-Mean-Squared Error - an overview | ScienceDirect Topics.” Accessed: Mar. 03, 2024. [Online].
- M. Waseem, Z. Lin, and L. Yang, “Data-Driven Load Forecasting of Air Conditioners for Demand Response Using Levenberg–Marquardt Algorithm-Based ANN,” Big Data and Cognitive Computing, vol. 3, no. 3, Art. no. 3, Sep. 2019, doi: 10.3390/bdcc3030036.
- H. Shi, M. Xu, and R. Li, “Deep Learning for Household Load Forecasting—A Novel Pooling Deep RNN,” IEEE Transactions on Smart Grid, vol. 9, no. 5, pp. 5271–5280, Sep. 2018, doi: 10.1109/TSG.2017.2686012.
Data Availability Statement: The dataset used in this study is available from the corresponding and primary author upon request.
Biographies
Mr. Hafiz Arslan MANZOOR received the degree of bachelor and master’s in electrical engineering from The Superior University, Lahore, Pakistan in 2018 and 2024 respectively. He is currently serving as line superintend in central Lahore region of LESCO, Pakistan.
Dr. Manzoor ELLAHI received the B.S. degree in electrical engineering from University of Engineering & Technology, Lahore, Pakistan in 2010. He received his MS and PhD degrees in electrical engineering from University of Lahore, Pakistan in 2014 and 2022 respectively. He has an experience of over fourteen years in both academia and industry. Currently, he is serving as Assistant Professor in the department of electrical engineering at Superior University, Lahore Pakistan. His research interests include, renewable energy systems, their forecasting and various application, development and application of optimization techniques, EVs and BEMSs. He has more than 20 research publications in reputed journals and conferences and has also presented number of research papers at international conferences in China, Malaysia and Turkey. He is currently serving as an Assistant Professor at Superior University, Lahore, Pakistan, affiliated with Pakistan Engineering Council (PEC) as registered engineer and also an approved post-doctoral supervisor by HEC, Pakistan.
Dr. Saif-Ur REHMAN received the BSc in (Math(A+B), Phy) from BZU and B.S. and M.S. degrees in electronic engineering from Mohammad Ali Jinnah University (MAJU). He completed his PhD degree in Electrical Engineering from Capital University of Science and Technology (CUST) in 2019. He is currently working as Postdoc Researcher with Xi'an Jiaotong-Liverpool University. Also, He worked as Assistant Professor with Superior University, Lahore, where he was involved in research and teaching activities with the Department of Electrical Engineering and has more than 15 years of teaching experience. His research interests include solid state microelectronics; modeling and simulation of high-frequency and high-power FETs, and antenna design. He has more than 40 papers in reputed journals and conferences and has also presented number of research papers at international conferences in Malaysia, Thailand and KSA. He is a Registered Engineer with the Pakistan Engineering Council (PEC), Islamabad and approved supervisor from HEC.
Dr. Zeeshan BABAR is a Senior Research Fellow at Heriot-Watt University, Edinburgh, specializing in control design for autonomous robots and computer vision. He earned his PhD in Robotics and Autonomous Systems from the University of Genoa, Italy, in 2018. Following his doctorate, he worked as a Postdoctoral Research Associate at Surrey Space Center, University of Surrey, for 18 months before transitioning to industry as a Robotic Software Engineer at Airnamics, a Slovenian startup focused on autonomous robotic solutions. He later returned to academia as a Research Fellow at the University of Edinburgh for one year before joining Heriot-Watt University, where he has been contributing to advanced robotics research for the past three years.
Dr. Waqas ARIF received the B.S. and MS degrees in electrical engineering from University of South Asia, Lahore, Pakistan in 2010 and 2014 respectively. He received his PhD in electrical engineering from North China Electric Power University, Beijing, China in 2021. He has an experience of over fourteen years in both academia and industry. Currently, he is serving as Assistant Professor in the department of electrical engineering at Superior University, Lahore Pakistan. His research interests include wind turbine protection and their forecasting. He has more than 10 research publications in reputed journals and conferences and has also presented number of research papers at international conferences in China and Pakistan. He is a Registered Engineer with the Pakistan Engineering Council (PEC), and serving as an Assistant Professor in National Skills University, Islamabad, Pakistan.
Mr. Ahmed SAEED received the B.S. degree in electrical engineering from The Superior University, Lahore, Pakistan, in 2023. He is currently serving as site engineer for Aarab Construction Company, KSA. His research interests include electrical load forecasting and optimization.