Intelligent Management of Battery Charging and Discharging for Photovoltaic Systems
Authors
L. LARBI, A. BELKAID, S. HADJI, N. OUALI - Laboratoire de Technologie Industrielle et de l’Information (LTII), Faculté de Technologie, Université de Bejaia, Algérie
T. AZIB - ESTACA’LAB, S2ET Département, École Supérieure des Techniques Aéronautiques et de Construction Automobile, France

Summary
Solar photovoltaic energy plays a vital role in addressing global energy challenges due to its adaptability, scalability, and ability to meet diverse industrial and consumer demands. Compared to other renewable sources, PV systems offer long-term electricity generation without mechanical components, making them a reliable and low-maintenance option. However, their power output is inherently variable, with nonlinear voltage characteristics, leading to challenges related to intermittency. To ensure efficient energy utilization, maximum power point tracking is essential for optimizing power conversion at any given moment.
This study focuses on the simulation of a battery charging circuit incorporating MPPT to maximize power extraction from PV modules under varying solar irradiance and temperature conditions in an off-grid system. Various MPPT techniques have been developed, ranging from conventional to advanced approaches, depending on environmental factors and system requirements. This work specifically compares two widely used methods: perturbation and observation and artificial neural networks.
Keywords
Artificial neural networks, battery, maximum power point tracking, perturbation and observation, photovoltaicNomenclature
| A | Amplitude of the exponential |
| AC | Alternatif current |
| ANN | Artificial neural network |
| B | Inverse time constant of the exponential zone |
| DC | Direct Current |
| Ipv, Ibat, IL. | PV current, battery current, Load current |
| Iin | Current input |
| Iout | Current output |
| k | Boltzmann constant |
| MLP | Multilayer perceptron |
| MPPT | Maximum power point tracking |
| MSE | Mean squared error |
| Pbat | Battery Power |
| PID | Proportional-integral-derivation |
| PLoad | Load Power |
| Popt | Power output |
| Ppred | Power predicted |
| Ppv | PV Power |
| PV | Photovoltaic |
| PWM | Pulse Width Modulation |
| Q. | Battery’s capacity |
| q | Electron charge |
| Rs | Stator phase resistances |
| SOC | Battery state of charge |
| T | Temperature |
| Vb | Battery voltage |
| Vdv | Direct voltage in the DC |
| VL | Load voltage |
| Vpv | PV voltage |
| ZN-PI | Ziegler-Nichols Proportional-Integral |
| ZN-PID | Ziegler-Nichols Proportional-Integral-derivative |
1. Introduction
The rapid advancement of energy systems has led to a significant increase in the installed capacity of renewable energy sources, particularly solar power, which now exceeds 849 GW [1] globally. This expansion is largely driven by the substantial decline in solar module costs over the past decade. Due to their lack of moving components, photovoltaic (PV) systems require minimal maintenance, making them a cost-effective and scalable energy solution that has been widely adopted across various sectors.
Solar energy, which is harnessed directly from sunlight, is naturally available during daylight hours. However, integrating battery storage extends its availability beyond daytime, ensuring a continuous power supply regardless of sunlight conditions. This highlights the critical role of a PV charge controller, which facilitates efficient energy storage management and enhances system reliability.
PV charge controllers are utilized in both grid-connected and off-grid applications, including standalone street lighting [2], telecommunications infrastructure [3], and rural electrification [4]. When combined with a tracking system, the charge controller functions as a PV-MPPT (Maximum Power Point Tracking) controller, which dynamically adjusts the operating point to maximize power transfer from the solar panels to the battery charger.
By employing a multi-stage charging process, the charge controller protects batteries from potential damage caused by overcharging, overheating [5], or gas build-up. Various studies have explored MPPT algorithms for PV applications [6]-[8], however, there is limited research on their direct integration with battery charge controllers.
Existing literature on battery charge controllers primarily focuses on comparing multi-stage charging methods and evaluating different PV charge controller designs. Nonetheless, many of these controllers lack MPPT functionality, and their efficiency in managing energy storage remains underexplored. While some MPPT charge controller models have been proposed [9]- [10], they often lack comprehensive modelling and experimental validation, limiting their practical implementation. A more in-depth performance analysis of MPPT-based charge controllers, particularly in comparison to commercially available solutions, is necessary to bridge this research gap.
2. Description of the Designed System
The schematic diagram represents the studied solar energy system, which consists of two primary subsystems: the solar power generation unit and the battery storage unit. These subsystems collectively supply power to a load through a buck converter and a filtering stage. The system includes a photovoltaic (PV) panel array, a DC-DC boost converter, a buck converter, an energy storage unit, and a charge controller integrated with Maximum Power Point Tracking (MPPT) functionality.
The charge controller, which features a three-stage charging process for lead-acid batteries, is embedded within the MPPT control framework. This controller employs both Perturb and Observe (P&O) and Artificial Neural Network (ANN) MPPT algorithms to optimize power extraction. The Pulse Width Modulation (PWM) signal generated by the MPPT-based charge controller is used to regulate the DC-DC buck-boost converter [15], managing the switching operations.
This schematic serves as a general model for commercial MPPT-enabled battery charging controllers integrated into solar PV systems. The PV and battery modules utilized in this study are sourced from MATLAB/Simulink, as illustrated in Figure 1.
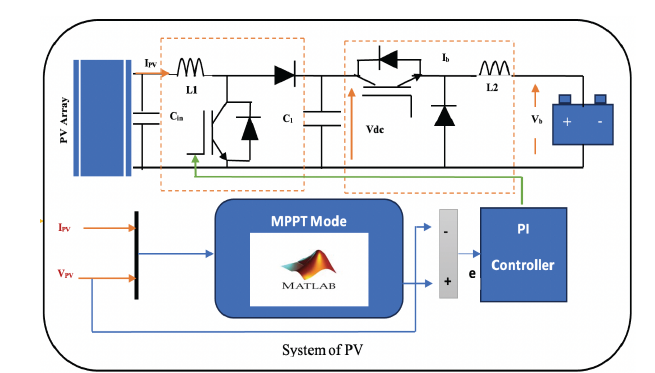
Figure 1 - Proposed Model MATLAB/Simulink
The ideal representation of a solar cell consists of a current source connected in series with a diode. To enhance accuracy, an improved model incorporates both series and parallel resistances, as illustrated in Figure 2 [11]-[13]. The relationship between the current (I) and voltage (V) of the solar cell is mathematically expressed in (1) [14].
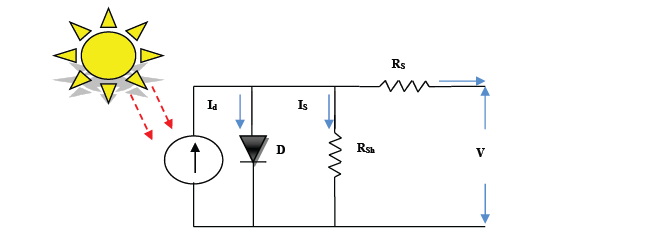
Figure 2 - equivalent circuit of a solar cell
(1)
A PV solar cell's parallel resistance is represented by ??ℎ, and its series resistance is represented by ??. The formula for a PV solar cell's thermal voltage is ?? = ??/?, where ? is the electron charge, ? is the cell temperature, and ? is the Boltzmann constant. The 12000 [W] photovoltaic (PV) array's current-voltage (I-V) and power-voltage (P-) characteristic is shown in Figure 3.
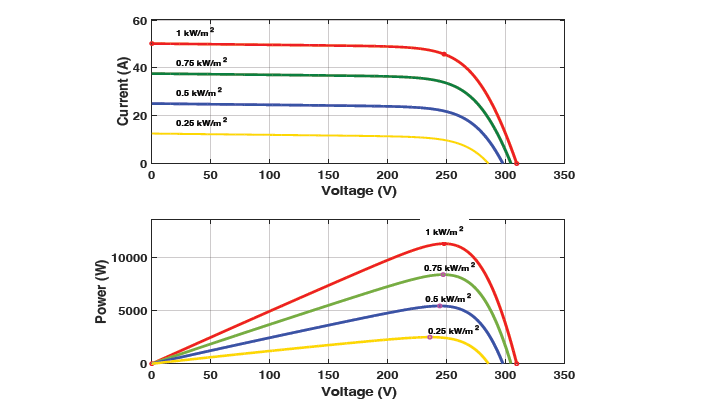
Figure 3 - I-V and P-V characteristics of the 12000 W PV array
In the calculation (2)[14], the impact of temperature and solar radiation on the lightactivated current is evident. Since the resistance of solar PV cells in series is substantially lower than that of solar PV cells in parallel, it is assumed that the short-circuit current is about equal to the minimal current of the photovoltaic cells.
(2)
The current produced by photovoltaic cells is represented by ?pvn, the current coefficient is represented by ?i, the difference between the actual and nominal temperature is indicated by ?, the actual solar irradiance is represented by ?, and the standard solar irradiance is represented by ?n. Two parallel strings, each with four panels connected in series, are used in this arrangement.
Each panel has the following specs and a 135[W] power rating: At the peak power point, the voltage is 243[V], the current is 50[A], the open-circuit voltage is 22[V], and the shortcircuit current is 8.36[A]. The PV system array's overall output can reach up to 12000 [W]. The PV array's power-voltage (P-V) and current-voltage (I-V) characteristics change depending on the amount of light present, as shown in Figure 3.
2.1. Battery system
The battery model used in this investigation is shown in Figure 4 and consists of up of two electrical components: An internal resistance and a voltage source [25].

Figure 4 - Lead acid battery electrical model
The battery voltage can be given by:
(3)
Where:
?b: Internal resistance
?b: Voltage source
The battery capacity, denoted as ?bat, is determined by:
(4)
With:
?10 represents the rated capacity and ?' stands for the accumulator's heat.
The expression for the battery's charge level is given by:
(5)
With:
Q = Ibat × t (6)
Where ? is the discharging time.
MATLAB-Simulink is used to develop the system model, which is then analysed through simulations to determine how temperature affects its behaviour.
3. MPPT Techniques
The main drawback of a commercial solar photovoltaic (PV) system is its relatively low conversion efficiency. To overcome this, the system uses the MPPT algorithm to improve energy yield and efficiency.
3.1. Perturb and observe algorithm
In PV systems functioning at the MPP, the P&O algorithm is an effective technique for MPPT. This method's high efficiency, computational simplicity, and ease of implementation are its main features. Figure 5 and Figure 6 show the algorithm's structure and flowchart, respectively[6]. The P&O algorithm[16]works by altering the array's voltage. Examining the PV array's P-V curve, which is shown in Figure 5, shows that the voltage V rises or falls with increasing or decreasing irradiance on the left side of the MPP, whereas it shows the opposite behaviour on the right side of the MPP, rising or falling. The perturbation's step size might be decreased to lessen oscillations.
Here is a complete diagram of the P&O algorithm:
- Step 1: Start
- Step 2: Read variables ?(?) and ?(?).
- Step 3: Calculate power: ?(?) = ?(?) × ? (?)
- Step 4: Call previous values of ?and? from the memory. ?(? − 1) and ?(? − 1)
- Step 5: Calculate the change in power ?? and change in voltage ?? using:
dV = V(n) - V(n-1) and dP = P(n) - P(n-1)
- Step 6: If ?? = 0, Then no change in duty ratio is required and GOTO Step 7.
Else If (??. ??) > 0, Then increase the duty ratio by ?? and GOTO Step 7.
Else decrease the duty ratio by ?? and GOTO Step 7 - Step 7: return.
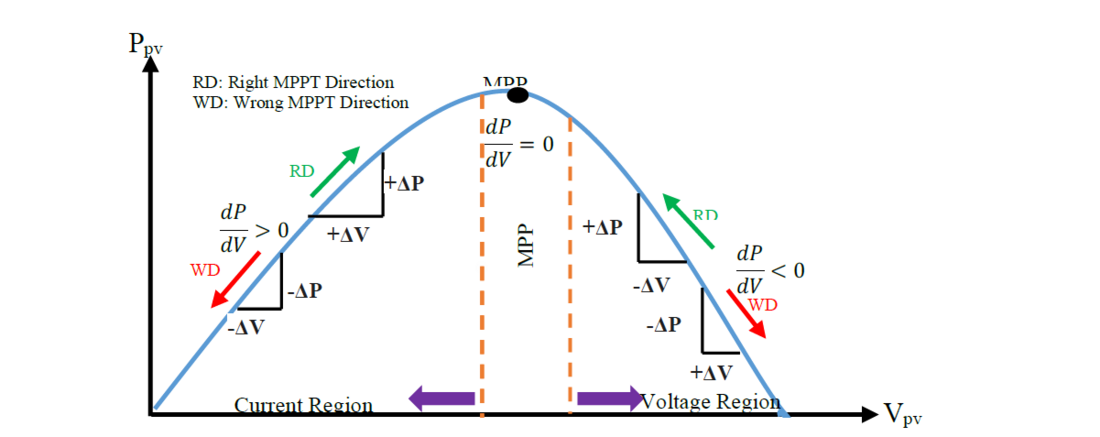
Figure 5 - Power-Voltage Characteristics at the Maximum Power Point (MPP)
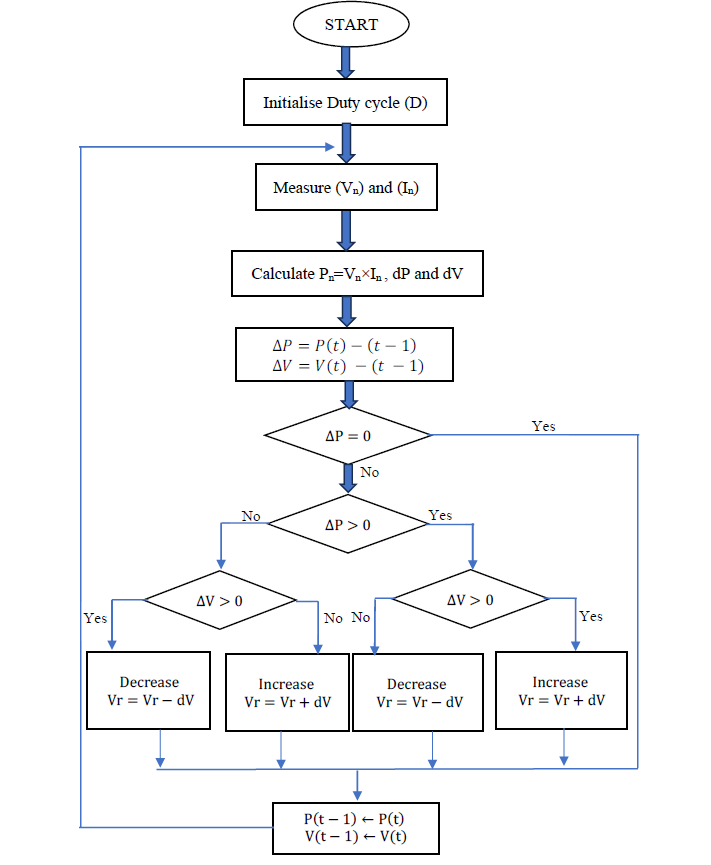
Figure 6 - Flowchart of P&O method
3.2. MPPT with Neural Networks
Artificial Neural Networks (ANNs) are frequently used to solve complex problems, particularly in the field of photovoltaic systems. Their main advantage lies in their ability to handle incomplete data and learn from examples. Quick prediction [17], optimization [18]-[19], and system modelling [16]-[20], are all possible with trained ANNs. One of the major benefits of ANNs is that they eliminate the need to fully understand input/output relationships and solve complex mathematical problems.
This study uses an ANN to maximize the power output of a photovoltaic (PV) system, accounting for the nonlinear power-voltage (P-V) and current-voltage (I-V) curves, as well as the effects of temperature and solar radiation. A multilayer perceptron (MLP) was specifically selected for its effectiveness in modelling nonlinear systems [21]. An MLP consists of multiple layers of neurons, with signals flowing from the input layers to the output layers. Neurons in the same layer are not connected to one another. The ANN structure includes three layers: an output layer, an intermediate hidden layer, and an input layer. The number of layers and neurons in each layer was determined through a series of systematic tests aimed at optimizing the network's performance [22]-[23].
3.2.1. Model tunning and ANN training process
a) Model Tuning Process
To optimize the ANN, we iteratively tuned hyperparameters using grid search and validation-based early stopping:
- Hyperparameters:
- Learning rate: Tested values (0.001, 0.01, 0.1) via cross-validation; 0.01 minimized MSE.
- Hidden layers/neurons: The selection of 10 neurons represents a balance between underperformance (architectures with 5 neurons, MSE = 0.12) and overfitting (20 neurons, MSE = 0.07 but with high validation variance). These results were validated during the grid search phase, which systematically explored hyperparameter combinations to optimize model robustness see in Table 1.
- Epochs: Trained up to 200 epochs; early stopping triggered at 150 epochs (no validation loss improvement for 20 epochs).
| Neurons | Learning Rate | Validation MSE |
|---|---|---|
| 5 | 0.01 | 0.08 |
| 10 | 0.01 | 0.05 |
- Regularization:
- Dropout: Applied (rate=0.2) to hidden layers to prevent overfitting.
- K-fold (k=5): Ensured robustness across data splits (MSE variance: ±0.02).
b) ANN Training Process
Step 1: Data Preparation
- Normalization: Inputs (voltage/current) scaled to [0, 1] using min-max normalization.
- Split: 70% training, 30% validation (stratified to maintain PV operating condition distribution).
Step 2: Architecture
The proposed architecture balances simplicity and nonlinear modeling capability via a ReLU-activated hidden layer. A linear output layer avoids constraining predictions to predefined ranges, enabling accurate estimation of real-world physical variables like PV-generated power
- Layers: Input (2 nodes) → Hidden (10 nodes, ReLU) → Output (1 node, linear).
- Activation: ReLU for hidden layer (avoids vanishing gradients), linear output for regression.
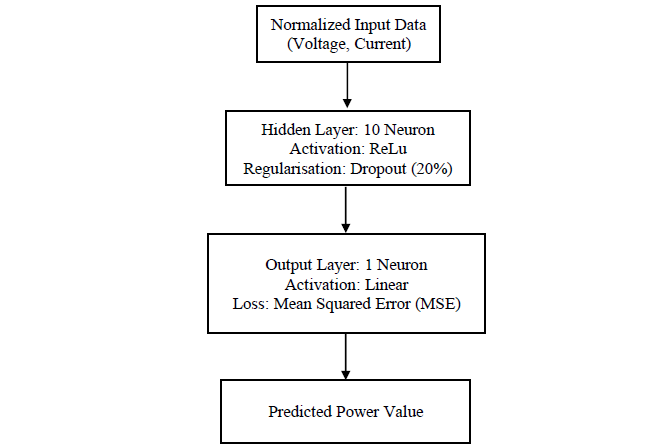
Figure 7 - Detailed ANN architecture with regularization and training parameters
As shown in Figure 9, the ANN architecture comprises three key components:
- An input layer (2 nodes) receiving normalized voltage and current measurements.
- A single hidden layer (10 neurons) with ReLU activation to model nonlinear relationships between inputs and outputs.
- A linear output layer (1 node) to predict continuous power values without range constraints.
This structure balances simplicity and predictive accuracy, as validated by the low MSE (0.05) in Table 1.
Step 3: Training
- Optimizer: Adam (learning rate=0.01, β₁=0.9, β₂=0.999).
- Loss: MSE (Equation 7), monitored on validation set.
- Backpropagation: Weights updated via gradient descent with momentum (β=0.9).
Step 4: Validation
- Performance: Final MSE = 0.05 on unseen test data (5% error relative to max power).
- Visualization: Learning curves (training/validation loss vs. epochs) confirmed no overfitting.
| Numbers of approach | Numbers of neuron | MSE |
|---|---|---|
| 100 | 10 | 9.26 × 10⁻⁶ |
| 200 | 10 | 8.90 × 10⁻⁶ |
| 300 | 10 | 9.17 × 10⁻⁶ |
| 400 | 10 | 9.50 × 10⁻⁶ |
In this case, ?opt stands for the photovoltaic (PV) system's anticipated power output, ?pred for the power that the ANN predicted, and ? for the database's size.
The training technique yielded optimal Mean Squared Error (???) values of 8.81 × 10⁻⁶ for 10 neurons and 8.87 × 10⁻⁶ for 200 approaches in (7), as shown in Table 1. Because 10 is linked to a very efficient performance, it is therefore decided that this is the ideal number of neurons in the hidden layer. Two neurons make up the input layer, ten neurons make up the hidden layer, and one neuron makes up the output layer of the artificial neural network (ANN). Figure 8 shows the PV system using the neural network approach. The input layer includes the PV system's current and voltage, and the output layer forecasts the power.
(7)
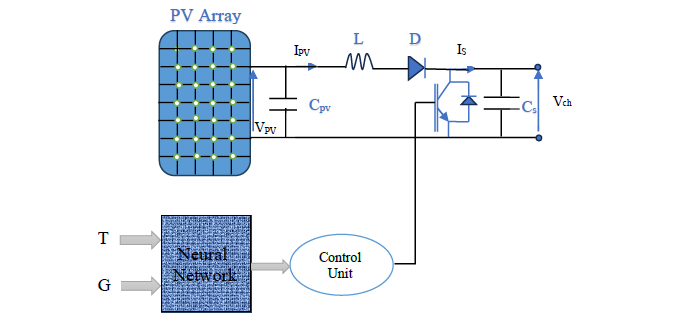
Figure 8 - Block diagram of the MPPT ANN controller
The proposed ANN-based MPPT controller adopts a three-layer feedforward network, illustrated in Figure 9. The network's structure is defined by various factors, including the number of layers, the quantity of neurons in each layer, the type of activation function in each layer, and the interconnections between layers. Among several activation functions[26], our ANN model employs the sigmoid function for the hidden layer. Notably, the sigmoid function is characterized by a positive first derivative value, making it conducive to the learning algorithm, and its output is constrained between 0 and 1. In preliminary experiments, the sigmoid activation function was explored to normalize network outputs. However, for regression tasks involving unbounded targets power or voltage, we adopted a linear output activation. This choice eliminated artificial constraints on prediction ranges, reducing the mean squared error (MSE) compared to sigmoidbased configurations. The linear activation aligns with standard regression practices, where outputs must scale freely to match continuous physical phenomena. The sigmoid function is mathematically defined in (8). Figure 9 shows the schematic representation of the neural network-based MPPT controller.
(8)
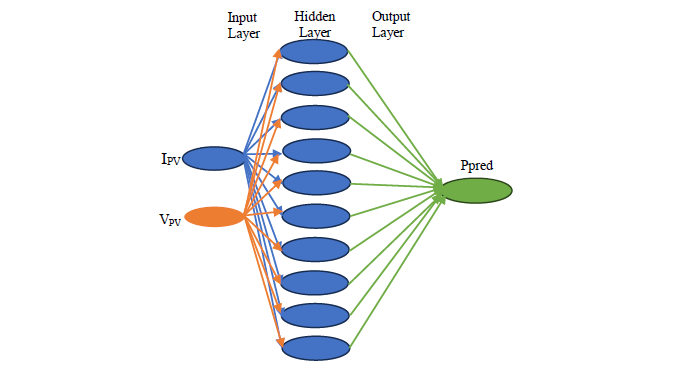
Figure 9 - Configuration of MPPT using ANN
To achieve the ?mpp voltage linked to the maximum ?mpp power, the ANN controller measures ?(?) and either increases the duty cycle ? if (V(k) − Vmpp ≥ 0), or decreases ? If(V(k) − Vmpp < 0).The corresponding flowchart for this MPPT algorithm based on neural networks is shown in Figure 10.
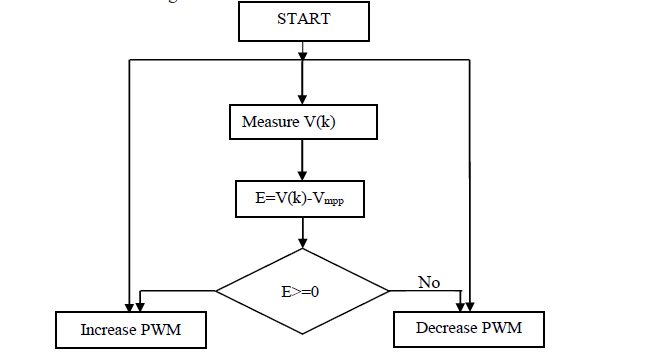
Figure 10 - Flowchart of MPPT using ANN
4.1. Battery Charger Control
A battery is commonly depicted as a controlled power source that is connected to a load with a fixed resistance. The battery voltage (?bat) is determined by the following equation:
(9)
The regulated source voltage can be determined using (10).
(10)
Equation (9) defines the battery's no-load voltage (?),where ?0 is the battery's constant voltage, ? is the polarization voltage, ? is the battery's capacity, ? is the exponential zone's amplitude (in volts), and ? is the exponential zone's inverse time constant (in ampere-hours per second). The battery has a 40 [Ah] capacity, a minimum voltage of 36 [V], and a fully charged voltage of 52.26 [V]. 17.4 [mA] is the lowest dischargeable current. With a nominal capacity of 36.25 [Ah], the voltage in the exponential region is 48.8 [V]. The internal voltage is 48 [V], and the internal resistance is 0.024 [ohms]. According to the discharge characteristics displayed in Figure 11, the battery voltage response time is 30 seconds.
The predefined threshold refers to the target voltage for fully charging the battery. For the lead-acid batteries used in this system, the target voltage is 52.26 V, marking the transition from constant current charging to constant voltage charging. Once this threshold is reached, the battery enters the constant voltage phase, maintaining a steady voltage to prevent overcharging. If the battery voltage falls below this threshold, the MPPT controller reverts to constant current charging to ensure proper charging and avoid undercharging.
Lead-acid batteries can be charged in three stages by using the MPPT charge controller: floating-level charging, constant voltage charging, and constant current charging. The charge current is at its highest during the first phase, which is referred to as MPPT charging.
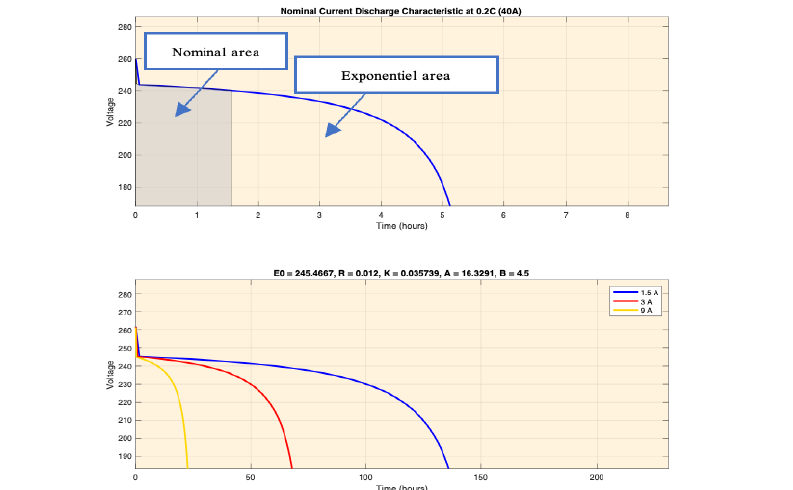
Figure 11 - Characteristics of Battery Discharge
In the constant voltage charging mode, a steady voltage is maintained across the battery, and the MPPT is not active. A "float charge" is then applied once the battery has reached full charge in order to keep the state of charge (SOC) at 100% and avoid overcharging and related hazards like explosion from built-up pressure. Figure 12 shows a battery charger controller flowchart. The MPPT controller constantly monitors the battery voltage and its state of charge (SOC). When the state of charge is less than full capacity (100%), the charging process operates in constant voltage or constant current mode. However, once the state of charge exceeds 100%, the charger switches to the hold stage, which stops the PWM pulse. In the next phase, the selection between constant voltage and constant current charging is determined by the battery voltage. If the voltage falls below a predefined threshold, the MPPT is activated to enable constant current charging. Conversely, if the voltage remains above this level, the MPPT is deactivated. The battery charge controller uses voltage and state of charge (SOC) as input parameters. In Simulink, the float step is disabled by passing the MPPT duty cycle through a multiplication block when the specified condition is met, allowing the charger to enter the state of charge.
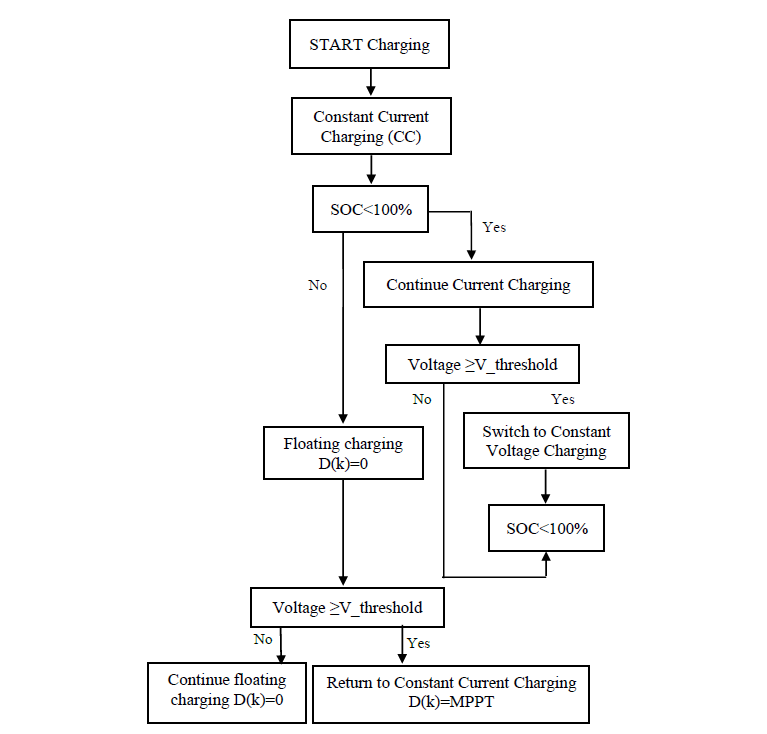
Figure 12 - Flowchart illustrating the Battery Charging Process
When the battery reaches a 100% state of charge (SOC), it moves into the floating stage, when the converter is activated by inhibiting the PWM pulse. Should the battery voltage fall below the level of the floating-point voltage, the battery moves on to either fixed charging conditions for voltage or current. The MPPT duty cycle is multiplied by the MPPT Simulink block in this step, and the output is sent to the PWM generator block, which then sends it to the converter buck and converter boost power semiconductor elements. The battery controller switches to fixed voltage charging conditions if the condition is not met. This keeps the battery voltage steady until the switch to floating conditions is started by quickly switching from MPPT to zero-switching conditions, which is made possible by the controller blocks.
Table 3 presents the electrical and physical parameters used for the modelling and simulation of the photovoltaic (PV) charging system. These include the inductance values ?1 ,?2 , and ?3, as well as the input and output capacitances Cin, Cout, and intermediate filtering capacitors ?1 to ?4, which are critical in stabilizing voltage ripples and ensuring efficient energy transfer in the DC-DC converters. Additionally, the table lists the PV module specifications under Standard Test Conditions (STC), including the open-circuit voltage ?oc short-circuit current ?sc , maximum power , voltage and current at maximum power point ?mp and ?mp, the number of series-connected cells ?s, and the system switching frequency ?. These values are essential for designing and tuning the MPPT algorithm and power stage for optimal performance under real-world solar conditions.
| Symbols | Values | Symbols | Values |
|---|---|---|---|
| L1 | 2.3 mH | Cout | 200 µF |
| L2 | 0.82 mH | 135 W | |
| L3 | 3.2 mH | Voc | 22.1 V |
| Cin | 300 µF | Isc | 8.3696 A |
| C1 | 440 µF | Ns | 36 |
| C2 | 200 µF | Vmp | 17.7 V |
| C3 | 100 µF | Imp | 7.6296 A |
| C4 | 1100 µF | f | 150 kH |
4.2. ZN-PI and ZN-PID control
This section outlines the design methodology for classical Ziegler-Nichols Proportional- Integral (ZN-PI) and Ziegler-Nichols Proportional-Integral-Derivative (ZN-PID) controllers specifically designed for voltage regulation using a buck converter. The differential equation for a generalized PID controller is typically expressed in either 'parallel form' or 'ideal form,' as indicated by equations (11) and (12), respectively.
(11)
(12)
Where ?p ?I , and ?D denotes proportional, integral and derivative gains respectively, ?I and ?D denotes integral and derivative time constants respectively, and ? and ? are output and input i.e. error signal of the controller respectively. The performance parameters of the PID controller are quantified using ZN tuning method [27]; using relations as given below:
For PI control:
For PID control:
In control systems, where ?u and ?u represent the ultimate gain and the period of the system, respectively, Ziegler-Nichols (ZN) tuned Proportional-Integral (PI) and Proportional-Integral- Derivative (PID) controllers can sometimes lead to unsatisfactory performance. This can be observed in metrics such as overshoot (OS), rise time (RT), settling time (ST), Integral of the Absolute Error (IAE), and Integral of the Squared Error (ISE) [27]-[28].
5. Results and discussion
The system, shown schematically in Fig. 1, was modelled and simulated in MATLAB/Simulink. The simulation parameters, including PV system specifications, are listed in Table 3. To evaluate the model's efficacy, we monitored and charged the batteries while assessing overall efficiency using an industrial MPPT charge controller. The MPPT algorithm demonstrates effective tracking capabilities, with a perturbation step set to ? = 1-4 . The study considers an internal module temperature of 25°C and irradiance variations illustrated in Figure 13.
Using these two approaches, we carried out a comparative analysis to assess the controller's effectiveness. Any MPPT method's ability to respond to meteorological factors like temperature and irradiance determines how effective it is.
A comparison of the maximum power harvested with the ANN and traditional P&O systems under fixed temperature and variable irradiance is shown in Fig. 14. The ANN outperforms the P&O approach in terms of response time and oscillations, as seen by enlarged photos taken at three distinct sites.
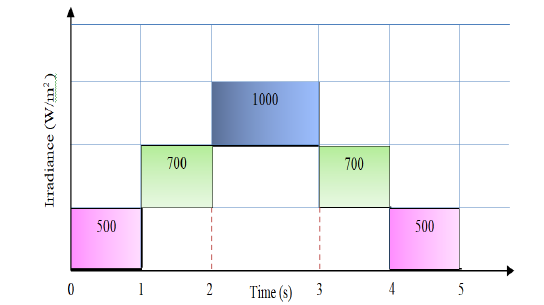
Figure 13 - Diagram of irradiance variation
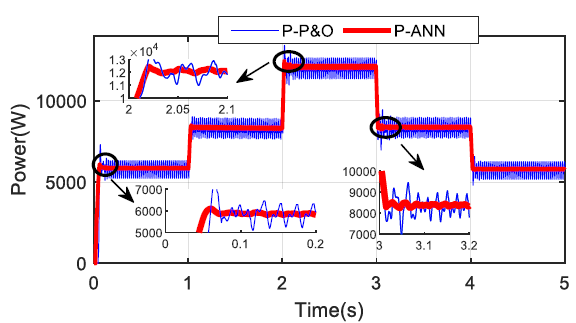
Figure 14 - The power optimized by the ANN and P&O methods
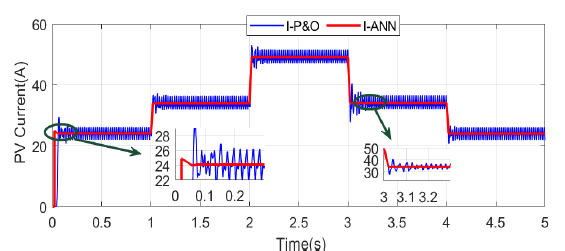
Figure 15 - The current optimized by the ANN and P&O methods
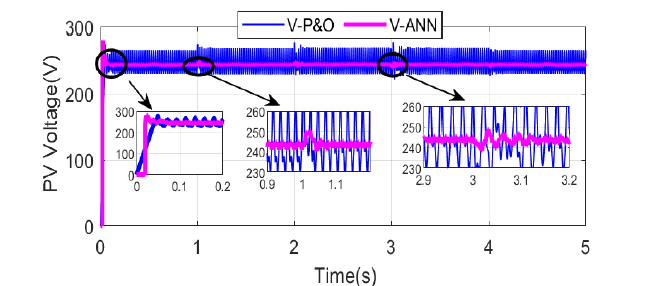
Figure 16 - The voltage optimized by the ANN and P&O methods
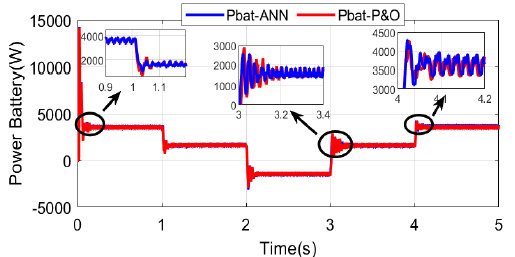
Figure 17 - The battery power optimized by the ANN and P&O methods
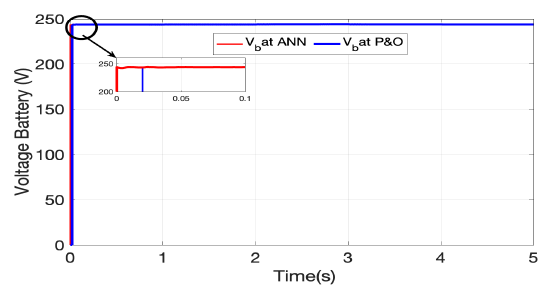
Figure 18 - The battery voltage optimized by the ANN and P&O methods
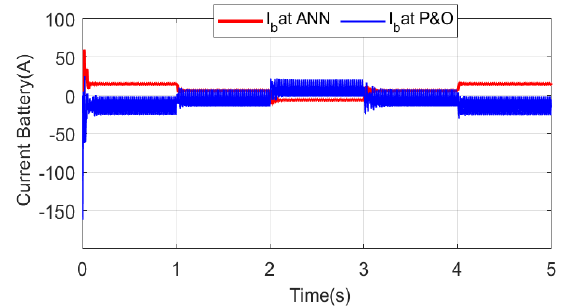
Figure 19 - The battery current optimized by the ANN and P&O methods
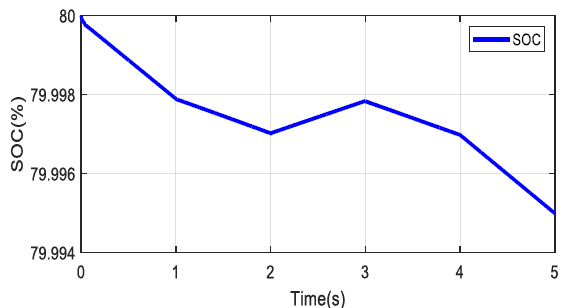
Figure 20 - SOC battery optimized under varying irradiance
A comparison of the ideal voltage and ideal current utilizing the two techniques under the same circumstances is shown in Fig. 15 and Fig. 16, respectively. It is evident that the P&O scheme had the largest voltage ripple, while ANN MPPT showed very slight oscillations. Additionally, it is noted that the suggested MPPT technique virtually eliminates PV current oscillations. Furthermore, compared to the voltage at the MPP point,?mpp, which is only marginally impacted, the waveforms of the current ?mpp, and the power ?max are greatly impacted by the change in irradiance.
ANN performs well in the robustness test, exhibiting low mistakes and the capacity to adjust to changing meteorological circumstances. Furthermore, ANN's simulation time is far quicker than the P&O methods. This is because, in contrast to P&O, which depends on generalization after the learning process, ANN is flexible enough to adapt to changing situations.
In order to guarantee the distribution of available energy from the PV field, batteries, and load demands, the study investigates the optimization and management of battery charging and discharging in a PV-BAT photovoltaic system. utilizing PV as the primary source, the control strategy aims to improve DC bus voltage regulation utilizing two MPPT algorithms: P&O and a neural network created as part of our suggested optimized control, as illustrated in Fig. 6 and Fig.10, respectively.
With the battery serving as an extra source to boost the PV-BAT system's efficiency. Figure 17 displays the power values, while Fig. 18 and Fig. 19 display the voltage and current data, respectively. By controlling battery charging and discharging according to energy management when the system is subject to fluctuating disturbances, the battery linked to the PV system's DC bus can increase the system's dynamic efficiency, as seen in Fig. 20. In order to guarantee the system's safe and efficient operation, the control strategy incorporates techniques for controlling system limits and saturation. When the batteries' state of charge (SOC'BAT) hits its maximum or lower limitations, respectively, saturation control uses a dissipation mechanism and regenerative braking in Figure 12.
In summary, this study demonstrates how ANN's adaptive learning capabilities in response to weather conditions make it superior to the P&O MPPT controller. The simulation's findings contrast two clever approaches, highlighting ANN's quick convergence and simpler construction, which make it an affordable option.
6. Conclusion
In this paper, the ANN algorithm was employed to construct an intelligent battery charging device for a solar system. A thorough comparison between the sophisticated intelligent ANN method and the traditional P&O MPPT method was conducted. The findings collected show that the suggested approach is effective. The MPPT outperforms P&O MPPT with peak tracking efficiency ranging from 86% to 99%. Furthermore, the suggested MPPT performs exceptionally well in minimizing power loss, tracking direction loss, and oscillations around the MPP. An intelligent controller based on ZN-PID has been successfully created and deployed to effectively charge a system's battery.
Modelling accuracy is improved by adding a time delay to the buck converter. Constant current and voltage approaches are used to achieve charging; the suggested controller maintains voltage and current at 243 [V] and 50 [A], respectively, with almost no ripple content. In conclusion, the entire suggested approach works well for using a photovoltaic system to charge the batteries of any system (such a hybrid car), adjusting to different degrees of solar insolation while reducing stress and increasing lifespan.
Furthermore, we used a commercially available MPPT solar PV controller to independently confirm hardware performance estimates in real-time in Simulink. The advice offered by this well-established model can help photovoltaic systems of various sizes functioning independently choose the most effective arrangement of solar panels and battery storage.
7. References
- Rissman, J.; Bataille, C.; Masanet, E.; Aden, N.; Morrow, W.R., III; Zhou, N.; Elliott, N.; Dell, R.; Heeren, N.; Huckestein, B.; et al. Technologies and policies to decarbonize global industry: Review and assessment of mitigation drivers through 2070. Appl. Energy 2020, 266, 114848.
- Eltamaly, A.M.; Al-saud, M.S.; Abokhalil, A.G. A novel scanning bat algorithm strategy for maximum power point tracker of partially shaded photovoltaic energy systems abc dq. Ain Shams Eng. Ain Shams Eng. J. 2020, 11, 1093–1103. [CrossRef]
- S. Mischie. Behavior of the lead acid battery after the rest period. Accessed: Nov.20,2020. [Online].
- Chen, X., Zhang, H., Xu, Z., Nielsen, C.P., McElroy, M.B., Lv, J., et al. (2018). Examination of Fleet Types and Charging Modes for Electric Vehicles on Emissions under Various Penetrations of Wind Power. Nature Energy, 3, 413–421. DOI
- J. Jana, H. Samanta, K. D. Bhattacharya, H. Saha, “Design and Development of High Efficiency Five Stage Battery Charge Controller with Improved MPPT Performance for Solar PV Systems ", Internatıonal Journal of Renewable Energy Research, 2018 Vol. 8, No. 2.
- A.Belkaid, I.Colak, K.Kayisli, « A Comprehensive Study of different Photovoltaic Peak Power Tracking Methods », pp: 1073-1079, 6th IEEE International Conference on Renewable Energy Research and Applications, ICRERA 2017, 5 - 8 November 2017, San Diego, California, USA.
- N. B. Sushmi and D. Subbulekshmi, “Robust Solar Irradiation Forecasting Mechanism for Maximum Power Point Trackers: A Comparative Review", Internatıonal Journal of Renewable Energy Research, 2022 Vol. 12, No. 4.
- Pathak, P.K., Yadav, A.K., Alvi, P.A.: Advanced solar MPPT techniques under uniform and non-uniform irradiance: A comprehensive review. J. Sol. Energy Eng. 142(4), 040801-1-26 (2020)
- Chtita, S., Motahhir, S. and El Ghzizal, A. (2024), A New Design and Embedded Implementation of a Low-Cost Maximum Power Point Tracking Charge Controller for Stand-Alone Photovoltaic Systems. Energy Technol., 12: 2301324. https://doi.org/10.1002/ente.202301324
- Kadeval, H.N., & Patel, V.K. (2021). Mathematical Modeling of Solar Cell, Panel, and Array for Photovoltaic Systems. Journal of Applied Natural Science, 13, 937–943. DOI
- A. Belkaid, K. Kayisli, I. Colak , S. Hadji, and O. Guenounou, « Smart Power Conditioning Unit Utilizing Enhanced Inc-Con MPPT for Photovoltaic Power Plants», International journal of Smart Grid, Vol.8, No.1, 2024, pp 41–45, DOI
- Neda Mahmod Mohammad Altwallbah, Mohd Amran MohdRadzi, NorhafizAzis, SuhaidiShafie, Muhammad AmmirrulAtiqiMohdZainuri, New perturb and observe algorithm based on trapezoidal rule: Uniform and partial shading conditions, Energy Conversion and Management, Volume 264, 2022, 115738, DOI
- C. Aoughlis, A. Belkaid, M. A. Kacimi, I. Colak, O. Guenounou, T. Bakir & L. Brikh, A Novel Dynamic and Self-Adaptive InCre Technique Based on PI Control and EO Optimization for Hybrid PV-TEG Conversion Systems, Electric Power Components and Systems, 52(9): 1569–1580, 2024, DOI
- R. Z. Caglayan, K. Kayisli, M. Roscia, A. Belkaid, and A. Nasri, « A Comparative Analysis of P&O, IC and supertwisting Sliding Mode based MPPT methods for PV and Fuel Cell sourced Hybrid System », International Journal of Renewable Energy Research-IJRER, Vol 13, No 3, pp. 1431–1442,2023, DOI
- M.S. Hossain Lipu, M.A. Hannan, A. Hussain, « Feature Selection and Optimal Neural Network Algorithm for the State of Charge Estimation of Lithium-ion Battery for Electric Vehicle Application», International Journal of Renewable Energy Research-IJRER, Vol 7, No 4, pp. 1700–1708, 2017, DOI
- L. Larbi, S. Hadji, A. Belkaid, I. Colak and R. Bayindir, "Design of a buck converter battery charging controller in PV plant," 2022 10th International Conference on Smart Grid (icSmartGrid), 2022, pp. 214-220, Istanbul/Turkey, 27-29 June 2022, doi: 10.1109/icSmartGrid55722.2022.9848640.
- A. Ndiaye, L. Thiaw, G. Sow, Application of new modeling and control for grid connected photovoltaic systems based on artificial intelligence, J. Electric. Electron. Eng. Res. 7 (1) (2015) 1-10.
- K. Mostefa, B. El Madjid, Artificial intelligence-based maximum power point tracking controllers for Photovoltaic systems: Comparative study, Renew. Sustain. Energy Rev. 69 (2017) 369-386.
- A. Kurniawan, E. Shintaku, A neural network-based rapid maximum power point tracking method for photovoltaic systems in partial shading conditions, Appl. Solar Energy (English Translation of Geliotekhnika) 56 (3) (2020) 157–167.
- Surabhi Chandra and Prerna Gaur. Radial basis function neural network technique for efficient maximum power point tracking in solar photo-voltaic system. Procedia Comput Sci, 167, 2354-2363.
- C. Robles-Algarin, D. Restrepo-Leal, A. O. Castro, Data from multimodal functions based on an array of photovoltaic modules and an approximation with artificial neural networks as a scenario for testing optimization algorithms, Data Brief 27 (2019) 104669.
- I.Kopal, M. Harnicarova, J. Valicek, J. Krmela, O. Lukac, Radial basis function neural network-based modeling of the dynamic thermomechanical response and damping behavior of thermoplastic elastomer systems, Polymers 11 (6) (2019).
- H. Moayedi, B. Aghel, B. Vaferi, L. KokFoong, D.T. Bui, The feasibility of Levenberg-Marquardt algorithm combined with imperialist competitive computational method predicting drag reduction in crude oil pipelines, J. Pet. Sci. Eng. 185 (2020) 106634.
- Kulaksiz Ahmet Afsin and Akkaya Ramazan. (2012). A genetic algorithm optimized ANN based MPPT algorithm for a stand-alone PV system with induction motor drive. 86, 2366-2375.
- F.Zaouche , Dj.Rekioua , J.P Gaubert , Z.Mokrani, « Supervision and control strategy for photovoltaic generators with batterystorage», international journal of hydrogen energy 42 (2017) 19536e19555 https://www.sciencedirect.com/journal/international-journal-of-hydrogen-energy.
- A.BA∗, A. NDIAYE, E. Mbaye NDIAYE, S. MBODJI« Power optimization of a photovoltaic system with artificial intelligence algorithms over two seasons in tropical area », MethodsX 10 (2023) 101959 www.elsevier.com/locate/mex
- Neath, M.J., Swain, A.K., Madawalaand, U.K., Thrimawithana, D.J., 2014. An optimal PID controller for a bidirectional inductive power transfer system using multiobjective genetic algorithm. IEEE Trans. Pow. Elec. 29 (3), 1523–1531.
- Yadav, A.K., Gaur, P., 2016b. An optimized and improved STF-PID speed control of throttle controlled HEV. The Arabian Journal for Science and Engineering. 41 (9),3749–3