Inertia in the Dutch Power Grid: Trends and Implications
Authors
Aleksandar BORIČIĆ, Sam FROHN, Shiyi LIU, Jorrit BOS - TenneT TSO B.V. - The Netherlands

Summary
The Netherlands is at the forefront of the energy transition and renewable energy integration, with one of the largest solar PV infeed per capita worldwide. Additionally, large-scale integration of offshore wind is underway, with expectations for further acceleration through TenneT’s ambitious 2GW offshore programme in the North Sea. While these developments are excellent for meeting climate goals, they present significant challenges for the robust future design and stable operation of both the current and future Dutch power system.
One of the key issues the Dutch system is facing is the steep decline in available system inertia. To quantify this, TenneT NL has developed a Synchronous Inertia Dashboard, offering insights into real-time and historical synchronous inertia values in the grid. This paper presents a detailed data analysis of historical inertia trends and their implications for grid security. Furthermore, future synchronous inertia trends have been forecasted and thoroughly analysed.
In the context of the ongoing ENTSO-E Project Inertia developments, that aims to establish a future minimum inertia level for each country, the inertia shortfall in the Dutch grid is estimated and examined in detail. The findings reveal a substantial inertia deficiency that must be addressed. Additionally, potential measures that could be taken by TenneT NL to mitigate this challenge are outlined.
Finally, the paper discusses the major low-inertia challenges from the TSO's perspective, including the need for accurate system inertia measurement and estimation, an optimal strategy for inertia provision, and the importance of further research and development in this area.
Keywords
Inertia, power system stability, system operation, grid planning, frequency, RoCoF, resilience1. Introduction
The energy transition is rapidly reshaping the structure and operation of power systems. As synchronous machines are phased out and replaced by renewable inverter-based resources (IBRs), many technical challenges arise. One of the key issues the Dutch system is facing is the steep decline in available system inertia. In the past, conventional power plants, as exemplified in Fig. 1, dominated power systems, providing abundant inertia and system strength [1].
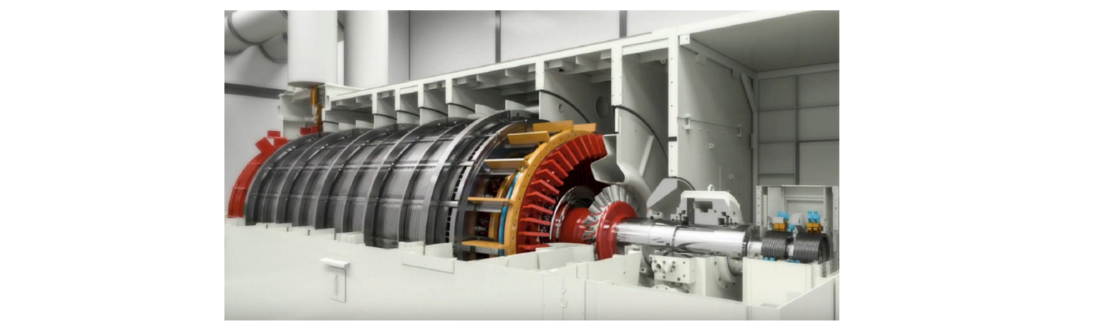
Figure 1 – Example of a synchronous generator and turbine, with large rotating mass [courtesy of Siemens]
Such a system was resilient, capable of managing a broad range of operating scenarios, and able to quickly recover following disturbances. Declining levels of inertia reduce the system's ability to resist frequency changes, leading to more volatility and increased likelihood of breaching operational limits. This trend, explained with an analogy in Fig. 2, is the focus of this paper.
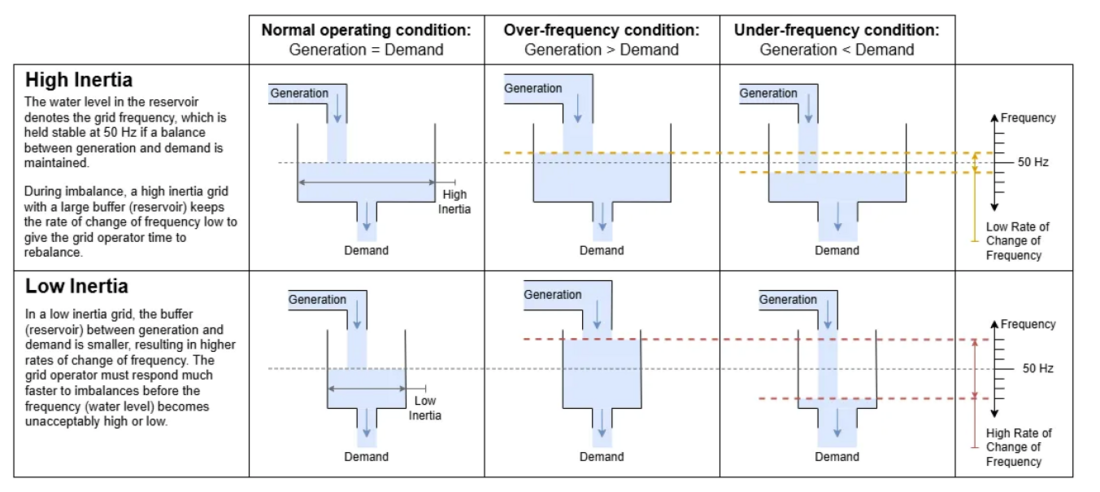
Figure 2 – Reservoir analogy for inertia and frequency stability
Besides national stability concerns, inertia plays a vital role in maintaining the integrity of the broader Continental Europe Synchronous Area (CESA). One of the major risks for grid stability and security in CESA are system splits [2, 3]. This has become more clear with recent events such as the two system splits in 2021 visualized in Fig. 3, where severe RoCoF beyond 1 Hz/s was observed locally [4]. As inertia reduces, similar events would lead to even higher RoCoF, posing an increased risk of cascading and blackouts.
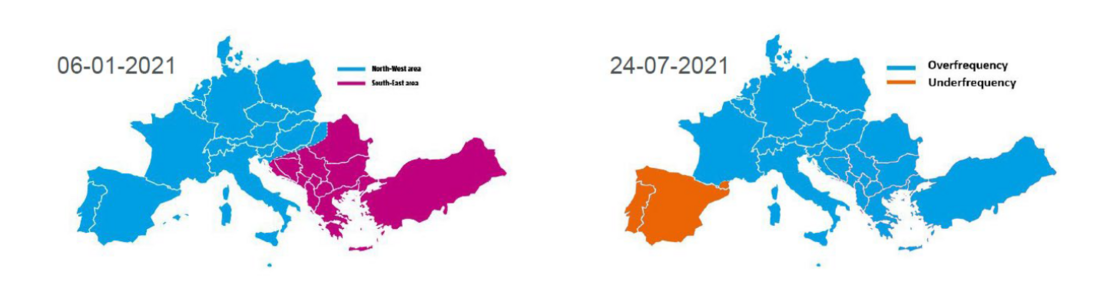
Figure 3 – System splits in the central European grid in 2021 [4]
To ensure system resilience, it is essential to monitor and quantify available inertia. This quantification should be also considered in the context of potential inertia shortfalls and the necessary grid enhancements and investments required to maintain adequate inertia levels at all times. These topics will be explored further in the following sections.
2. Inertia Trends in Dutch Power System Operations
The Netherlands is a flat country with very little hydro potential and only one nuclear power plant. Most of the electrical energy (and inertia) needs have been met with coal and gas power plants in the past. As a small and very densely populated country, the concentration of many power plants in a relatively small and well-meshed grid resulted in a very robust system in the past. Hence, inertia has never been a cause for concern, until recently.
The Dutch power system looks drastically different today. A significant integration of solar PV and wind onshore and offshore) is taking place, with installed capacity of over 26 GW and 12 GW, respectively. Some of these trends are shown in Fig. 4, where it can be seen that more than 30% of coal generation was replaced by (mainly) wind and solar electricity over the past decade. In 2024, the Netherlands produced 54% of its electricity from non-fossil fuels.
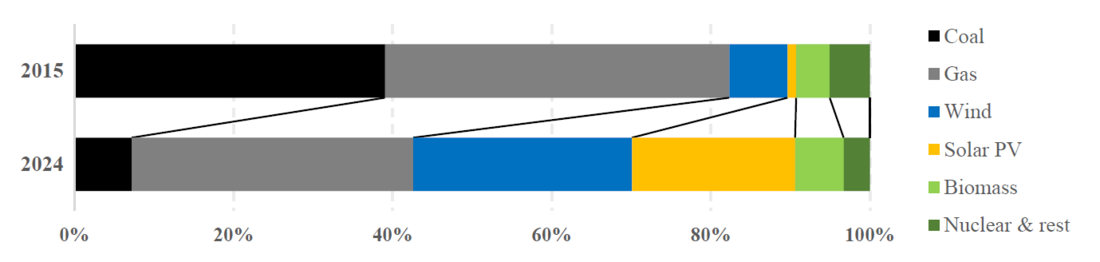
Figure 4 – Electricity generation mix evolution in the Netherlands
Consequently, large conventional power plants are more frequently either pushed out of the market, or even permanently shut down. This has become increasingly apparent to the Dutch transmission system operator TenneT NL, responsible for maintaining system integrity and stability. In this regard, several initiatives have been set up to better quantify past, current, and future inertia trends and needs in the Dutch system.
2.1. Synchronous Inertia Dashboard at TenneT NL
The Netherlands has about 50 large power plants with (often multiple) synchronous generators, providing the bulk of system inertia. We hereby use the term synchronous inertia to describe this major part of the total inertia. Other (residual) aspects of the total inertia, such as inertia from small DSO-connected combined heat and power (CHP) units, rotating loads, and other inertia-like damping effects are not considered, but are briefly discussed in the last section.
(1)
To monitor and quantify the synchronous inertia of the Dutch system, TenneT NL has recently developed the Synchronous Inertia Dashboard, as depicted in Fig. 5.
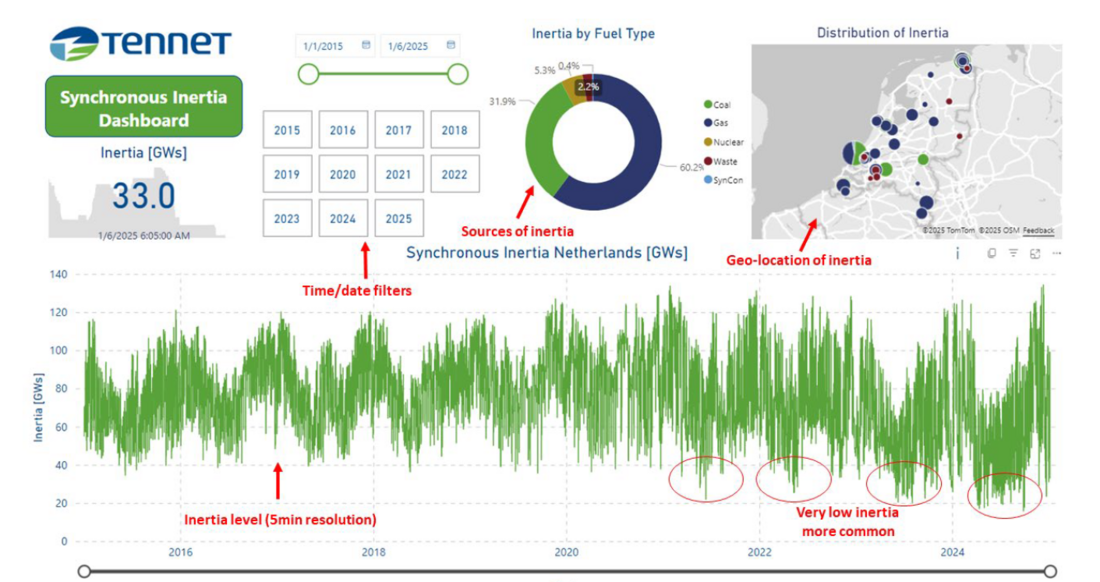
Figure 5 – Synchronous Inertia Dashboard at TenneT Netherlands, with few explanations in red
The dashboard provides close-to-real-time and historical synchronous inertia values (GWs) of the Dutch system with a 5 min resolution. The inertia data is calculated utilizing EMS operational data of units, combined with inertia-related design parameters of each synchronous machine in the system. Additionally, the dashboard provides further information such as inertia contribution per fuel type and geo-location of each inertia source for the selected date and time. Further improvements, such as the day-ahead inertia forecast, are also underway.
Current use-case of the dashboard is for information and analysis only, with ongoing projects to develop operational policies and processes for maintaining a sufficient level of inertia at all times. The following sub-section describes the statistical trend analysis of this historical dataset.
2.2. Operational inertia trends and statistics
From the inertia dashboard in Fig. 5, one can observe that the inertia levels have been moving in the range of around 20 to 130 GWs, with seasonal yearly patterns. Additionally, the large variability and very low levels of inertia became increasingly common in the past couple of years. To shed more light on this, the synchronous inertia data is sorted and presented in a duration curves for last five years, as shown in Fig. 6.
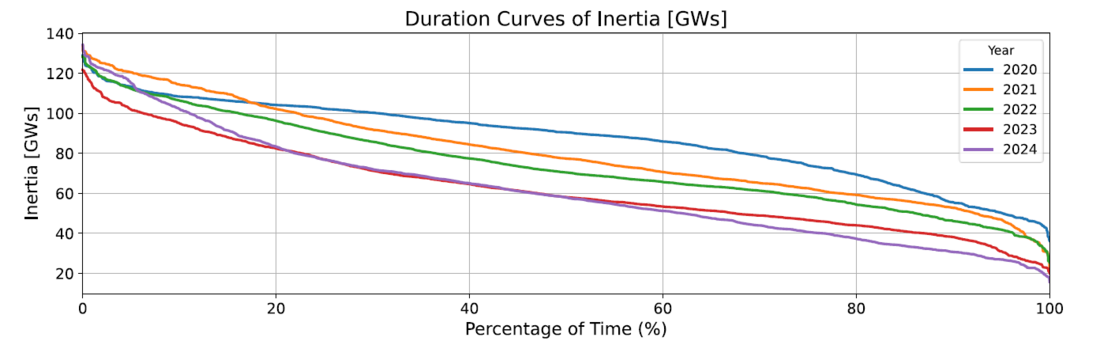
Figure 6 – Duration curves of Synchronous Inertia [GWs] in the Netherlands from 2020 to 2024
A clear drop in inertia is observed every year, with low-inertia situations becoming much more common. In 2020, mean (min) inertia value in the system was 87 (36) GWs, while in 2024 it has dropped to only 61 (15) GWs. Additionally, the standard deviation, a measure of the amount of variations, increased from 19 to 26 GWs over the same period.
Another trend observed in the data is that weekends typically experience lower levels of inertia compared to the weekdays. This is due to the fact that the system demand on the weekends is generally lower, resulting in fewer large synchronous machines scheduled for operation.
Besides monitoring inertia in absolute GWs values, it is also important to relate this to other conditions in the system, such as total generation. This is discussed in the following section.
3. ENTSO-E Project Inertia and Implications for the Netherlands
To mitigate frequency resilience risks briefly discussed in the introduction, “Project Inertia” has been initiated by ENTSO-E, with phase I and phase II results published so far [5, 6].
In the ENTSO-E bottom-up approach presented in [6], inertia constant ?syn is proposed as a relevant metric of inertia. ?syn is measured in seconds, and it is computed as kinetic energy in GWs (see Eq. (1)) relative to the system-level generation at that moment. In this way, inertia constant is not only impacted by the total inertia (GWs) available in the system, but also by the total amount of synchronous and renewable generation infeed at the time. This implies that inertia is to be distributed across Continental Europe weighted by generation levels, which has large implications for high-RES countries like The Netherlands.
According to ENTSO-E reports [5, 6], it is recommended that ?syn of each European country should be maintained above 2 seconds to balance system performance and cost-effectiveness, and limit RoCoF below 1 Hz/s in the majority of plausible system split events. The current recommendation (possibly a requirement in the future) is to meet this value in the 50th percentile of time in the medium term (2035), and 90th percentile in the long term.
4. Projected Inertia Trends in the Dutch Grid
The analysis so far presented historical inertia trends in the Dutch grid. However, for long-term system planning, projected inertia trends are equally important. This is especially relevant considering ambitious energy transition plans of the Netherlands, with further RES integration and consequent inertia reduction. Therefore, forecasted inertia trends are hereby presented.
4.1. Inertia constant projections
By leveraging climate plans and investment scenario data in the Netherlands, along with projections of generation schedules, ?syn forecasts are produced for 2030 and 2035.
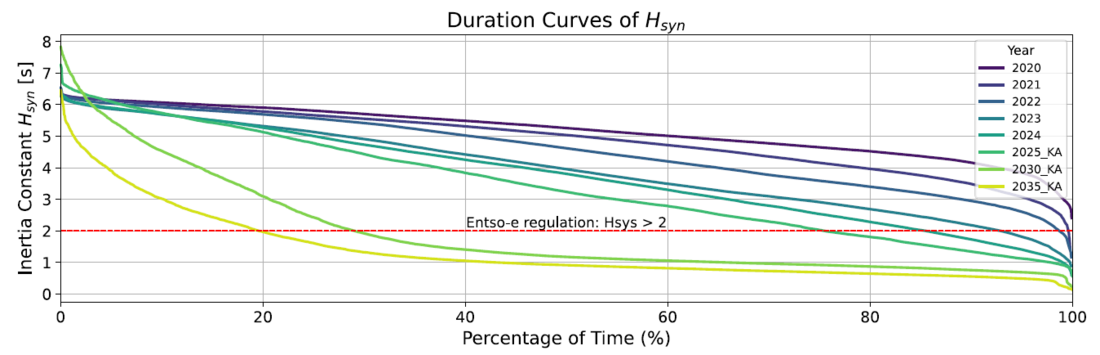
Figure 9 – Inertia constant of the Dutch system for 2020-2024, including forecasts of 2030 and 2035
The plots show the KA (Climate Ambition) scenario, a central scenario based on all existing and planned energy and climate policies [7]. This is depicted with duration curves in Fig. 9. In 2024, the Dutch system observed ?syn < 2 sec. for ~15% of time. However, for 2030 (2035), this is projected to increase drastically, to 70% (80%) of time. This is below both short (50%) and long-term (90%) ENTSO-E recommendations, indicating a persistent inertia shortfall.
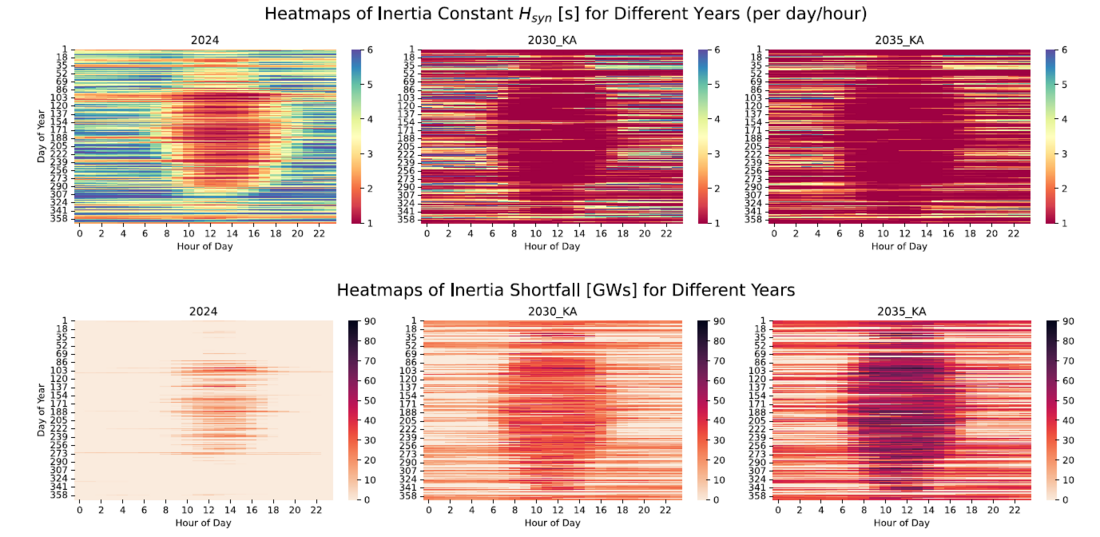
Figure 10 – Heatmap distribution of inertia constant H [s] and inertia shortfall [GWs] in the NL per year
Furthermore, similar as in the previous section, heatmaps of ?syn distribution and related inertia shortfall are shown in Fig. 10. In 2024, ?syn levels were primarily low during sunny hours from April to September. However, as 2030 and 2035 approach, low inertia levels are observed throughout the year, particularly on sunny days. Additionally, very low inertia constants in the night are more often observed, especially in 2035 which is expected to have a much higher share of offshore wind in its generation mix. From the shortfall perspective (lower plots in Fig. 10), inertia shortfall becomes increasingly present and larger in magnitude, reaching up to 90 GWs in the most extreme peak scenarios.
4.2. Inertia shortfall projections for 50th and 90th percentile
ENTSO-E Project Inertia recommends that each country in the Continental European system maintains ?syn > 2 sec. for 50% of time in the short/mid-term and 90% of time in the long term. Fig. 11 puts the inertia shortfall of the Dutch system in this perspective. Observing the orange line (2024 data), some inertia shortfall is already visible, albeit only from approximately 85th percentile. The short/mid-term target of 50th percentile is therefore, for the time being, met.
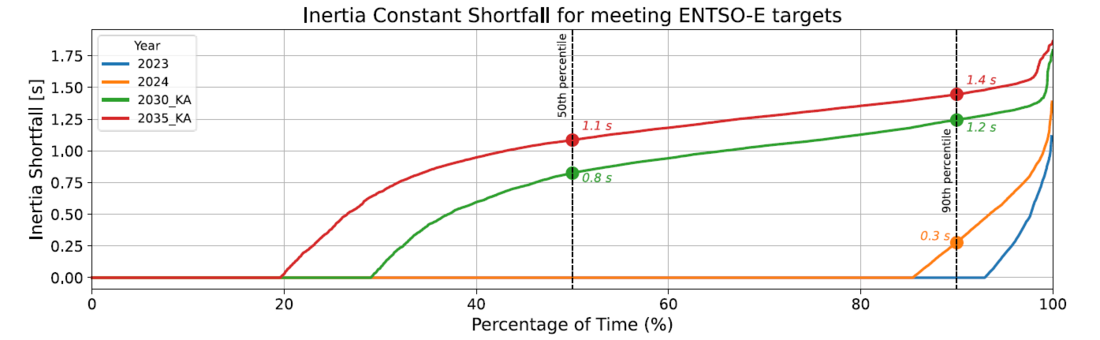
Figure 11 – Expected inertia shortfall in the Dutch grid to reach ENTSO-E recommendations
Nonetheless, 2030 and 2035 projections (green and red line, respectively) indicate that a high inertia shortfall is expected for 50th and (especially) 90th percentile targets. Therefore, without investments in new inertia sources, the Dutch system will face significant inertia shortfall and challenges in meeting the ENTSO-E inertia targets. This requires careful mitigation.
5. Managing Dutch Inertia Needs
To mitigate the inertia shortfall, there are two general types of inertia provision measures:
- Fixed measures (Synchronous condensers/generators, E-STATCOMs…)
- Dynamic measures (inertia markets, grid-forming units, redispatch/must-run…)
As shown in Fig. 12, fixed measures uplift the entire duration curve, as the provided inertia is available at all times (besides (un)planned outages). On the other hand, dynamic measures can be deployed at any moment of inertia shortfall, which means they only lift the low part of the inertia curve, making them more efficient (but arguably more difficult to implement). Each system should therefore balance the two measures in order to reach the most optimal strategy for meeting the expected inertia needs. An initial analysis in this direction is hereby presented for the Dutch system.
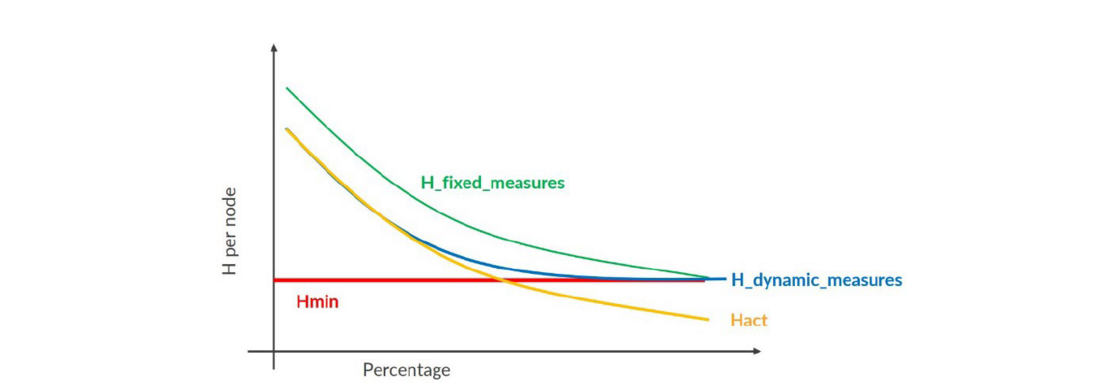
Figure 12 – Impact of fixed and dynamic measures on the inertia constant duration curve [6]
Fig. 13 shows the expected inertia shortfall throughout the day for 2030 and 2035, considering the 50th percentile target. As per Fig. 12, this shortfall can be mitigated with fixed or dynamic measures. An indicative split of these for TenneT NL is shown with blue and green areas. The dark green (dark blue) areas denote the inertia shortfall best met with fixed (dynamic) measures. In other words, these are “no-regret” solutions. It can be seen that 2030 requires relatively limited amount of fixed measures. Some of the no-regret dynamic measures can also be fulfilled by additional fixed measures, as shown by the intersecting light green band and dark blue area.
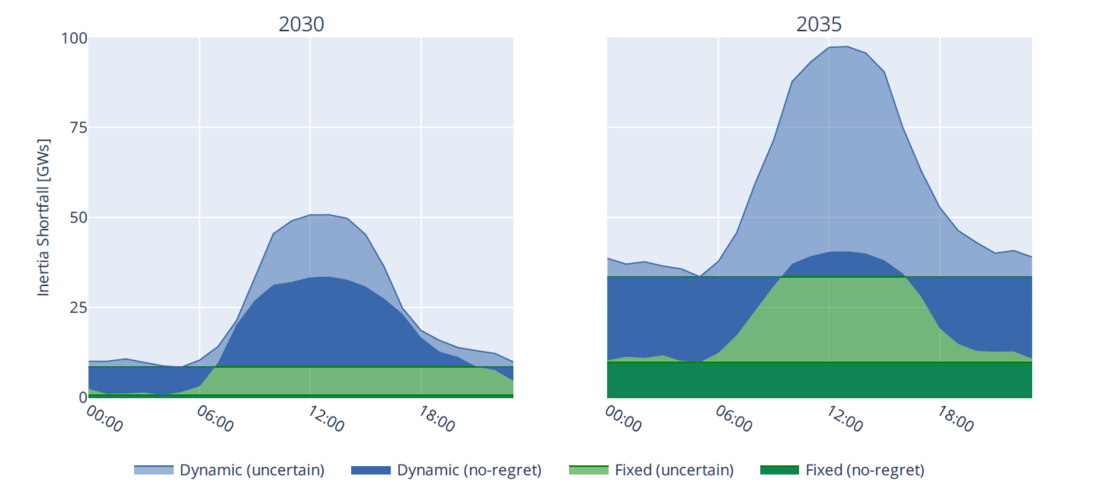
Figure 13 – Meeting the Dutch inertia shortfall (50th percentile) with fixed (green) and dynamic (blue) inertia provision measures, considering uncertainty of three Dutch energy transition scenarios
To mitigate the medium term fixed inertia shortfall, TenneT NL initiated projects for three synchronous condensers with flywheels. However, 2035 indicates a more significant shortfall, which requires further measures. Moreover, both plots show that the need for dynamic measures is high and rising. TenneT NL is therefore exploring various avenues, such as grid-forming pilots and an inertia market. Additionally, increasing fixed measures beyond “no-regret” level is explored, by deploying further synchronous condensers, E-STATCOMs, etc. Additionally, further inertia will be needed from 2035 onwards, considering more stringent long-term 90th percentile ENTSO-E targets. Quantifying these needs remains the topic for future work.
Whilst this analysis is indicative of fixed and dynamic inertia needs and measures, an optimal mix requires further cost-benefit analysis, given many levels of uncertainty and complexity.
6. Conclusions and Future Work
This paper presented an overview of inertia monitoring and analysis of inertia levels and trends in the Dutch power system, followed by an initial analysis of possible mitigation actions.
Inertia has been decreasing over the past years, and the inertia shortfall is expected to grow significantly through 2030, 2035, and beyond. Meeting ENTSO-E targets is, therefore, an important first step in addressing low-inertia risks which lead to more severe frequency resilience challenges manifesting in higher risks of system splits and blackouts.
From the Dutch perspective, the proposed inertia methodology, which relates kinetic energy to system generation, implies very high future inertia needs. While frequency resilience of CESA must be maintained, local over-dimensioning of inertia must be also avoided. Otherwise, disproportionally large local RoCoF areas may appear, as well as risks of small-signal issues due to concentrated masses in a weakened grid. Hence, further refinement of the methodology may be warranted, to ensure balanced and (cost-)efficient inertia distribution across Europe.
Some of the future work considerations for inertia management in the Dutch system include:
- Exploring advanced estimation of total (“effective”) inertia (incl. residual DSO inertia).
- Exploring the impact of grid forming devices and their potential for inertia provision.
- Detailing the upwards vs downwards components of inertia and frequency needs.
- Improving forecasts and including cost estimates for optimal inertia provision strategy.
- Continuing collaboration at ENTSO-E for tackling Europe-wide low-inertia challenges.
Lastly, it is important to note that not only inertia reduction (i.e., frequency resilience) results in stability concerns, but also declining system strength (voltage resilience) [8]. Therefore, mitigation measures should be carefully considered in a holistic system resilience approach.
References
- P. Denholm, T. Mai, R. W. Kenyon, et al. “Inertia and the Power Grid: A Guide Without the Spin”, National Renewable Energy Laboratory, 2020.
- ENTSO-E, “Stability Management in Power Electronics Dominated Systems: A Prerequisite to the Success of the Energy Transition”, Position Paper, 2022.
- P. Buckley, A. Boricic, M. Janssen, et al. ”Improving Frequency Defence Schemes for Critical System Conditions in the Continental European Power System”, CIGRE, 2024.
- ENTSO-E, “Continental Europe Synchronous Area Separation on 24 July 2021”.
- ENTSO-E, “Frequency Stability in Long-term Scenarios and Relevant Requirements”, Project Inertia, 2021.
- ENTSO-E, “Recovering power system resilience in case of system splits for a future-ready decarbonised system: Project Inertia Phase II, Supporting technical report, 2024.
- TenneT TSO B.V., “Investeringsplan Net op land 2024 - 2033”, 2024.
- A. Boricic, “Vulnerability Assessment of Modern Power Systems: Voltage Stability and System Strength Perspectives”, PhD Thesis, TU Delft, Apr. 2024.