Long-term transient signal monitoring at inductive load switching with VCB – objectives and first experiences
Authors
Erik SPERLING, Roberto SCHULZE - OMICRON Electronics GmbH, Switzerland
Christian TREMPLER - 50Hertz Transmission GmbH, Switzerland

Summary
The aim of this paper is to present the concept and initial experiences of an installed long-term transient measurement system. It records every operation of a vacuum circuit breaker (VCB) in the 30 kVvoltage level connecting a 75MVAr compensation shunt reactor (CSR) via the tertiary winding of a 420/123/30 kV power transformer to the distribution and transmission system. Due to volatile renewable generation and reactive power consumption of the connected DSO grid, frequent switching of the CSR with inductive currents up to 1400A was assumed. As well known, the switching of equipment with inductive and capacitive elements with VCBs can be potentially challenging. Fast-fronted voltages penetrate assets and can cause inhomogeneous voltage distributions, which could increase dielectric stresses. Depending on the winding scheme of the CSR, internal over-voltages can occur and stress the insulation system. As the combination of high-voltage VCB and CSR is new in the present grid, it was decided to install a permanent transient monitoring system. This initiative is also motivated by a planned replacement of SF6 CBs by almost maintenance-free and environment-friendly VCBs up to 145 kV. One essential requirement of the measuring system is its ability to send recorded data to a cloud system and to be remotely parameterisable. The chosen transient recorder fulfils this and provides simultaneous acquiring of 4 voltage and 4 current channels with TS =200ns. This sampling rate is sufficient to resolve the fast fronts of voltage and current impulses. The correct measurement of transients with front times of about 1μs to 2μs requires broadband voltage and current transducers. Optimised CR-dividers have been chosen and provide precise impulse voltage measurements. The application of Rogowski coils is one possibility for a broadband measurement of currents with high-frequency content. The entire measurement chain was tested at a university high-voltage lab, and the recorded impulse voltages were compared with a calibrated reference voltage measurement system. Since the commissioning in summer 2023 more than 300 switching events have been recorded so far. A software tool Matlab automatically analyse the data and generates monthly summary reports.
Keywords
vacuum circuit breaker, CR dividers, switching transients, transient recorder, transient monitoring, LPIT, inductive load switching, shunt reactor, Rogowski coil1. Introduction
The switching behaviour of vacuum circuit-breakers (VCB) compared to SF6 circuit-breakers shows significant differences regarding e. g. pre-strike behaviour, re-ignition behaviour, chopping current, rate-of-rise of dielectric strength (RRDS), rate-of-decay of dielectric strength (RDDS), di/dt interrupting capability, post arc current and contact erosion. Hence, the use of high-voltage VCBs might potentially result in different electrical stresses on the connected assets. Therefore, before using VCBs as a standard switching solution of 30 kV compensation shunt reactors, the behaviour of the new technology must be investigated to avoid damages or a shortened lifetime of the installed asset. The first indication was given by a successfully passed type test of inductive current switching of 1600A @ 36 kV acc. to IEC 62271-110, [1]. Subsequently, these first positive experiences shall be verified during grid operation under real conditions on a long-term scale.
As compensating reactors are costly and highly needed systems, the usage of new switching technology needs to be carried out prudently. Hence, a pilot installation was set up using a transient voltage and current measurement system in order to monitor the resulting electrical stresses on the adjacent assets like the compensation shunt reactor. The complete system shall be reliably operated under a real substation environment (e. g. high and low temperatures, EMC). Furthermore, the gathered data must be recorded, transmitted and automatically analysed. The requirements on the measurement systems are not only given by the transients to be measured but also by the subsequent data processing and evaluation as well as operational and environmental parameters.
Since the surface condition of the VCB contacts strongly influences the switching performance and, therefore, also the resulting electrical stresses, it is crucial to evaluate the switching performance over a long-term period. It can be analysed, if e. g. the over-voltages are stable over several months or years or if they are influenced by statistical changes of the contact surface or (if occurring during the pilot phase) by short-circuit current interruptions.
2. Description of Measurement Concept
The motivation is to monitor fast transient over-voltages in a three-phase system with newly installed VCBs under realistic grid conditions and a harsh electrical environment. Both the making during the energisation of the CSR and the breaking during the disconnecting process resp. de-energisation of the CSR shall be monitored. Due to the transient voltage and current characteristics, before and after the operation, specific time windows are defined to record the complete operation but also allow for visualisation and analysis of details of the re-ignitions and CSR discharge activities. The following crucial parameters with high precision are recorded:
- kind of operation (making, breaking)
- time stamp
- type of activate trigger used
- system voltage in rms
- transient peak voltage
- number of re-ignitions
- time interval between re-ignitions
- arcing time analysis
The expected front time of the making and breaking transient voltages are expected at about 1μs as a worst-case value. The second important parameter describes the transient over-voltage peak, defined at a maximum of 4 times the system voltage peak level. Due to the transient overvoltage requirements, specific CR dividers (LPVT) for voltage measurements are used, where capacitive and resistive components are connected in series. For more technical background information about CR dividers, see the following publications [2, 3]. In parallel, the resulting transient current is measured using Rogowski coil (LPCT) technology. Due to the transient characteristic of this parameter, an integrator unit is not used, and the voltage output is directly recorded for analysis. The position of both instrument transformers is illustrated in a schematic drawing see Figure 1, and the real installation is shown in Figure 2.
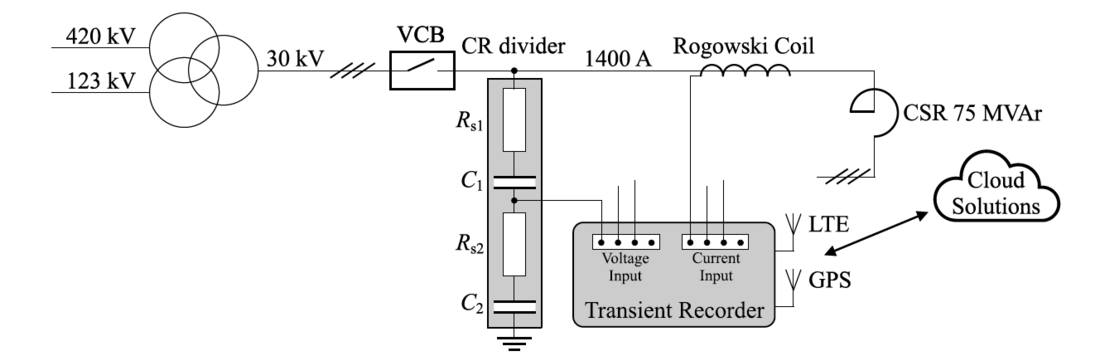
Figure 1 – Single line diagram of the installation
Due to a three-phase system, three voltage and three current signals are recorded simultaneously using a transient recorder (TR) system. This TR is installed close to the CR dividers and must be immune to air- and wire-coupled electromagnetic interference and temperature fluctuations. This system is designed for 24/7 operation, with automatic triggering and recording, but also transmitting the data packages into the cloud. Figure 2 shows where the TR is positioned and mounted into a metallic and high-frequency shielded box.
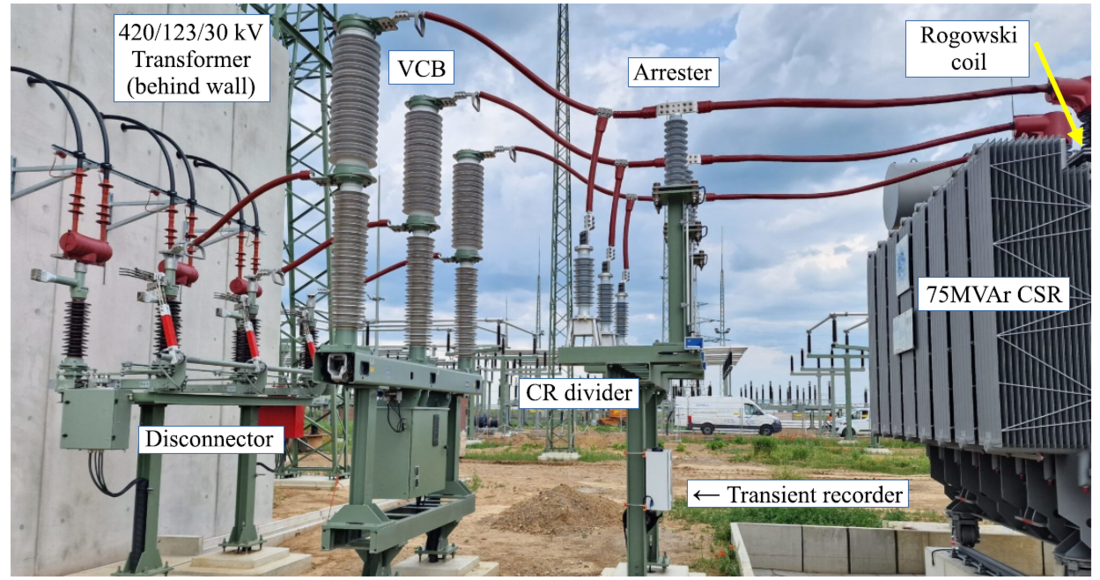
Figure 2 – Picture of the field installation
3. Specific Device Descriptions
3.1. LPVT and LPCT Performance
The LPVT is a CR divider where the primary and secondary capacitance (C1 and C2) are connected in series with primary and secondary resistors (Rs1 and Rs2). When the resistor values are correctly designed, CR dividers are suitable to measure up to lighting impulse voltages with time parameters 1μs/50μs with high precision according to IEC 60060-1. The technical data and specification of the used CR divider are listed in Table 1 below.
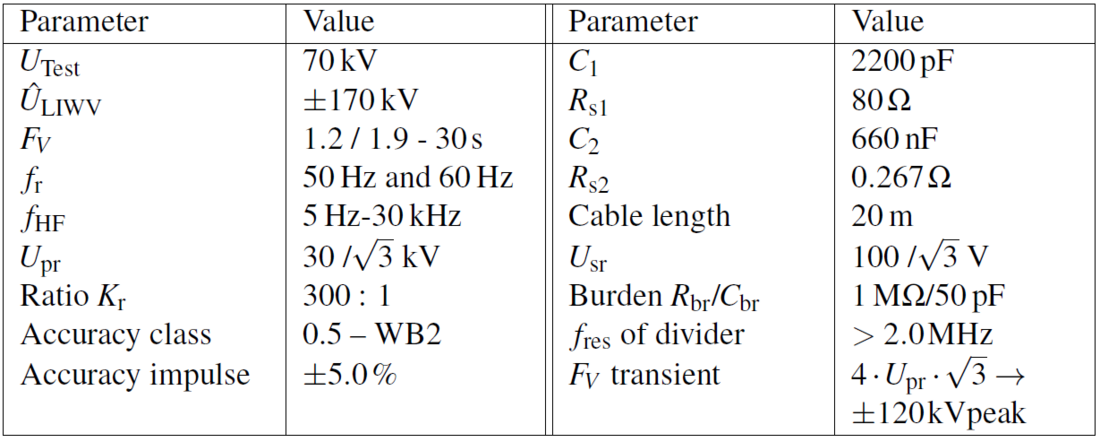
Table 1 – CR divider specification, Um = 36 kV
The 36 kV CR dividers are specified, designed and tested also to measure precisely the rated system voltage at system frequency. The frequency response behaviour of the CR dividers is analysed up to a frequency of 30 kHz. The new wideband class WB2 defined in IEC 61869- 1:2023 is complied with, which opens up the possibility of carrying out PQ measurements in the power grid. All three described applications are available simultaneously. For more information see [2].
The Rogowski coil (LPCT) without integrator unit is positioned around the ground point of the CSR bushing. The technical data are listed in Table 2.
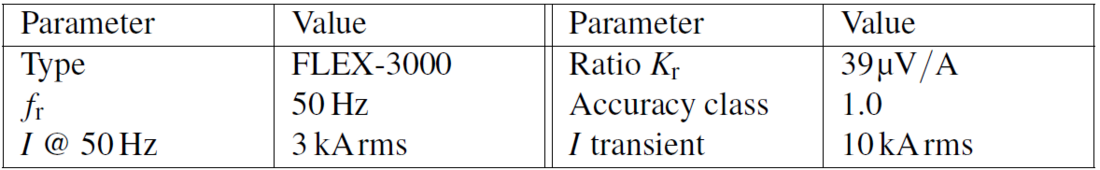
Table 2 – Rogowski coil specification
3.2. Transient Recorder Characteristics
For permanent monitoring of transient voltage and current signals, the TR is designed for 24/7 operation without the presence of experts on-site. Considering this requirement, the following main characteristics are implemented.
- Simultaneous automatic triggering system using two different parameters like voltage and current magnitude and front-time value du/dt and di/dt, as well as circuit-breaker auxiliary contacts.
- Automatic reboot and monitoring restart after supply power interruptions.
- Battery buffered system.
- Event-based automatic data transmission into cloud.
- Remote access to the TR for check, system configuration, and adoption.
- GPS synchronised with ±100 ns from absolute time (NTP, PTP)
- 4G cellular modem, or two Gigabit Ethernet ports, or WIFI antenna port
Crucial technical performance information is listed in Table 3.
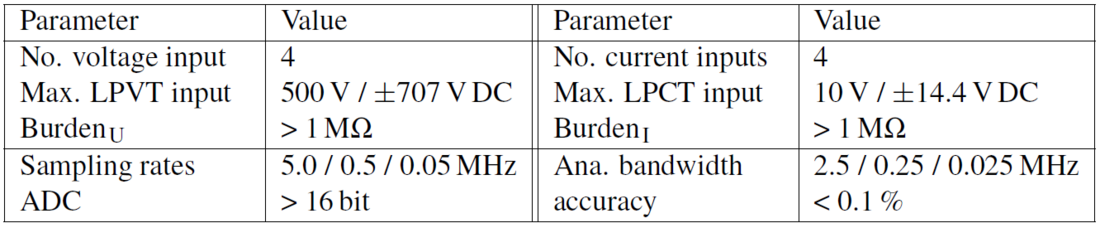
Table 3 – Transient recorder specification
The second sampling rate covers the higher harmonic bands and conducted emission from DC to 25 kHz, and the third sampling rate is for monitoring the harmonic spectrum from 1 to 64th (harmonics and inter-harmonics). All three applications can run simultaneously by the TR.
4. Proof of concept
The proof of concept has been performed at the high-voltage test lab of University of Dresden (TUD) in Germany. The test sequence was performed as listed below.
- Parallel LIWV level variation from ±30 kV to ±120 kV in 10 kV steps
- Parallel LIWV level on all three units, with one and with two disconnect. Cross-check the measured voltage curves with a reference divider signal provided by TUD
- Check if level trigger and rise-time trigger operate independently
- Check of the impact of the grounding strategy
- Check of the wiring between LPITs and TR. Identify the impact for on-site installation.
- Check the TR when the power supply is switched on, off and on. It takes 30 s until the system is rebooted and continues monitoring.
- Check the functionality of the antenna, data transmission into the cloud etc.
The test setup is shown in Figure 3, consisting of an impulse voltage generator, a reference R divider, a capacitive load, the three CR dividers, and signal transmission to the TR unit.
The impulse test voltage has been adjusted according to Table 4.
| Parameter | front-time t1 | time-to-half t2 |
| acc. IEC 60060-1 | 1.2 µs ± 30% | 50 µs ± 20% |
| adjusted parameters | 1.03 µs | 53.7 µs |
Both polarities are used to qualify the transient voltage monitoring system. Figure 4 and Figure 5 illustrate, for example, the reference voltage shape for positive polarity according to standard IEC 60060-1.
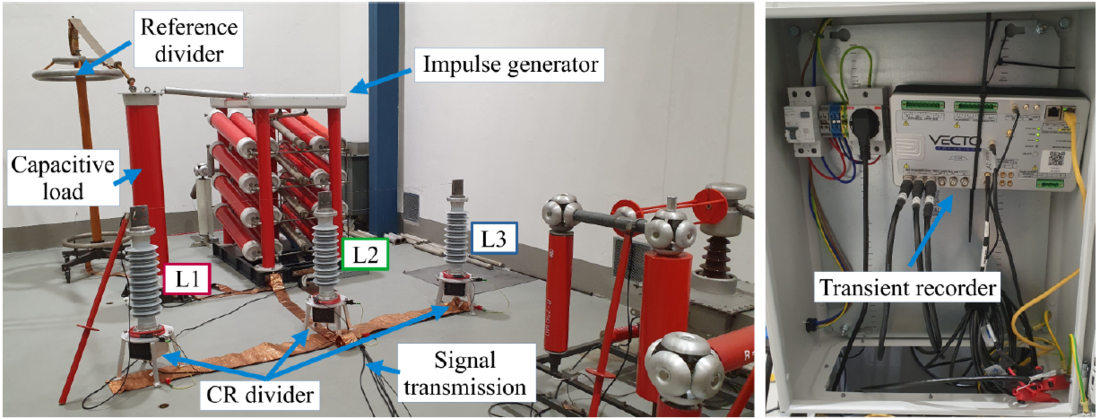
Figure 3 – Left: picture of the test field installation; right: secondary box with TR
For the front-time as well as the time-to-half response, the CR dividers have the same performance compared with the reference R divider. The maximum variation between the measured peak voltages is for the positive polarity 0.78%, and for the negative polarity 0.65 %. It is an excellent performance based on standard IEC 60060-1, which specifies a tolerance of ±3 %. The individual variation of the max. magnitude measured between the CR dividers is < 1.1%.
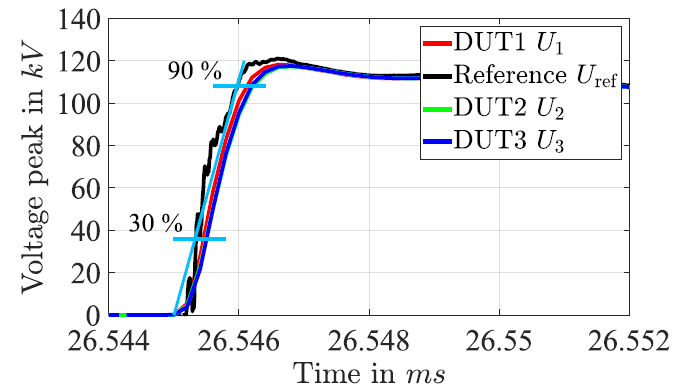
Figure 4 – Comparison - front time
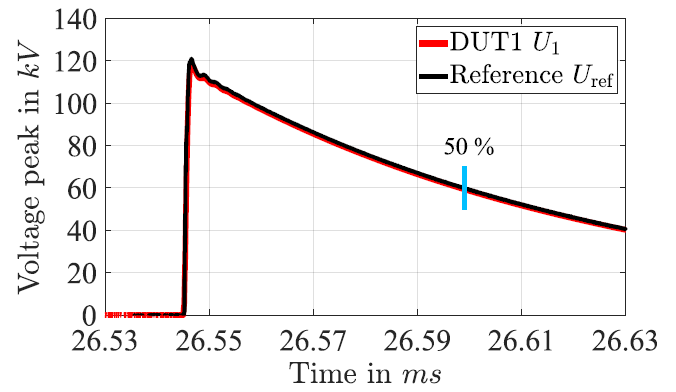
Figure 5 – Comparison - time-to-half
5. First measurement experience
Since the installation of the transient measuring system, more than 300 switching events (156 making and 155 breaking) were recorded. Figure 6 shows typical examples of breaking and making operations. In the case of breaking operation in Figure 6a, 12 re-ignitions occur in phase L3 see details in Figure 7a and row no. 9 in Table 5. Once the CSR was disconnected successfully, the stored energy (electric and magnetic fields) oscillates between the CR divider, parasitic elements and CSR. It dissipated via the resistive component of the remaining separated system. This topic will be discussed in a follow-up publication.
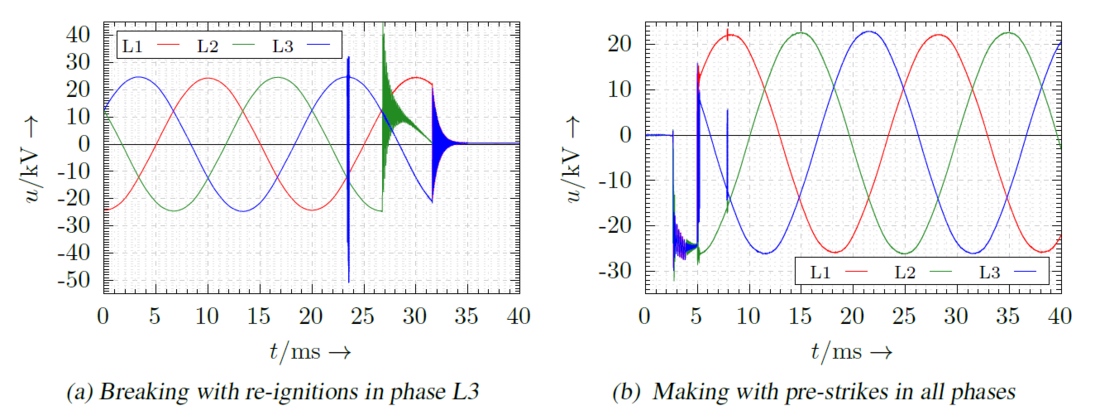
Figure 6 – Examples for breaking and making operations
In contrast to the breaking operation, re-ignitions resp. pre-strikes occur during any making operation and in each phase. This is the experience of this measuring campaign and coincides with literature reports, e. g. [4]. Figure 6b shows the voltage signals during a typical making operation with re-ignitions respectively pre-strikes in every phase as listed in row no. 12 of Table 5. This example contains three segments of pulses, with the centre one shown in detail in Figure 7b.
One result of the automated signal evaluation and subsequent report generation is a table containing time information, the type of operation, the number of re-ignitions in each phase, as well as the amplitude of over-voltages. Table 5 is an excerpt of all recorded events of July 2024.
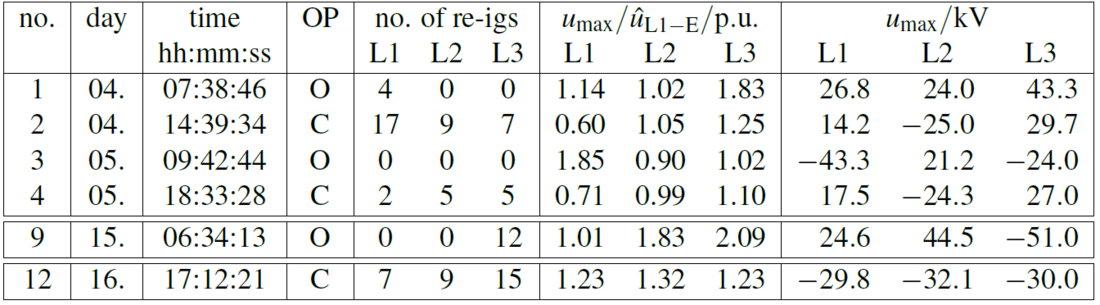
Table 5 – Overview of events (excerpt of 07/2024); O→breaking & C→ making
5.1. Counting the number of re-ignitions
To perform a condition estimation of the VCB contacts, the number of re-ignitions is of interest.
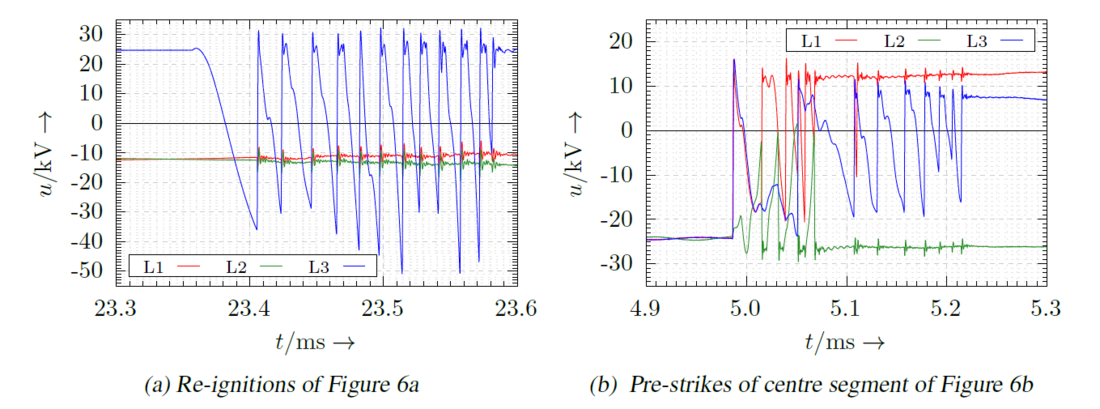
Figure 7 – Zoomed ranges of breaking and making operations of Figure 6
By applying the discrete wavelet transform (DWT), it is possible to detect sudden changes within the voltage signal. Especially the use of the Daubeschies mother wavelet db2 is convenient for this task. The DWT yields spikes at high du/dt, which are relatively easy to count. The main reason for applying the DWT based on filtering is its robustness with respect to disturbances compared to just calculating and analysing time derivatives like du/dt. Of course, this procedure yields the borders of the transient range, which is also analysed with respect to over-voltages as listed in Table 5 and exemplarily displayed in Figure 8.
5.2. Over-voltages within transient range of record
As described above, the electric stress of a single switching event is of interest and, of course, the over-voltages occurring in the transient range are also determined. The zoomed range in Figure 8 belongs to the breaking operation of event no. 9 see Figure 6a. The re-ignitions already shown in Figure 7a are designated as transient range I. The evaluation of the transient range yields the values umax/ûL1−E as well as umax in row no. 9 of Table 5 (over-voltages per phase in p.u. and kV including polarity).
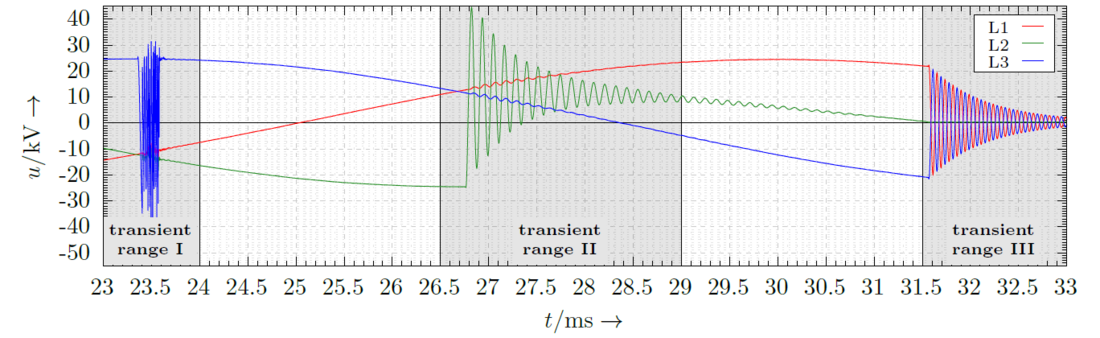
Figure 8 – Complete transient range (event no. 9 in Figure 6a)
5.3. Time distance between re-ignitions
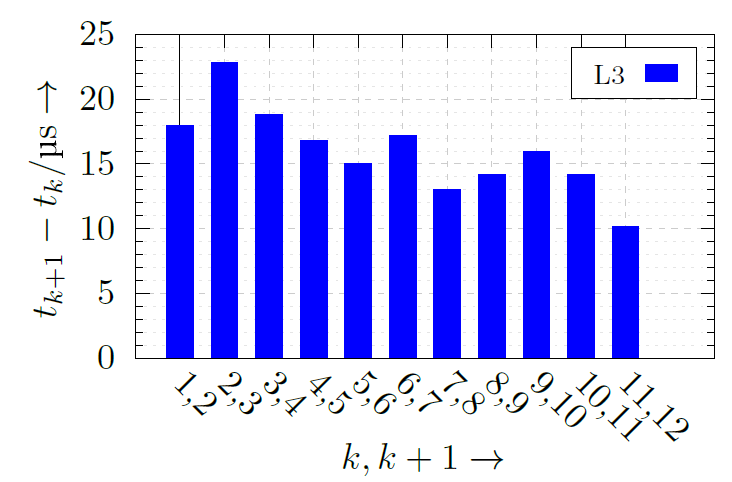
Figure 9 – Time distances between re-ignitions (event no. 9 in Figure 6a)
Generally, the time distance between adjacent re-ignitions shall decrease within a sequence of impulses, which is illustrated in Figure 9. The time distance between two reignitions depends on the di/dt interrupting capability, the rate-of-rise of the transient recovery voltage (TRV) and the rate-of-rise of dielectric strength (RRDS) of the VCB. For an expert, this behaviour might provide information about the condition of the contacts of a VCB and, therefore, might give an indication of the actual interrupting capability regarding inductive load currents.
5.4. Statistical analyses
As the long-term behaviour of the VCB switching performance is of interest, statistical analyses of the obtained over-voltage parameters umax/ûL1−E and number of re-ignitions are done.
5.4.1. Distribution of over-voltages
The frequency distribution of over-voltage occurrence of certain amplitude ranges might give potential information about phase-related conditions of the contacts. Figure 10 shows the frequency distribution of the over-voltage clusters for making operations. The over-voltages in L1 are more evenly distributed, while L3 tends to have slightly higher values. Most of the values are within the clusters 0.8-1.6 p.u.
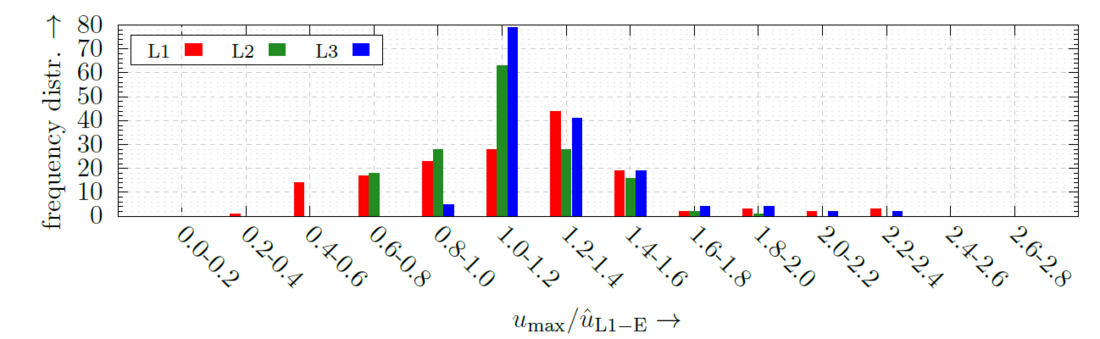
Figure 10 – Frequency distribution of over-voltages during making operations
Figure 11 shows the equivalent frequency distribution for breaking operations. Bright colours indicate all breaking events, while light colours indicate values corresponding to breaking operations without re-ignitions. Most of the values are within the clusters 0.8-1.2 p.u. and 1.8-2.0 p.u. (bars with light colours). The first-pole-to-clear values are in the range of 1.8-2.0 p.u. (transient range II, Figure 8), and the second-pole- and third-pole-to-clear values are in the voltage range of 0.9 – 1.0 p.u. (transient range III, Figure 8). These voltages depend mostly on the LC elements of the circuit and are almost independent of the performance of the VCB.
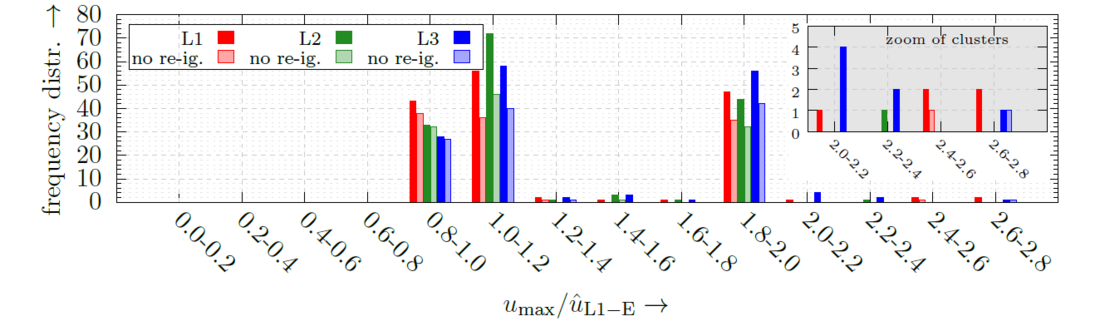
Figure 11 – Frequency distribution of over-voltages during breaking operations
During breaking operations with re-ignitions in the first-pole-to clear, the highest over-voltages are in the range of 2.0-2.8 p.u. It must be noted that these are 11 switching events out of 155 breaking operations only. Hence, significant over-voltages (≥ 2.0 p.u.) are at this application rare events and are so far known yet of no critical amplitude.
5.4.2. Distribution of number of re-ignitions per phase
One further interesting analysis is the phase-related distribution of the number of re-ignitions per operation, which is split into breaking operations in Figure 12 and making operations in Figure 14, resp. regarding Figure 12, almost all breaking operations proceed without re-ignitions (approx. 140 each phase).
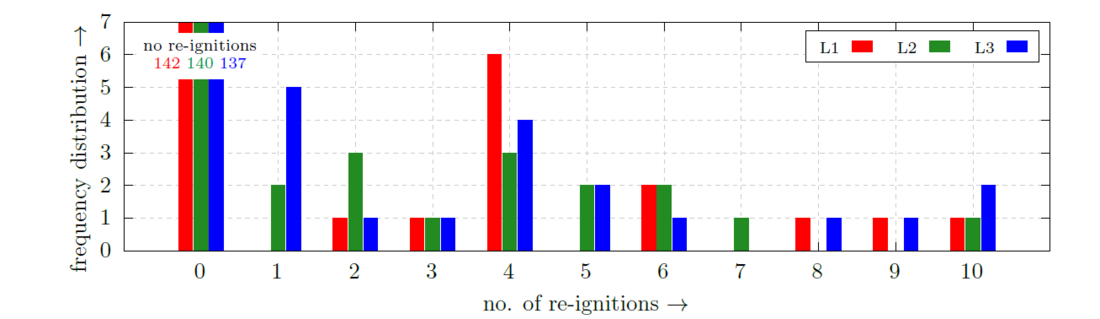
Figure 12 – Frequency distribution of no. of re-ignitions during breaking operations
Figure 13 shows the time difference between the first and last re-ignition for breaking operations with re-ignitions. This time difference gives an indication of how long the VCB tries to interrupt the inductive current dependent on di/dt interrupting performance and rate-of-rise of dielectric strength (RRDS).
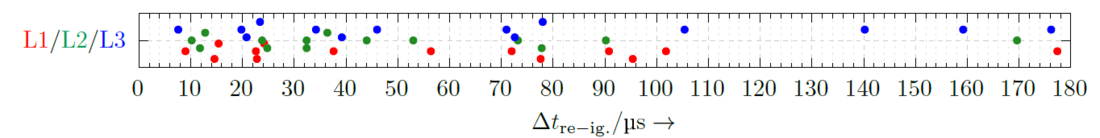
Figure 13 – Breaking operations: time difference between first and last re-ignition
In the case of making operations, it can be derived from Figure 14 that phase L2 generates more pre-strikes compared to L1 and L3. Most making operations have 6 to 9 pre-strikes in phases L1 and L3. At L2, the number of re-ignitions is almost evenly distributed in the range of 8-15.
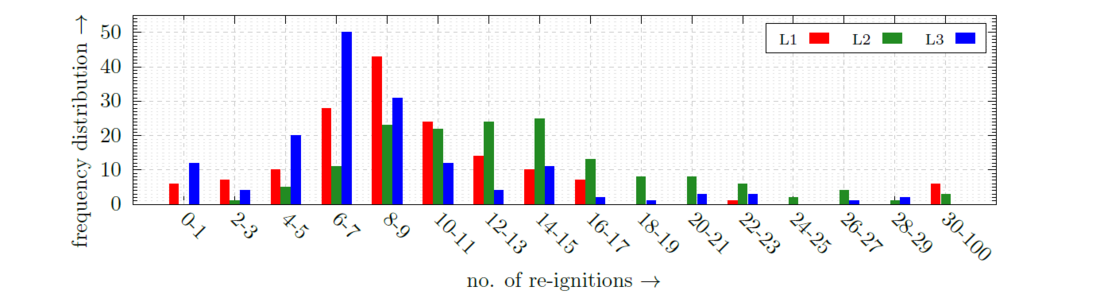
Figure 14 – Frequency distribution of no. of pre-strikes during making operations
6. Summary and Outlook
The transient voltage monitoring system for VCBs for future applications in high-voltage grids provides all the expected and required performance. Since the system is in operation, all events during making and breaking are 100% detected and automatically recorded, time-synchronised and transferred into the cloud. The expected transient voltage curves with front-times up to 1μs were determined and confirmed that a sampling rate of 5MHz is sufficient. The used CR dividers, optimised for measuring the fast-front transients with the given front-time, are correctly designed and tested and provide high precision and sensitivity. The analysis of the recorded events shows that over-voltages of up to 2.8 p.u. can appear, which is in the range of SF6 CBs. The number of re-ignitions is significantly higher, about 6 to 20, compared with 1 or 2 in SF6 CBs [5]. This might possibly impact the health index of high-voltage insulation systems in the installed assets. With this approach, crucial information about the system response in terms of transient peak voltage levels, number of re-ignitions, and the time interval between re-ignitions and arcing time analysis can be recorded and analysed.
Based on the long-term monitoring strategy, a detailed statistical analysis of all parameters will be carried out concerning long-term stability, value trends and changes in transient performance characteristics. Analysing the arcing times via auxiliary contact of the VCB (future) to evaluate the VCB characteristics as a function of arcing time (over-voltages, re-ignitions) is a crucial topic. In the second step, consider the recorded transient currents in the complete analysis. Another focus will be on analysing the recorded parameters that could be used to evaluate the health index of the VCB itself. Additionally, the transient high-frequency emissions into the power grid will be assessed. Based on the findings, the implications of the installed type of asset will be discussed.
A second project of monitoring transient voltages in a 123 kV grid on VCBs at a transformer application is intended to be in operation in 2025. This approach focuses on standard operation under usual conditions.
References
- IEC 62271-110. "High-voltage switchgear and controlgear - Part 110: Inductive load switching". March 2023.
- Erik Sperling, Roberto Schulze, and Thomas Heid. "Investigation of the impact of external stray fields on voltage divider accuracy for 36 kV and 123 kV system voltage level". CIGRE Paris Session 2024, Paper ID-10726, August 2024.
- Thomas Heid, Werner Schöffer, and Dominic Rolle. "High bandwidth low-power voltage transformers for power quality measurement and fast transient monitoring in MV and HV substations - technological overview and experiance from field installations". CIGRE Paris Session, Paper ID-10727, August 2024.
- Marjan Popov, René Peter Paul Smeets, Lou van der Sluis, Hans de Herdt, and Jan Declercq. "Experimental and Theoretical Analysis of Vacuum Circuit Breaker Prestrike Effect on a Transformer". IEEE Transactions on Power Delivery, 24:1266–1274, 2009.
- R.P.P. SMEETS and L.H. te PASKE. Recent Standardization Developments and Testexperiences in Switching Inductive Load Current. In 2015 CIGRE SC A3 and B3 JOINT COLLOQUIUM, number A3-204, pages 1–6, September 2015. Nagoya (Japan).