Estimation of degradation curves for substation equipment using text mining
Authors
T. KOBAYASHI , O. SEGAWA

Summary
This paper describes a method for estimating degradation curves for substation equipment based on the frequency of occurrence of each failure event, described in texts, automatically classified into categories of failure mode. We also propose an application for management of assets based on the classification results. We have previously proposed a basic concept of the method at the 2019 CIGRE Symposium (Chengdu), and have confirmed prospects for the practical application of the proposed method through evaluation using real data. Therefore, this paper presents the details of the method and results.
In the past, we have made the upgrade plan of our transmission system based on the age (expected life) of each substation equipment. However, the conditions of degradation are different for each of them even if they are the same age. One may be in better condition compared to the same age, another one may be in worse.
To solve this problem, we aim to make the upgrade plan based on the risk they have using an index to evaluate the condition of each piece of equipment.
The way to evaluate their condition is using a matrix of two factors "the impact of a failure" and "the probability of failure (PoF)". The method to calculate PoF is based on a numerical index (health index) that indicates the current condition of the equipment and a degradation curve (failure rate curve) that provides a predictive degradation state. We have studied how to make the method. Using them, we have tried to calculate the PoF of each piece of equipment several years from now.
The elements to estimate the degradation curves were not only published research data, but also failure and inspection data that we have accumulated in the past.
We assume that the more amount of failure and inspection data used to create the degradation curves, the better accuracy of the curves. However, if we analyse about all failure data we have, we require too much effort and time. So, we cannot help using only a part of our data to make the degradation curve so far.
In order to use unclassified failure data, we use a text mining system developed by our group. This paper proposes a method for creating a degradation curve by categorising the failure data to estimate the frequency of occurrence of each event. In this method, we used a text classification algorithm based on BERT (Bidirectional Encoder Representations from Transformers), one of the language models with selfsupervised learning. Furthermore, to estimate the curve, we used algorithms such as the Kaplan-Meier method and Weibull analysis based on the classification results of each failure data.
To evaluate the effectiveness of the proposed method, we conducted the experimental evaluations to estimate the degradation curves for MTR and GCB using our failure data. As a result, we confirm the effectiveness of the estimation method using text mining. In future work, we will consider the expansion
of the applicable equipment.
Keywords
text mining, text classification, degradation curve, management of assets, risk base maintenance (RBM),substations equipment
1. Introduction
In the past, we have planned the replacement of our equipment based on the age (expected life) of each piece of substation equipment. The expected life we refer is based on our own definition based on our experience and knowledge from the past. However, the reality is that the actual condition of degradation for them is different, even if they are the same age. For example, some of them may be older but in good condition, while others may be newer but in poor condition. While based on a time-based approach has been used in the past, it will be necessary in the future to develop replacement plans that also include individual condition-based plans. The aim is to formulate a risk-based renewal plan, which will establish indicators to assess the deterioration of individual of them and prioritise the replacement of those with high probability of failure and a high impact on society in the event of a failure.
In formulating risk-based replacement plans, we index the risk of each piece of them using a matrix of two elements as shown in Figure 1: the probability of failure (PoF) for them, the impact of the failure on society and other factors (e.g. the impact of a power outage). To calculate the PoF, we have used Kaplan-Meier method [1] and Weibull fitting method for estimating our degradation curves (failure probability curve) that can be used to predict the condition of degradation after several years. The curves are estimated based on the failure data when it occurs and which part is. For estimating the curve, it is necessary to classify in which part of the equipment each failure data has occurred in. It takes a lot of cost to classify them. To solve this issue, we propose a method using automatic text classification technique. The basic concept was introduced at the CIGRE Symposium in Chengdu in 2019 [2]. Our method is extension of this former work.
In this paper, we conducted experimental evaluations with real failure data and discuss about the effectiveness of the proposed method.

Figure 1 - Concept of risk matrix
2. Estimation of degradation curves for substation equipment
In this chapter, we describe the detail of the proposed method. Our degradation curves are estimated using the Kaplan-Meier method and Weibull fitting method, which is used to calculate evidence data for survival rates in the medical field, etc. This is a method for calculating the survival rate of a subject based on data with censored data (death (failure) after X years). Figure 2 summarises examples of the calculation of degradation curves in the method. For example, if one of the 10 vehicles that have reached two years of age has failed, the survival rate at two years of age is 0.9. When two out of seven units fail at four years of age, the survival rate at four years of age is 0.9 x 2/7 = 0.643.
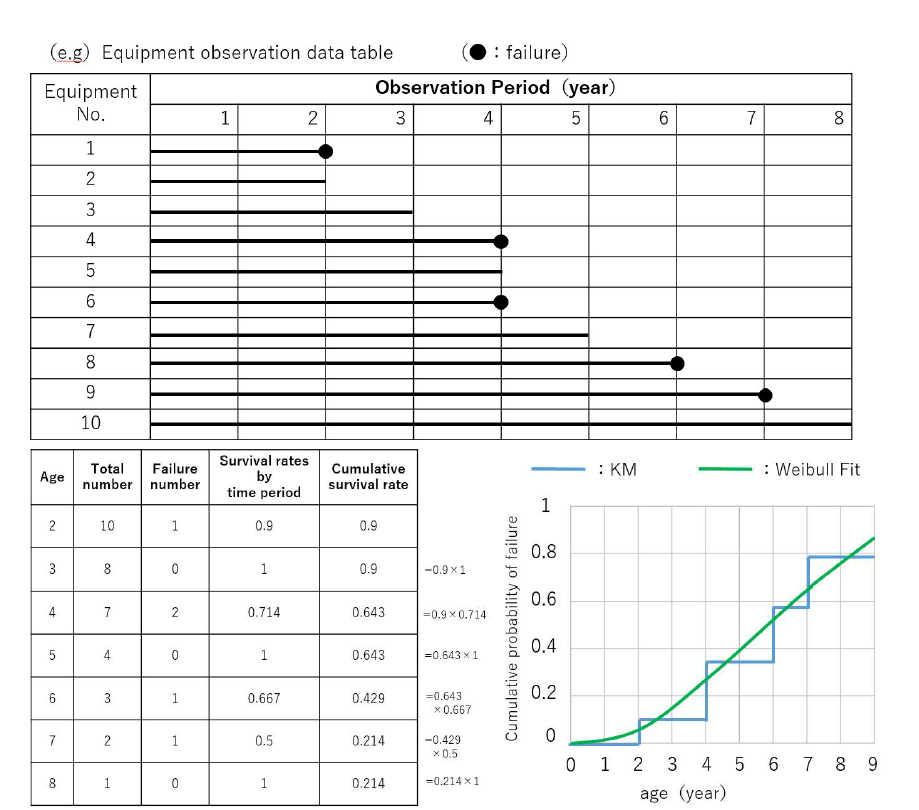
Figure 2 - Approach to estimating degradation curves
However, a disadvantage of the Kaplan-Meier method is that it can only evaluate up to the maximum age of the total sample data. Since we sometimes want to predict the future probability of failure, we estimate curves that include future predictions (green line in Figure 2) by applying the Weibull approximation to the degradation curve estimated by the Kaplan-Meier method (blue line in Figure 2).
When applying this concept to substation equipment, the age at which a failure occurs in our failure data is interpreted as the time of death of the equipment (component), and curves are estimated by applying the above concept. When estimating the curves, we do not estimate degradation curves by collecting data for the entire piece of equipment, but first, estimate degradation curves for each part of the equipment. To synthesise the curves for each part as a curve for a piece of equipment as a single equipment curve, the degradation curves for each part are synthesised using the method that calculates the probability of no failure in any part of the equipment, and the equipment curve is estimated (Figure 3). This method allows curves to be estimated that reflect differences in the presence or absence of a part in each model.
In estimating the degradation curve for each part, it is necessary to classify the failure data into the part where the failure occurred, such as each part A, part B … part n . Currently, text classification is performed manually, but this work requires a large cost (e.g. the number of failure data is more than 10,000 and category to be classified is over 100). In addition, since our degradation curves are based on the concept of updating them while adding information from newly published failure data in the future, it is necessary to continuously classify the failure data published in the future as well. To save cost in this classification work, we investigated the possibility of using text-mining technique for text classification.
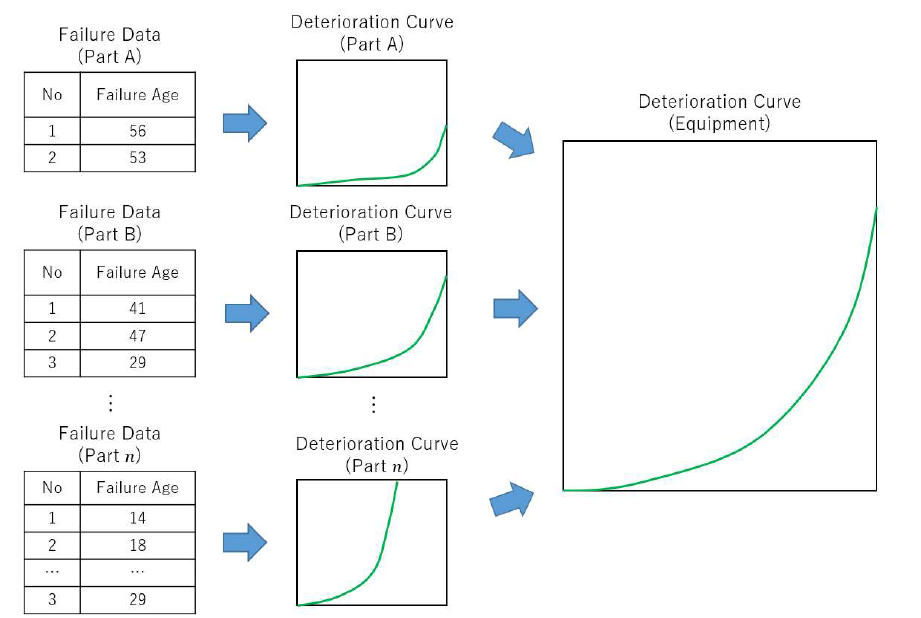
Figure 3 - Composite image of degradation curves
3. Classification of failure data by text mining
This chapter provides a method of text classification technique for failure data. In this study, we used BERT(Bidirectional Encoder Representations from Transformers) [3] based document categorisation method. The overview of the text classification model is shown in Figure 4.
In recent years, machine learning methods that learn “classifiers” representing category features from large corpora with correct labels have become mainstream; several methods based on Attention [4] and self-supervised learning, such as BERT, were proposed around 2018, and their effectiveness was verified in various tasks. In BERT-based categorisation methods, a classification layer is added to a pre-learning model (Encoder), and fine-tuning is performed to generate a classifier for the target task.
In training the classifiers, a pre-trained model was trained using approximately 190MB of text (subset of the cc-100 corpus [5]) automatically collected from the web, and a classification model was generated by fine-tuning using failure data with correct labels.
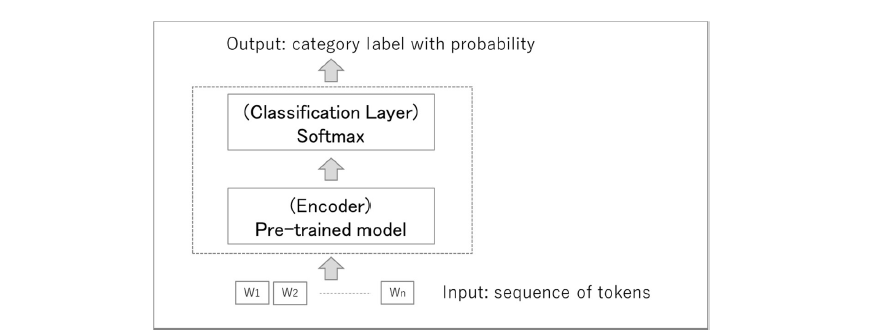
Figure 4 - Text classification model using BERT
4. Experimental evaluation
In this study, two experiments were conducted based on failure data with human generated labels for each category (hereafter referred to as “correct data”). This failure data is derived from our asset information system. The first is to examine the performance of the text classification method. The second is to examine how close the degradation curves estimated by replacing part of the correct data with text classification data can be to the curves using the correct data.
The number of correct data currently available in the failure data is shown in Table 1. We used the classification category which was defined by ETRA (Electric Technology Research Association) [6].
| Equipment | Number of correct data |
|---|---|
| Main Transformer (MTR) | 11,482 |
| Load Tap Changer (LR) | 3,128 |
| Gas Circuit Breaker (GCB) | 4,513 |
| Oil Circuit Breaker (OCB) | 3,692 |
| Vacuum Circuit Breaker (VCB) | 2,244 |
| Line Switch (LS) | 5,231 |
| Static Capacitor (SC) | 851 |
| Lightning arrester (LA) | 320 |
※correct data means human labelled data
Experiment 1
We performed text classification on the failure data to which human classification results were assigned (i.e. correct data). In this experiment, 75% of the randomly selected data from the total correct data in each equipment was training data for the classifier, and the remaining 25% was test data. The degree to which the parts matched those originally assigned by humans was used as the definition of the accuracy. The evaluation result are shown in Table 2 and Figure 5.
| Equipment | Accuracy (%) | Number of training data | Number of categories |
|---|---|---|---|
| MTR | 90.2 | 8,612 | 77 |
| LR | 80.1 | 2,893 | 162 |
| GCB | 78.6 | 3,385 | 378 |
| OCB | 76.4 | 2,769 | 108 |
| VCB | 72.4 | 1,683 | 83 |
| LS | 65.2 | 3,923 | 124 |
| SC | 69.0 | 638 | 189 |
| LA | 82.5 | 240 | 23 |
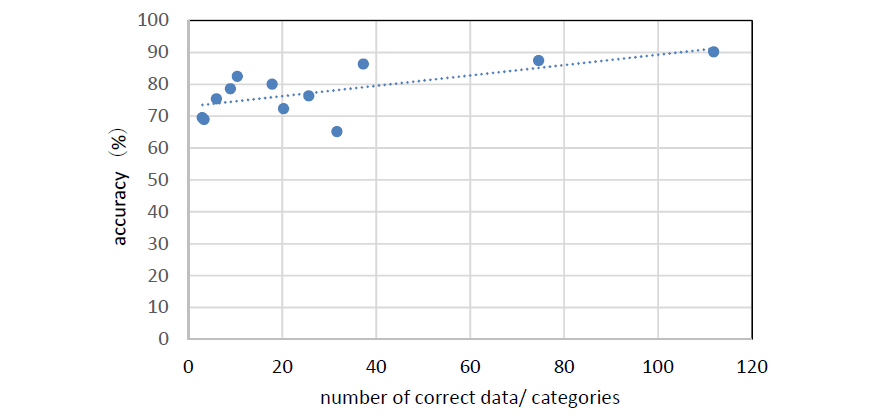
Figure 5 - Correlation between accuracy and the number of training data which is normalized by the number of category
※correct data means human labelled data
Focused on Table 2, the results show that the accuracy varies from a maximum of 90.2% (MTR) to a minimum of 65.2% (LS), depending on the equipment. For detailed analysis, we examined the correlation between accuracy and the number of training data which is normalized by the number of categories. From the results on Table 2 and Figure 5, it is necessary to prepare as much labelled data as possible. Also, the setting of classification categories is important issue.
Experiment 2
Experiment 2 was conducted to investigate how close a degradation curve estimated by replacing some of the correct data with text classification data can be to a curve estimated using only the correct data. The experiment was carried out on MTR and GCB.
In this experiment, a comparison was made with a part of correct data 75% (the same as in Experiment 1), 50% and 25%. For example, in the case of “75% correct data”, 75% of the data is human labelled data and the remaining 25% has been classified by classifier. The estimate degradation curves are shown in Figure 6 and 7.
| Equipment | Number of training data (percentage of correct data) | Number of test data | Accuracy (%) |
|---|---|---|---|
| GCB | 3,385(75%) | 1,128 (25%) | 78.6 |
| 2,256 (50%) | 2,258 (50%) | 75.5 | |
| 1,128 (25%) | 3,385 (75%) | 69.6 | |
| MTR | 8,612 (75%) | 2,870 (25%) | 90.2 |
| 5,741 (50%) | 5,741 (50%) | 87.5 | |
| 2,870 (25%) | 8,612 (75%) | 86.4 |
※correct data means human labelled data

Figure 6 - Comparison of MTR’s degradation curves
※correct data means human labelled data
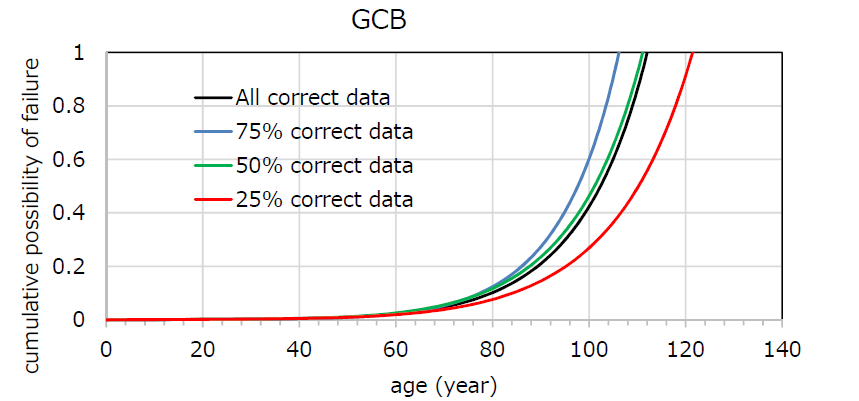
Figure 7 - Comparison of GCB’s degradation curves
※correct data means human labelled data
Focused on Table 3, MTR, which originally have a large amount of correct data, maintained accuracy of 86.4%, even when the amount of human classification in the total data was reduced to 25%. However, in GCB, where the total number of failure data is less than half of MTR’s, the accuracy of text classification fell to 69.6%. Therefore, the results suggest that if we can prepare the equivalent amount of failure data for MTR, our text classification accuracy may be improved.
Focused on Figure 6 and 7, the results show that the difference of the curves were occurred owing to the percentage of human labelled data. The results also show that there are no significant differences in the curves up to the age of 70-80 years. Therefore, we consider that the degradation curves estimated by text classification of three-quarters of the all failure data are practicable in their expected life. However, the difference were increased over 80 age in the curves, so we will continue to investigate the factor of the variability.
Conclusion
This paper proposed a method for estimating degradation curves for substation equipment based on the frequency of occurrence of each failure event, described in texts, automatically classified into categories of failure mode. We also proposed an application for management of assets based on the classification results.
To evaluate the proposed method, we conducted the experimental evaluations to estimate the degradation curves using automatic classification data. The results suggested the effectiveness of the method for estimating degradation curves. We confirmed that text classification technique is useful for augmentation of failure data without label and reducing human cost for data preparation.
In future work, we will improve the method of category classification and evaluate degradation curve estimation in a wider range of equipment.
Our asset management system has been in operation since April 2023, and we have now reached the stage where the degradation curves we have estimated are now being used to devise investment optimisation plans for our business in the future. We will continue to improve the degradation curves to enable more accurate risk assessment by adjusting the degradation curves where necessary and by subdividing the degradation curves for each model.
References
- E. L.Kaplan and P.Meier, “Nonparametric estimation from incomplete observations”. J.Amer. Statist. Assoc. 53 (282): 457–481, 1958.
- S.Noguchi and O.Segawa. “Probability of failure estimation for equipment in substations using text mining”, CIGRE symposium Chengdu 2019.
- J.Devlin, M.-W. Chang, K. Lee, and K. Toutanova, “BERT: Pretraining of deep bidirectional transformers for language understanding", arXiv:1810.04805, 2018.
- D.Bahdanau, K.Cho and Y.Bengio, “Neural machine translation by jointly learninig to align and translate”, Proc. ICLR, 2015.
- A.Conneau et al., "Unsupervised Cross-lingual Representation Learning at Scale", arXiv:1911.02116, 2019
- Japan Electric Technology Research Association “Advanced Maintenance Strategies and Asset management for Substation Equipment” (Volume 78-2 2022)